10-K: Annual report [Section 13 and 15(d), not S-K Item 405]
Published on May 22, 2025
UNITED STATES
SECURITIES AND EXCHANGE COMMISSION
Washington, D.C. 20549
Form 10-K
(Mark One)
| ANNUAL REPORT PURSUANT TO SECTION 13 OR 15(d) OF THE SECURITIES EXCHANGE ACT OF 1934 | |||||
For the fiscal year ended March 31 , 2025
OR
| TRANSITION REPORT PURSUANT TO SECTION 13 OR 15(d) OF THE SECURITIES EXCHANGE ACT OF 1934 | |||||
FOR THE TRANSITION PERIOD FROM TO
Commission File Number 001-39010
(Exact name of Registrant as specified in its charter)
| (State or other jurisdiction of incorporation or organization) |
(I.R.S. Employer Identification No.) |
||||
|
(Address of principal executive offices)
|
(Zip code)
|
||||
Registrant’s telephone number, including area code: (781 ) 530-1000
Securities registered pursuant to Section 12(b) of the Act:
| Title of each class |
Trading
Symbol(s)
|
Name of each exchange on which registered | ||||||||||||
Indicate by check mark if the Registrant is a well-known seasoned issuer, as defined in Rule 405 of the Securities Act. Yes ☒ No ☐
Indicate by check mark if the Registrant is not required to file reports pursuant to Section 13 or Section 15(d) of the Act. Yes ☐ No ☒
Indicate by check mark whether the Registrant (1) has filed all reports required to be filed by Section 13 or 15(d) of the Securities Exchange Act of 1934 during the preceding 12 months (or for such shorter period that the Registrant was required to file such reports), and (2) has been subject to such filing requirements for the past 90 days. Yes ☒ No ☐
Indicate by check mark whether the Registrant has submitted electronically every Interactive Data File required to be submitted pursuant to Rule 405 of Regulation S-T (§232.405 of this chapter) during the preceding 12 months (or for such shorter period that the Registrant was required to submit such files). Yes ☒ No ☐
Indicate by check mark whether the Registrant is a large accelerated filer, an accelerated filer, a non-accelerated filer, smaller reporting company, or an emerging growth company. See the definitions of “large accelerated filer,” “accelerated filer,” “smaller reporting company,” and “emerging growth company” in Rule 12b-2 of the Exchange Act.
| ☒ | Accelerated filer | ☐ | ||||||||||||||||||
Non-accelerated filer |
☐ | Smaller reporting company | ||||||||||||||||||
| Emerging growth company | ||||||||||||||||||||
If an emerging growth company, indicate by check mark if the Registrant has elected not to use the extended transition period for complying with any new or revised financial accounting standards provided pursuant to Section 13(a) of the Exchange Act. ☐
Indicate by check mark whether the Registrant has filed a report on and attestation to its management’s assessment of the effectiveness of its internal control over financial reporting under Section 404(b) of the Sarbanes-Oxley Act (15 U.S.C. 7262(b)) by the registered public accounting firm that prepared or issued its audit report. ☒
If securities are registered pursuant to Section 12(b) of the Act, indicate by check mark whether the financial statements of the Registrant included in the filing reflect the correction of an error to previously issued financial statements. Yes ☐ No ☒
Indicate by check mark whether any of those error corrections are restatements that required a recovery analysis of incentive-based compensation received by any of the Registrant’s executive officers during the relevant recovery period pursuant to §240.10D-1(b). Yes ☐ No ☒
Indicate by check mark whether the Registrant is a shell company (as defined in Rule 12b-2 of the Act). Yes ☐ No ☒
The aggregate market value of common stock held by non-affiliates of the Registrant as of September 30, 2024, the last business day of the most recently completed second fiscal quarter, was $15.9 billion. This calculation does not reflect a determination that certain persons are affiliates of the Registrant for any other purpose.
The Registrant had 299,666,804 shares of common stock outstanding as of May 20, 2025.
DOCUMENTS INCORPORATED BY REFERENCE
Portions of the Registrant’s definitive Proxy Statement for the 2025 Annual Meeting of Stockholders are incorporated by reference in Part III of this Annual Report on Form 10-K. Such Proxy Statement will be filed with the U.S. Securities and Exchange Commission within 120 days of the Registrant’s fiscal year ended March 31, 2025.
Except with respect to information specifically incorporated by reference in this Annual Report on Form 10-K, the Proxy Statement is not deemed to be filed as part of this Annual Report on Form 10-K.
TABLE OF CONTENTS
SPECIAL NOTE REGARDING FORWARD-LOOKING STATEMENTS
This Annual Report on Form 10-K (“Annual Report”) includes certain “forward-looking statements” within the meaning of the Private Securities Litigation Reform Act of 1995, including statements regarding:
•our future financial performance, including our expectations regarding key factors driving future performance, our revenue, annual recurring revenue, gross profit or gross margin, operating expenses, ability to generate cash flow, and billing/revenue mix;
•our ability to navigate the current macroeconomic environment;
•anticipated trends in our business and in the markets in which we operate;
•our ability to anticipate market needs and successfully develop new and enhanced solutions to meet those needs;
•the evolution of technology affecting our offerings, platform and markets, including our plans to continue evolving our technology capabilities, including, but not limited to, artificial intelligence (“AI”);
•our plans to continue investing in research and development and driving innovation to meet customers’ needs and grow our customer base;
•our ability to maintain and expand our customer base and our partner ecosystem;
•our expectations regarding the evolving competitive environment;
•our plans to invest in future growth opportunities that we expect will drive long-term value;
•our ability to sell our offerings and expand internationally;
•our ability to hire and retain necessary qualified employees to grow our business and expand our operations; and
•our ability to adequately protect our intellectual property (“IP”).
These forward-looking statements include, but are not limited to, plans, objectives, expectations, and intentions and other statements contained in this Annual Report that are not historical facts and statements identified by words such as “will,” “expects,” “anticipates,” “intends,” “plans,” “believes,” “seeks,” “estimates” or words of similar meaning. These forward-looking statements reflect our current views about our plans, intentions, expectations, strategies, and prospects, which are based on the information currently available to us and on assumptions we have made. Although we believe that our plans, intentions, expectations, strategies, and prospects as reflected in or suggested by those forward-looking statements are reasonable, we can give no assurance that the plans, intentions, expectations, or strategies will be attained or achieved. Furthermore, actual results may differ materially from those described in the forward-looking statements and will be affected by a variety of risks and factors that are beyond our control including, without limitation, the risks set forth in the summary below, in Item 1A. entitled “Risk Factors” in this Annual Report, and in our other SEC filings. We assume no obligation to update any forward-looking statements contained in this Annual Report as a result of new information, future events, or otherwise.
SUMMARY OF THE MATERIAL RISKS ASSOCIATED WITH OUR BUSINESS
Our business is subject to numerous risks and uncertainties that you should be aware of in evaluating our business. Please see Item 1A. entitled “Risk Factors” in this Annual Report for a discussion of risks that we believe are material. These risks and uncertainties include, but are not limited to, the following:
•We have experienced rapid revenue growth in recent periods, which may not be indicative of our future growth.
•Our quarterly and annual operating results may be adversely affected due to a variety of factors, which could make our future results difficult to predict.
•Market adoption of the solutions that we offer may not grow as we expect, which may harm our business and prospects.
•Our business is dependent on overall demand for observability and related solutions and therefore reduced spending on those solutions or overall adverse economic conditions may negatively affect our business, operating results, and financial condition.
•If we fail to innovate and do not continue to develop and effectively market solutions that anticipate and respond to the needs of our customers, our business, operating results, and financial condition may suffer.
•If our platform and solutions do not effectively interoperate with our customers’ existing or future IT infrastructures, installations of our solutions could be delayed or canceled, which would harm our business.
4
•If we are unable to acquire new customers or retain and expand our relationships with existing customers, our future revenues and operating results will be harmed.
•Failure to effectively expand our sales and marketing capabilities could harm our ability to execute on our business plan, increase our customer base, and achieve broader market acceptance of our applications.
•We face significant competition, which may adversely affect our ability to add new customers, retain existing customers, and grow our business.
•If we are unable to maintain successful relationships with our partners, or if our partners fail to perform, our ability to market, sell, and distribute our applications and services will be limited, and our business, operating results, and financial condition could be harmed.
•Security breaches, computer malware, computer hacking attacks, and other security incidents or compromises could harm our business, reputation, brand and operating results.
•Real or perceived errors, failures, defects, or vulnerabilities in our solutions could adversely affect our financial results and growth prospects.
•Failure to protect and enforce our proprietary technology and IP rights could substantially harm our business, operating results, and financial condition.
5
PART I. FINANCIAL INFORMATION
ITEM 1. BUSINESS
Overview
Dynatrace is advancing observability for today’s digital businesses, helping to transform the complexity of modern digital ecosystems into powerful business assets. By leveraging AI-powered insights, Dynatrace enables organizations to analyze, automate, and innovate faster to drive their business forward. Our vision is a world where software works perfectly.
The Dynatrace platform combines broad and deep observability, continuous runtime application security, and advanced AI to support IT operations, development, security, business, and executive teams. This comprehensive approach enables organizations to optimize cloud and IT operations, accelerate secure software delivery, and improve digital performance.
The Dynatrace platform is built to scale, integrating seamlessly into hybrid, multicloud ecosystems, including major hyperscalers such as Amazon Web Services (“AWS”), Microsoft Azure (“Azure”), and Google Cloud Platform (“GCP”), as well as traditional on-premises and mainframe solutions.
Our customer base includes some of the largest global enterprises. These organizations rely on the Dynatrace platform as part of their plans to accelerate the adoption of cloud-native and AI-native initiatives and to address the related challenges of increasing workloads, dynamic environments, and evolving cybersecurity threats. Our ability to provide sophisticated analytics and our advanced automation capabilities support their operational goals in environments characterized by rapid technological changes. Cloud modernization and the dramatic growth in the use of AI have resulted in an explosion of data and a massive increase in its scale and complexity that are untenable for many organizations to manage as they previously did. As a result, we believe the need for comprehensive end-to-end observability, such as the Dynatrace platform, has become mandatory, especially for larger organizations building resiliency into ever more complex environments. We also believe our company has a significant market opportunity based on the technical differentiation of our platform, our ability to integrate successfully into customers’ cloud ecosystems, and the trust that we have built within our customer base and partner ecosystem.
Key Differentiators
We believe our approach is different from other offerings in three critical ways:
•Dynatrace is an end-to-end platform that enables contextual analysis. We store all data types, including logs, traces, metrics, real user data, and business events, in an integrated, highly performant and massively scalable data lakehouse called GrailTM,, which is the core of the Dynatrace platform. Through our proprietary technology, these data types are stored together in context, and we are able to analyze billions of interdependencies across applications, networks, and infrastructure throughout an enterprise. This provides near real-time end-to-end awareness of an organization’s IT ecosystem that we believe is not possible to replicate without a unified data store with equivalent capabilities.
•The Dynatrace platform is AI-powered. For over a decade, Dynatrace customers have relied on the causal and predictive AI capabilities of our AI engine, Davis®. During our fiscal 2025, we made generative AI capabilities available on the Dynatrace platform through Davis CoPilot, bringing the platform to a much wider array of end users and extending the capabilities of the Dynatrace platform. We believe we have architected our combination of causal, predictive, and generative AI to make AI techniques iteratively more intelligent. Our AI capabilities drive differentiation, with an increasing focus on evolving into an agentic AI platform that can act autonomously to plan, make decisions, and take actions without human intervention. As organizations collect and maintain more data, AI embedded in end-to-end observability and related solutions is often required for reliable prediction and analysis, accurate insights, prevention of issues and problems, and quick identification and resolution when they arise. We believe our experience in AI gives our customers a competitive advantage in developing their own AI initiatives, and we are investing in AI best practices in services, data, and observability to support our customers on their AI journeys and to enable AI practices of our partners.
•The Dynatrace platform is automated. We believe many organizations want a unified platform with broad-based situational awareness that can automatically identify, analyze, repair, and remediate issues and maximize application performance by optimizing the code, underlying infrastructure resources, and software delivery processes. Dynatrace OneAgent® uses automation to discover hybrid, multicloud environments, dynamically instruments applications, and consistently learns and updates without human scripting and user configuration. Our Smartscape® technology continuously updates topological dependencies as the application or operating environment evolves, providing the Dynatrace platform with a representation of relationships between all elements within an environment. We believe this is especially critical during business-impacting threats or incidents. AppEngine and AutomationEngine enable our customers to create custom automations of workflows and processes. Our focus on agentic AI is expected to increase the level and types of automation within the Dynatrace platform.
6
We believe the Dynatrace platform’s integrated approach reduces or eliminates the need for organizations to maintain a variety of disparate and siloed tools, enabling them to:
•improve the reliability and performance of their infrastructure and applications, which can help optimize the experience of their own users;
•improve organizational productivity, decision making and innovation, while also increasing transparency and collaboration between IT, development teams, and other business functions;
•reduce operating costs; and
•mitigate risk.
The Dynatrace Platform
The Dynatrace platform comprises several solutions, including the following:
•Infrastructure Observability provides complete visibility into a customer’s IT infrastructure layer across public and private clouds and hybrid, multicloud environments, including AWS, Azure, GCP, VMware Tanzu, Red Hat OpenShift, and Kubernetes.
•Application Observability monitors the full stack (i.e., front-end and back-end technologies) through APM, distributed tracing, and profiling across public and private clouds and hybrid, multicloud environments.
•AI Observability provides observability to improve the performance, resilience, explainability, and compliance of generative AI applications, large language models (LLMs), and agentic systems.
•Digital Experience allows customers to monitor user experiences across channels with real-user and synthetic monitoring and session replays and encompasses mobile and web applications.
•Log Analytics provide a unified approach to unlock the value of log data in the Dynatrace platform and can be developed for different use cases with enterprise-grade extensibility and customization.
•Application Security automatically and continuously detects runtime vulnerabilities in applications, libraries, and code. It also provides near real-time detection and blocking to help protect against third-party cyber-attacks that can exploit critical vulnerabilities.
•Threat Observability enables AI and runtime-enhanced detection, investigation, and response to cybersecurity events.
•Software Delivery leverages observability and security data to drive workflow automations created with a visual workflow creator or automation-as-code.
•Business Analytics unify data flowing through the Dynatrace platform to provide precise, near real-time answers that enable teams to understand how the performance of their digital services affects critical key performance indicators and provides insights to improve user experiences.
The Dynatrace platform provides the following key benefits to customers through our various proprietary technologies:
•Securely unify, store, and analyze data in context. Grail, our data lakehouse, is a unified storage solution with a massively parallel processing (“MPP”) analytics engine. Grail allows organizations to interconnect and analyze large volumes of different types of data quickly and cost effectively in context, without the overhead, expense, and limitation of storage tiering, re-indexing, and rehydration imposed by alternative solutions.
•Receive answer-centric insights and automation with AI. Davis, our AI engine at the core of the platform, combines causal, predictive, and generative AI to deliver answers, insights, automation, and recommendations, and detect, identify, remediate, and prevent issues. Davis CoPilot democratizes use of the Dynatrace platform to more of our customers’ teams by enabling interaction in natural language to tap into the full power of the platform.
•Create and share custom applications and automations to support all business needs. AutomationEngine supports advanced workflow automation, and AppEngine allows organizations to create and share custom, data-driven applications. Business, development, security, and operations teams can collaborate and innovate faster with greater security and smarter answers.
7
•Visualize and understand environments in near real time. Smartscape automatically identifies and maps interactions and relationships between applications and the underlying IT infrastructure and uses that map to enrich and contextualize data. This helps organizations understand how everything in their environments is connected.
•Automatically capture and pre-process data in any form, from anywhere.
◦OpenPipeline uses high performance, stream processing technology to ingest, enrich, and contextualize data from a variety of sources (such as OpenTelemetry) for in-depth, AI-powered analytics. This helps organizations manage the cost and scale of large amounts of data, understand the context, and address security requirements.
◦OneAgent deploys once on a host and instantly and continuously collects all relevant data and metrics along the full chain of applications that are being delivered. OneAgent helps organizations discover which processes are running on the host and automatically activates instrumentation.
◦PurePath® captures and analyzes timing and code-level context for all distributed traces, end-to-end, across the full stack.
Dynatrace Deployment and Operations
Dynatrace provides out-of-the-box configuration for the leading cloud platforms, such as AWS, Azure, GCP, Red Hat OpenShift, and SAP, the leading AI and agentic AI frameworks and platforms, as well as Kubernetes and coverage for traditional on-premises systems, including mainframe and monolithic applications in a single, easy-to-use, intelligent platform.
The majority of our customers deploy Dynatrace as a Software-as-a-Service (“SaaS”) solution to get the latest Dynatrace features and updates with greatly reduced administrative effort. Our SaaS solution provides customers with the ability to scale up and down rapidly, without having to purchase, provision, and manage their hardware. We also provide options to deploy our platform in customer-provisioned infrastructure, which we call Dynatrace Managed. This offering allows customers the flexibility to maintain control of the environment where their data resides, whether in the cloud or on-premises, combining the simplicity of SaaS with the ability to adhere to their own data security and sovereignty requirements. We automatically upgrade all Dynatrace instances and offer on-premises cluster customers auto-deployment options that suit their specific enterprise management processes.
The Dynatrace Platform Subscription (“DPS”) licensing model provides customers with a flexible, scalable, and transparent subscription for the modern cloud. Under the DPS licensing model, a customer makes a minimum annual spend commitment at the platform level and then consumes that commitment based on actual usage and a straightforward rate card. Any platform capability can be used in any quantity at any time based on the customer’s evolving needs. If a customer consumes more than their minimum annual spend commitment, they are not charged a penalty-style overage and they can continue to use the platform on an on-demand basis, billed monthly at the same rates as pre-paid consumption. Customers can alternatively increase their commitment spend to attain a higher discount. Existing Dynatrace customers can also license individual capabilities in a subscription model. Through a suite of tools in the Dynatrace Account Management portal, we provide customers with a near real-time view of licensed product consumption, with historical analysis at the daily or hourly level. In addition to raw data, these tools also provide customers with forecasting, alerting, and drilldowns that provide insights into their usage patterns.
Customers
As of March 31, 2025, we had approximately 4,100 customers in over 105 countries. Our customers reflect diverse industries including, but not limited to, banking and financial services, government, insurance, retail and wholesale, transportation, and software. For the year ended March 31, 2025, one channel partner accounted for 10% of revenue. No channel partners accounted for more than 10% of revenue for the years ended March 31, 2024 and 2023. There were no end-customers who represented more than 10% of revenue for the years ended March 31, 2025, 2024, and 2023.
Research and Development
We have a strong research and development organization that is responsible for designing, developing, testing, and operating all aspects of our offerings, including addressing new use cases, adding new innovative capabilities, extending the scale and scope of our technology, and embracing modern cloud and AI technologies while maintaining high quality.
We utilize an agile development process with 100% test automation to deliver major software releases throughout the year and hundreds of minor releases, fixes and updates. We believe the full stack monitoring required by dynamic multicloud environments requires a highly efficient and agile process to enable high-performing software across the diverse, dynamic cloud ecosystems of our customers.
8
Sales and Marketing
We take Dynatrace to market through a combination of our global direct sales team and a network of partners, including GSIs, cloud providers, resellers, and technology alliance partners. We target the largest 15,000 global enterprise accounts, which generally have annual revenues in excess of $1 billion, which we believe see more value from our integrated full-stack platform.
Our sales and marketing organizations seek to promote the Dynatrace brand, our platform capabilities, and develop partnerships to drive revenue growth. We utilize a variety of go-to-market strategies, including search-engine optimization, online advertising, free software trials, events, online webinars, and broad content marketing strategies. We nurture our existing customer base through ongoing education, and training, including expansion opportunities. We do this primarily through our digital online channels, such as the Dynatrace blog, Dynatrace Community, and Dynatrace University, as well as our customer event series ‘Perform’ and ‘Innovate.’
Partners
We develop and maintain partnerships that help us market and deliver our offerings to our customers around the world. Our goal is to bring together industry experts and hands-on practitioners to create a world-class partner network. Through this intersection of industry and technology, our partner network extends the sales reach of the Dynatrace go-to-market team, while bringing enhanced value to our customers. This ecosystem contributes in all phases of our go-to-market approach: new sales opportunities, adoption, expansion through the identification of new use cases, integration into other market leading independent software vendors, and connecting us into other companies’ business transformation initiatives.
Our partner network includes:
•Global system integrators. We work closely with a number of strategic GSIs, including Accenture, Atos, Deloitte, DXC, and Kyndryl, to help customers digitally transform their businesses and reduce cloud complexity. We continue to see a robust technical readiness investment from our key strategic GSIs resulting in hundreds of individuals trained or certified on the Dynatrace platform. In addition, we continue to foster relationships with a network of regional systems integrators, including Ahead, Computacenter, Trace3, and World Wide Technology, that help joint customers integrate our offerings into their multicloud ecosystems. These partners extend our scale and reach and collaborate with our direct sales teams, bringing domain expertise in technologies and industries along with additional offerings powered by Dynatrace.
•Cloud providers. We work with the major cloud providers to increase awareness of our offerings and make it easy for customers to access our software. Our software is developed to run in and integrate with leading cloud providers, such as AWS, Azure, and GCP. Our customers are also able to procure our software through leading marketplaces, such as AWS, Azure, SAP, and Google.
•Resellers. Our resellers market, sell and deliver our offerings throughout the world. Our resellers often have a dedicated practice around observability. In addition, our resellers provide a go-to-market channel in countries and regions where we do not have a direct presence.
•Technology alliance partners. We partner with leading innovative technology organizations such as Atlassian, Red Hat, ServiceNow, Snyk, and VMware to develop integrations, best practices, and extended capabilities that help our customers and solution partners achieve faster time to market and enhanced value in dynamic multicloud environments.
Professional Services
Our Dynatrace Services Organization empowers our customers to innovate, automate, and transform the way they work with the Dynatrace platform. Our expertise and cloud modernization practices cover cloud ecosystem integration, automated incident management and problem resolution, DevOps integration, user experience, business intelligence insights, digital business analytics, and more.
Dynatrace University is our global online, self-service education program that provides several learning options for customers and partners to develop their skills around monitoring, managing, integrating, and analyzing multicloud environments and application workloads with Dynatrace.
9
Customer Support
We have an innovative onboarding and support service that is focused on simplifying and streamlining customer experience. We use in-product chat as the primary vehicle for customer interaction to drive adoption and growth, as well as to handle issues and user questions. We maintain a SaaS-like connection to tenants and clusters, both in the cloud and managed on customer provisioned infrastructure. Our customer support also includes automatic product updates and upgrades, online access to documentation, a knowledge base, and discussion forums as well as access to Dynatrace University. We also offer an extra level of success and support services for customers that want to accelerate their adoption of our platform, increase their access to support globally 24/7, and extend their hours of expert coverage.
Our Growth Strategy
Key elements of our growth strategy include:
Extend our technology and market leadership position. We intend to maintain our position as a leading AI-powered observability platform through increased investment in research and development, and innovation. We plan to expand the functionality of our end-to-end Dynatrace platform and invest in capabilities that address new market opportunities. For example, in fiscal 2026, we believe we are well positioned to grow our next generation log analytics offering, which integrates logs, traces, metrics, and other core observability and security data types into a single platform, providing customers with greater value than legacy log management solutions that are viewed as too expensive, providing too little value, or largely operating independently from existing monitoring tools. We also plan to evolve our AI capabilities to drive differentiation, with a focus on evolving into an agentic AI platform that can act autonomously to make decisions and take actions without human intervention. We believe this strategy will enable new growth opportunities and allow us to deliver differentiated high-value outcomes to our customers.
Expand and strengthen our relationships with existing customers. We plan to establish new and deeper relationships within our existing customers’ organizations and expand the breadth of our platform capabilities to provide for expansion opportunities. In addition, we believe the ease of implementation of Dynatrace provides us with the opportunity to expand adoption within our existing enterprise customers, across new customer applications, with cloud-native and development teams, and into additional business units or divisions. We also believe that our DPS licensing model will drive broader consumption of the Dynatrace platform and further expansion opportunities for customers that prefer the flexibility and predictability of pricing under that model. Over 40% of our customer base and more than 60% of our annual recurring revenue (“ARR”) leveraged this flexible, scalable, and transparent subscription approach for the fiscal year ended March 31, 2025. With access to the full Dynatrace platform, DPS customers are able to adopt Dynatrace more broadly across their IT environments, which can lead to increased consumption.
Grow our customer base. We intend to drive new customer growth through ongoing investments in our go-to-market strategy focused on customer segmentation, partner enablement, and continuing to expand our sales motion beyond application performance to include end-to-end observability, tool consolidation, and cloud modernization. We are focused on the largest 15,000 global enterprise accounts, which generally have annual revenues in excess of $1 billion and more complex IT ecosystems and cloud environments. At the start of our fiscal 2025, we increased the focus of our sales force on the largest 500 global companies and strategic enterprise accounts. In addition, we plan to expand our reach internationally to what we believe are large, mostly untapped, markets for our company, while leveraging our sector specialization globally.
Leverage our strategic partner ecosystem. We intend to invest in our strategic partner ecosystem, with a particular emphasis on building cloud-focused, loyal and comprehensive partnerships with global system integrators (“GSIs”) and hyperscaler cloud providers. These strategic partners continually work with their customers to help them digitally transform their businesses and reduce cloud complexity. By working more closely with strategic partners, our objective is to participate in digital transformation projects earlier in the purchasing cycle and enable customers to establish more resilient cloud deployments from the start.
IP
We rely on a combination of patent, copyright, trademark, trade dress, and trade secret laws, as well as confidentiality procedures and contractual restrictions, to establish and protect our proprietary rights. As of March 31, 2025, we had 161 issued patents, 94 of which are U.S. patents, and 82 pending applications, of which 48 are U.S. applications. Our issued patents expire at various dates through July 2043.
We have registered “Dynatrace” and the “Dynatrace” logo as trademarks in the United States and other jurisdictions for our name and our product as well as certain other words and phrases that we use in our business, including “OneAgent,” “PurePath,” “Smartscape,” and “Davis”. We have registered numerous Internet domain names related to our business. We also license software from third parties for integration into our applications and utilize open-source software.
10
We enter into agreements with our employees, contractors, customers, partners, and other parties with which we do business to limit access to and disclosure of our confidential and proprietary information. See the “Risk Factors” section of this Annual Report for a discussion of risks related to our IP.
Competition
The market for observability, analytics, and application security is evolving, complex, and defined by rapidly changing technology and customer needs. As we have expanded our platform capabilities, we increasingly compete with a wider range of vendors. We expect competition to continually evolve as enterprises shift to dynamic multicloud environments and as more mature vendors look to provide a holistic approach in areas of the market that we serve.
The principal competitive factors in our markets are:
•product features, functionality, and reliability;
•AI capabilities;
•automation;
•ease and cost of deployment, use, and maintenance;
•deployment options and flexibility;
•customer, technology, and platform support;
•ability to easily integrate with customers’ software application and IT infrastructure environments;
•the quality of data collection and correlation;
•interoperability and ease of integration;
•pricing (including ease of pricing) and perceived value of offerings; and
•brand recognition.
We compete either directly or indirectly with infrastructure monitoring vendors, APM vendors, log management vendors, digital experience monitoring (“DEM”) vendors, security vendors, open source and commercial open source vendors, point solutions from public cloud providers, and IT operations management and business intelligence providers with offerings that cover some portion of the capabilities that we provide. Our principal competitors include Cisco (which includes AppDynamics and Splunk), Datadog, Elastic, and New Relic.
We also face potential competition from vendors in adjacent markets that may offer capabilities that overlap with ours. We may also face competition from companies entering our market, including large technology companies that could expand their platforms or acquire one of our competitors. See the “Risk Factors” section of this Annual Report for a discussion of risks related to competition.
Sustainability
Overview
We believe that focusing on sustainability is part of our responsibility as a global company. We group our material sustainability topics into three key pillars: sustaining our environment; people, culture, and community; and governance and ethics. With these topics at the forefront, we have embedded our sustainability strategy in our business priorities, mission, purpose, vision, and values. Our people, culture, and community pillar includes human capital management, which we discuss in more detail below.
During our fiscal 2025, we continued to develop and implement programs that drive progress on our sustainability initiatives, which we shared in our annual Sustainability Report in December 2024. A copy of our most recent Sustainability Report is posted on our website at www.dynatrace.com/company/sustainability/. The contents of our Sustainability Reports are not incorporated into this Annual Report and inclusion of the website address above is an inactive textual reference only.
Human Capital Management
Our company’s vitality is fueled by our employees (who we call “Dynatracers”) who represent the more than 35 countries in which we operate. In fiscal 2025, we continued to transform our people, culture, and community initiatives while expanding our global footprint and focusing on long-term growth. Our most senior leaders, including our Chief Executive Officer and Chief People Officer, are visible and engaged advocates of our human capital management strategy and continued to discuss various human capital-related topics with our Board of Directors throughout the fiscal year.
For several years, third party organizations have recognized Dynatrace as an employer of choice around the globe. As of March 31, 2025, we had approximately 5,200 employees, approximately 32% of whom were located in the United States, and approximately 27% of whom were located in Austria. None of our employees are represented by a labor union and some of our employees outside of
11
the United States are represented by a works council. We have not experienced any work stoppages due to labor disputes. We believe that our relations with our employees and works councils are strong.
We have prioritized a number of initiatives as part of our human capital management strategy. These initiatives include: (1) inspiring employee engagement; (2) driving career growth and leadership development; (3) attracting and retaining the right talent; and (4) supporting an inclusive environment.
Inspiring employee engagement – The Dynatrace Work Model, which has hybrid and remote options, is designed to support increased connection and collaboration, driving cultural vibrancy and supporting innovation, all while enabling a flexible work approach. We continually evaluate this model to balance these objectives. For our Dynatrace-operated offices, our goal is to create dynamic and inclusive environments that foster positive experiences. We use global surveys periodically to assess employee engagement and the results provide us with insights regarding specific focus areas.
Driving career growth and leadership development – We utilize a Global Career Framework to align roles across Dynatrace and provide visibility into career paths. This framework helps Dynatracers pinpoint their current positions, navigate potential advancement opportunities, and identify possibilities for internal job changes. We also offer a Performance Enablement program to help strengthen the growth and development of our employees. This experience includes goal setting, coaching, feedback conversations, and a collaborative year-end review. We also embrace a culture of continuous learning and offer various programs in this area.
Attracting and retaining the right talent – In today’s competitive landscape, we believe one of the keys to sustaining growth and innovation is a continuous focus on attracting and retaining the right talent to meet our business needs. We value the health and well-being of our employees and we provide resources to Dynatracers that are focused on this area. Our compensation program is designed to attract, reward, and retain talented individuals who possess the skills necessary to support our business, contribute to our strategic goals, and create long-term value for our stockholders.
Supporting an inclusive environment - We pride ourselves on providing a culture that empowers our employees, fosters inclusion across the entire career experience, and services the communities that we impact. Our presence and talent across more than 35 countries provides us with valuable insights into the experiences and perspectives of different communities around the globe.
Corporate Information
Our principal executive offices are located at 1601 Trapelo Road, Suite 116, Waltham, Massachusetts 02451 and our telephone number is (781) 530-1000. In July 2025, we plan to relocate our principal executive offices to 280 Congress Street, Boston, Massachusetts 02210, as discussed in Part I, Item 2 of this Annual Report. Our website is www.dynatrace.com and our Investor Relations website is https://ir.dynatrace.com. Information contained on, or that can be accessed through, our websites is not incorporated by reference into this Annual Report and should not be considered to be part of this Annual Report, and inclusions of our website addresses in this Annual Report are inactive textual references only.
The Dynatrace design logo and our other registered or common law trademarks, service marks or trade names appearing in this Annual Report are the property of Dynatrace LLC. This Annual Report includes our trademarks and trade names, including, without limitation, Dynatrace, OneAgent®, Smartscape®, PurePath®, Davis® and GrailTM which are our property and are protected under applicable IP laws. Other trademarks and trade names referred to in this Annual Report are the property of their respective owners.
Available Information
Our Annual Reports on Form 10-K, Quarterly Reports on Form 10-Q, and Current Reports on Form 8-K, including amendments and exhibits to these reports filed or furnished pursuant to Sections 13(a) and 15(d) of the Securities Exchange Act of 1934, as amended (the “Exchange Act”), are available free of charge on the Investor Relations section of our website at https://ir.dynatrace.com as soon as reasonably practicable after we file or furnish such material with the U.S. Securities and Exchange Commission (“SEC”). The SEC maintains a website at www.sec.gov that contains our SEC filings and other information regarding us and other companies that file materials with the SEC electronically.
Investors and others should note that we announce material financial information to our investors using our Investor Relations website, press releases, SEC filings and public conference calls and webcasts. We also use these channels to disclose information about the company, our planned financial and other announcements, attendance at upcoming investor and industry conferences, and for complying with our disclosure obligations under Regulation FD. The information we post through these channels may be deemed material. Accordingly, we encourage investors to review the information we make available through these channels.
12
ITEM 1A. RISK FACTORS
Investing in our common stock involves a high degree of risk. You should carefully consider the risks and uncertainties described below, together with all of the other information in this Annual Report on Form 10-K, including the section titled “Management’s Discussion and Analysis of Financial Condition and Results of Operations” and our consolidated financial statements and related notes, before making a decision to invest in our common stock. The risks and uncertainties described below may not be the only ones we face. If any of the risks actually occur, our business, operating results, financial condition and prospects could be materially and adversely affected. In that event, the market price of our common stock could decline, and you could lose all or part of your investment.
Risks Related to Our Business and Industry
We have experienced rapid revenue growth in recent periods, which may not be indicative of our future growth.
We have experienced rapid revenue growth in recent periods. Our annual revenue grew 19%, 23%, and 25% in the years ended March 31, 2025, 2024, and 2023, respectively, compared to the prior year. This revenue growth may not be indicative of our future revenue growth, and we may not be able to sustain revenue growth consistent with recent history, or at all. We believe our ability to continue to increase our revenue depends on several factors, including, but not limited to:
•our ability to attract new customers and retain and increase sales to existing customers;
•our ability to continue to expand customer adoption and usage of our Dynatrace platform;
•our ability to develop our existing platform, introduce new solutions, and enhance and improve existing solutions on our platform;
•continued growth of cloud-based services and solutions;
•our ability to continue to develop offerings and solutions that our customers prefer over those of our competitors;
•our ability to hire and retain sufficient numbers of sales and marketing, research and development, and general and administrative personnel; and
•our ability to expand into new geographies and markets, including the application security and logs markets, and expand our global operations.
If we are unable to achieve any of these, our revenue growth could be adversely affected.
Our quarterly and annual operating results may be adversely affected due to a variety of factors, which could make our future results difficult to predict.
Our annual and quarterly revenue and operating results have fluctuated significantly in the past and may vary significantly in the future due to a variety of factors, many of which are outside of our control. Our financial results in any one quarter may not be meaningful and should not be relied upon as indicative of future performance. If our revenues, earnings, or operating results fall below the expectations of investors or securities analysts in a particular quarter, or below any guidance that we may provide, the price of our common stock could decline. We may not be able to accurately predict our future billings, revenues, earnings, or operating results. Some of the important factors that may cause our operating results to fluctuate from quarter to quarter or year to year include:
•fluctuations in the demand for our solutions, the timing of purchases by our customers, and the length of the sales cycles, particularly for larger purchases;
•fluctuations in the rate of utilization by customers of the cloud to manage their business needs, or a slowdown in the migration of enterprise systems to the cloud;
•the impact of recessionary pressures or uncertainties in the global economy, or in the economies of the countries in which we operate, on our customers’ purchasing decisions and the length of our sales cycles:
•our ability to attract new customers and retain existing customers;
•our ability to expand into new geographies and markets, including the application security and logs markets;
•the budgeting cycles and internal purchasing priorities of our customers;
•changes in go-to-market strategy, customer renewal rates, churn, and our ability to cross-sell additional solutions to our existing customers and our ability to up-sell additional quantities of previously purchased offerings to existing customers;
•the seasonal buying patterns of our customers;
•the payment terms and contract term length associated with our product sales and their effect on our billings and free cash flow;
•changes in customer requirements or market needs;
13
•the emergence of significant privacy, data protection, systems and application security or other threats, regulations, or requirements applicable to the use of enterprise systems or cloud-based systems that we are not prepared to meet or that require additional investment by us;
•changes in the demand and growth rate of the markets for observability, application security, analytics, and AI-enabled solutions;
•our ability to anticipate or respond to changes in the competitive landscape, or improvements in the functionality of competing solutions that reduce or eliminate one or more of our competitive advantages;
•our ability to timely develop, introduce and gain market acceptance for new solutions and product enhancements;
•our ability to adapt and update our offerings and solutions on an ongoing and timely basis in order to maintain compatibility and efficacy with the frequently changing and expanding variety of software and systems that our offerings are designed to monitor;
•our ability to maintain and expand our relationships with strategic technology partners that own, operate, and offer the major platforms on which applications operate, with which we must interoperate and remain compatible, and from which we must obtain certifications and endorsements in order to maintain credibility and momentum in the market;
•our ability to control costs, including our operating expenses;
•our ability to efficiently complete and integrate any acquisitions or business combinations that we may undertake in the future;
•general economic, industry, and market conditions, both domestically and in our foreign markets, including regional or geopolitical conflicts, potential changes in the U.S. and foreign laws and regulations on international trade (e.g., export controls, import tariffs and trade agreements), or other disruptions to commerce;
•the U.S. federal government cancelling, consolidating, or not awarding contracts to us or our customers or suppliers;
•the emergence of new technologies or trends in the marketplace, or a change in the trends that are important to our strategy and the value of our platform in the marketplace;
•foreign currency exchange rate fluctuations;
•the timing of revenue recognition for our customer transactions, and the effect of the mix of subscriptions and services on the timing of revenue recognition;
•extraordinary expenses, such as litigation or other dispute-related settlement payments; and
•future accounting pronouncements or changes in our accounting policies.
Any one of the factors referred to above or the cumulative effect of some of the factors referred to above may result in our operating results being below our expectations and the expectations of securities analysts and investors and any guidance that we may provide or may result in significant fluctuations in our quarterly and annual operating results, including fluctuations in our key performance indicators. This variability and unpredictability could result in our failure to meet our business plan or the expectations of securities analysts or investors for any period. In addition, a significant percentage of our operating expenses are fixed in nature in the short term and based on forecasted revenue trends. Accordingly, in the event of revenue shortfalls, we are generally unable to mitigate the negative impact on margins in the short term.
Market adoption of the solutions that we offer may not grow as we expect, which may harm our business and prospects.
We believe our future success will depend in large part on the growth, if any, in the demand for observability and related solutions that utilize analytics and AI at their core, particularly the demand for enterprise-wide solutions and our ability to provide solutions that meet such ever-evolving needs. We currently target the markets for infrastructure observability, application observability, AI observability, digital experience, log analytics, application security, threat observability, software delivery, and business analytics. It is difficult to predict customer demand, adoption, churn, and renewal rates for our new and existing solutions, the rate at which existing customers expand their usage of our solutions, and the size and growth rate of the market for our solutions. Expansion in our addressable market depends on a number of factors, including the continued and growing reliance of enterprises on software applications to manage and drive critical business functions and customer interactions, increased use of microservices and containers, as well as the continued proliferation of mobile applications, large data sets, cloud computing, and the Internet of Things. If our solutions do not achieve widespread adoption, we are not able to develop new solutions that meet customer needs, or there is a reduction in demand for observability and related solutions generally, it could result in reduced customer purchases, reduced renewal rates, and decreased revenue, any of which will adversely affect our business, operating results, and financial condition.
14
Our business is dependent on overall demand for observability and related solutions and therefore reduced spending on those solutions or overall adverse economic conditions may negatively affect our business, operating results, and financial condition.
Our business depends on the overall demand for observability and related solutions, particularly demand from mid- to large-sized accounts worldwide, and the purchase of our solutions by such organizations is often discretionary. Over the last year, we have observed global economic uncertainty at times as well as lengthening sales cycles. In an economic downturn or during periods of economic or political instability, we believe that our customers or prospects may reduce their operating or IT budgets, which could cause them to defer or forego purchases of observability and related solutions, including ours. Customers may delay or cancel IT projects or seek to lower their costs by renegotiating their vendor contracts or renewals, such as contracts with us. To the extent purchases of observability and related solutions are perceived by existing customers and potential customers to be discretionary, our revenue may be disproportionately affected by delays or reductions in general IT spending. Weak or turbulent global economic conditions or a reduction in observability and related spending, even if general economic conditions remain unaffected, could adversely impact our business, operating results and financial condition in a number of ways, including longer sales cycles, lower prices for our solutions, reduced subscription renewals, and lower revenue. Moreover, any potential U.S. federal government shutdown resulting from budgetary decisions, a prolonged continuing resolution, breach of the federal debt ceiling, a potential U.S. sovereign default, and changes in laws, regulations, or policies, such as the introduction of tariffs, have and may continue to increase uncertainty and volatility in the global economy and financial markets. In addition, any negative economic effects or instability resulting from changes in the political environment and international relations in the United States or other key markets as well as resulting regulatory or tax policy changes may adversely affect our business, operating results, and financial condition.
As the market for observability and related solutions continues to develop, trends in spending remain unpredictable and subject to reductions due to the changing technology environment and customer needs as well as uncertainties about the future.
If we fail to innovate and do not continue to develop and effectively market solutions that anticipate and respond to the needs of our customers, our business, operating results, and financial condition may suffer.
The markets for observability and related solutions are characterized by constant change and innovation, and we expect them to continue to rapidly evolve. Moreover, many of our customers operate in industries characterized by changing technologies and business models, which require them to develop and manage increasingly complex software application and IT infrastructure environments. Our future success, if any, will be based on our ability to consistently provide our customers with an end-to-end, near real-time view into the performance of their software applications and IT infrastructure, provide notification and prioritization of degradations and failures, perform root cause analysis of performance issues, and analyze the quality of their end users’ experiences and the resulting impact on their businesses and brands. If we do not respond to the rapidly changing needs of our customers by developing and making available new solutions and solution enhancements that can address evolving customer needs on a timely basis, our competitive position and business prospects will be harmed, and our revenue growth and margins could decline.
In addition, the process of developing new technology is complex and uncertain, and if we fail to accurately predict customers’ changing needs and emerging technological trends, our business could be harmed. We believe that we must continue to dedicate significant resources to our research and development efforts, including significant resources to developing new solutions and solution enhancements before knowing whether the market will accept them. For example, we have made significant investments in our application security offering and in developing our GrailTM core technology, AutomationEngine, and AppEngine. We also expanded our Davis® AI engine to create the observability industry’s first solution that converged fact-based, causal and predictive AI insights with new generative AI capabilities. We also plan to evolve our AI capabilities to drive differentiation, with a focus on evolving into an agentic AI platform that can act autonomously to make decisions and take actions without human intervention.
Our new solutions and solution enhancements could fail to attain sufficient market acceptance for many reasons, including:
•delays in developing and releasing new solutions or enhancements to the market;
•failures to accurately predict market or customer demands, priorities, and practices, including other technologies utilized by customers in their environments and competitors and partners that they prefer to work with;
•the introduction or anticipated introduction of competing products by existing and emerging competitors;
•the inability to execute our go-to-market strategy effectively, which depends on our sales and marketing teams and our partners to sell solutions for new markets and product categories;
•delays or failures to provide updates to customers to maintain compatibility between Dynatrace and the various applications and platforms being used in the customers’ applications and multicloud environments;
•defects, errors, or failures in the design or performance of our new solutions or solution enhancements;
•the perceived value of our solutions or enhancements relative to their cost; and
•negative publicity about the performance or effectiveness of our solutions.
15
In addition to developing new solutions or solution enhancements using internal resources, we may acquire technologies from a third party, or acquire another company. Any acquisition of this type could be unsuccessful for a variety of reasons, require significant management attention, disrupt our business, dilute stockholder value, and adversely affect our results of operations. For a description of some of the risks related to potential acquisitions, please see the risk below entitled “We may acquire other businesses, products, or technologies in the future which could require significant management attention, disrupt our business or result in operating difficulties, dilute stockholder value, and adversely affect our results of operations.”
To the extent that we are not able to continue to execute on our business model to timely and effectively develop or acquire and market applications to address these challenges and attain market acceptance, our business, operating results, and financial condition will be adversely affected.
Further, we may make changes to our solutions that our customers do not value or find useful. We may also discontinue certain features, begin to charge for certain features that are currently free, or increase fees for any of our features or usage of our solutions. If our new solutions, enhancements, or pricing strategies do not achieve adequate acceptance in the market, our competitive position will be impaired, our revenue may decline or grow more slowly than expected and the negative impact on our operating results may be particularly acute, and we may not receive a return on our investment in the upfront research and development, sales and marketing, and other expenses that we incur in connection with new solutions or solution enhancements.
If our platform and solutions do not effectively interoperate with our customers’ existing or future IT infrastructures, installations of our solutions could be delayed or canceled, which would harm our business.
Our success depends on the interoperability of our platform and solutions with third-party operating systems, applications, cloud platforms, data, and devices that we have not developed and do not control. Any third-party changes that degrade the functionality of our platform or solutions or give preferential treatment to competitive software could adversely affect the adoption and usage of our platform. We may not be successful in adapting our platform or solutions to operate effectively with these systems, applications, cloud platforms, data, or devices. If it is difficult for our customers to access and use our platform or solutions, or if our platform or solutions cannot connect a broadening range of systems, applications, cloud platforms, data, and devices, then our customer growth and retention may be harmed, and our business and operating results could be adversely affected.
Multicloud deployments utilize multiple third-party platforms and technologies, and these technologies are updated to new versions at a rapid pace. As a result, we deliver frequent updates to our solutions designed to maintain compatibility and support for our customers’ changing technology environments and ensure our solutions’ ability to continue to monitor customers’ applications. If our solutions fail to work with any one or more of these technologies or applications, or if our customers fail to install the most recent updates and versions of our solutions that we offer, our solutions will be unable to continuously monitor our customers’ critical business applications.
Ensuring that our solutions are up-to-date and compatible with the technology and multicloud platforms utilized by our customers is critical to our success. We have formed alliances with many technology and cloud platform providers to provide updates to our solutions to maintain compatibility. We work with technology and cloud platform providers to understand and align updates to their product roadmaps and engage in early access and other programs to ensure compatibility of our solutions with the technology vendor’s generally available release. If our relations with our technology partners degrades or ceases we may be unable to deliver these updates, or if our customers fail to install the most recent updates and versions of our solutions that we offer, then our customers’ ability to benefit from our solution may decrease significantly and, in some instances, may require the customer to de-install our solution due to the incompatibility of our solution with the customer’s applications.
If we are unable to acquire new customers or retain and expand our relationships with existing customers, our future revenues and operating results will be harmed.
To continue to grow our business, we need to attract new customers and increase deployment, usage, and consumption of our solutions by existing customers. Our success in attracting new customers and expanding our relationships with existing customers depends on numerous factors, including our ability to:
•offer a compelling, end-to-end platform that combines broad and deep observability, continuous runtime application security, and advanced AI to support IT operations, development, security, business, and executive teams;
•design and execute our sales and marketing strategy;
•effectively identify, attract, onboard, train, develop, motivate, and retain new sales, marketing, professional services, and support personnel in the markets we pursue;
•develop or expand relationships with technology partners, systems integrators, resellers, online marketplaces, and other partners, including strategic alliances and cloud-focused partnerships with GSIs, including Accenture, Atos, Deloitte, DXC, and Kyndryl, and hyperscalers such as AWS, GCP, Azure, and others, some of which may also compete with us;
16
•expand into new geographies and markets, including the business intelligence and data analytics market;
•deploy our platform and solutions for new customers; and
•provide quality customer support and professional services.
Our customers have no obligation to renew their agreements, and our customers may decide not to renew these agreements with a similar contract period, at the same prices and terms or with the same or a greater number of licenses. Although our customer retention rate has historically been strong, some of our customers have elected not to renew their agreements with us, and it is difficult to accurately predict long-term customer retention, churn and expansion rates. Our customer retention and expansion rates may decline or fluctuate as a result of a number of factors, including our customers’ satisfaction with our platform, our customer support and professional services, changes to our go-to-market strategy, our prices and pricing plans, the competitiveness of other software products and services, reductions in our customers’ spending levels, customer concerns about macroeconomic trends, user adoption of our solutions, deployment success, utilization rates by our customers, new product releases and changes to our product offerings. For example, when we updated our go-to-market strategy during our fiscal year 2025, more than 30% of our customer accounts transitioned to new sales representatives. It is difficult to predict whether these changes will achieve their desired effects and a negative impact on retention and other results is possible. If our customers do not renew their agreements, or renew on less favorable terms, our business, financial condition, and operating results may be adversely affected.
Our ability to increase sales to existing customers depends on several factors, including their experience with implementing and using our platform and the existing solutions they have implemented, their ability to integrate our solutions with existing technologies, and our pricing models, including our DPS licensing model. A failure to increase sales to existing customers could adversely affect our business, operating results, and financial condition.
Failure to effectively expand our sales and marketing capabilities could harm our ability to execute on our business plan, increase our customer base, and achieve broader market acceptance of our applications.
Our ability to increase our customer base and achieve broader market acceptance of our solutions will depend to a significant extent on the ability of our sales and marketing organizations to work together to drive our sales pipeline and cultivate customer and partner relationships to drive revenue growth. We have invested in and plan to continue expanding our sales and marketing organizations, both in the United States and internationally. We also plan to dedicate significant resources to sales and marketing programs, including lead generation activities and brand awareness campaigns, such as our industry events, webinars, and user events with an increased investment in digital or online activities. If we are unable to effectively identify, hire, onboard, train, develop, motivate, and retain talented sales personnel or marketing personnel or if our new sales personnel or marketing personnel, online investments are unable to achieve desired productivity levels in a reasonable period of time, or if we do not create an effective strategy for our personnel to execute, our ability to increase our customer base and achieve broader market acceptance of our offerings could be harmed.
We face significant competition, which may adversely affect our ability to add new customers, retain existing customers, and grow our business.
The markets in which we compete are highly competitive, fragmented, evolving, complex, and defined by rapidly changing technology (including, without limitation, new and evolving uses of AI) and customer needs, and we expect competition to continue to increase in the future. A number of companies, some of which are larger and have more resources than we do, have developed or are developing products and services that currently, or in the future may, compete with some or all of our solutions. We have also been expanding the scope of our solutions to include new offerings and we increasingly compete with other companies in new and adjacent markets. Competition could result in increased pricing pressure, reduced profit margins, increased sales and marketing expenses and our failure to increase, or loss of, market share, any of which could adversely affect our business, operating results, and financial condition.
We compete either directly or indirectly with infrastructure monitoring vendors, APM vendors, log management vendors, DEM vendors, security vendors, open source and commercial open source vendors, point solutions from public cloud providers, and IT operations management and business intelligence providers with offerings that cover some portion of the capabilities that we provide. Further, to the extent that one of our competitors establishes or strengthens a cooperative relationship with, or acquires one or more software APM, data analytics, compliance, or network visibility vendors, it could adversely affect our ability to compete. We may also face competition from companies entering our market, which has a relatively low barrier to entry in some segments, including large technology companies that could expand their platforms or acquire one of our competitors. For example, Cisco acquired Splunk in 2024.
Many existing and potential competitors enjoy substantial competitive advantages, such as:
•greater brand recognition and longer operating histories;
•longer-term and more extensive relationships with existing and potential customers, and access to larger customer bases, which often provide incumbency advantages;
17
•broader global distribution and presence;
•larger sales and marketing budgets and resources;
•the ability to integrate or bundle competitive offerings with other products, offerings and services;
•lower labor and development costs;
•greater resources to make acquisitions;
•larger and more mature IP portfolios; and
•substantially greater financial, technical, management and other resources.
Additionally, in certain circumstances, and particularly among large technology companies that have complex and large software application and IT infrastructure environments, customers may elect to build in-house solutions to address their observability and related needs. Any such in-house solutions could leverage open source software, and therefore be made generally available at little or no cost.
These competitive pressures in our markets or our failure to compete effectively may result in fewer customers, price reductions, fewer orders, reduced revenue and gross profit, and loss of market share. Any failure to meet and address these factors could materially and adversely affect our business, operating results, and financial condition.
If the prices we charge for our solutions and services are unacceptable to our customers, our operating results will be harmed.
As the market for our solutions matures, or as new or existing competitors introduce new products, offerings, or services that compete with ours, or if tariffs or tax changes increase the effective price that customers pay for our solutions, we may experience pricing pressure and be unable to renew our agreements with existing customers or attract new customers at prices that are consistent with our current pricing model and operating budget. If this were to occur, it is possible that we would have to change our pricing model or reduce our prices, which could harm our revenue, gross margin, and operating results. Pricing decisions may also impact the mix of adoption among our licensing and subscription models, and negatively impact our overall revenue. Moreover, large global accounts, which we expect will account for a large portion of our business in the future, may demand substantial price concessions. If we are, for any reason, required to reduce our prices, our revenue, gross margin, profitability, financial position, and cash flow may be adversely affected.
We expect our billings and revenue mix to vary over time, which could harm our gross margin, cash flows, and operating results.
Our billings and revenue mix may vary over time due to a number of factors, including the mix of subscriptions and services and the contract length of our customer agreements. Our gross margins, cash flows, and operating results could also be harmed by further changes in billings and revenue mix and costs, together with numerous other factors, including entry into new lower margin markets or growth in lower margin markets, entry into markets with different pricing and cost structures, pricing discounts, increased price competition, and in response to macroeconomic conditions. Any one of these factors or the cumulative effects of certain of these factors may result in significant fluctuations in our revenues, billings, gross margin, and operating results. This variability and unpredictability could result in our failure to meet internal expectations or those of securities analysts or investors for a particular period. If we fail to meet or exceed such expectations for these or any other reasons, the market price of our common stock could decline.
If we are unable to maintain successful relationships with our partners, or if our partners fail to perform, our ability to market, sell, and distribute our applications and services will be limited, and our business, operating results, and financial condition could be harmed.
In addition to our sales force, we rely on partners, including our strategic partners, to increase our sales and distribution of our software and services. We also have independent software vendor partners whose integrations may increase the breadth of the ecosystem in which our solutions can operate, and the size of the market that our solutions can address. We also have partnerships with GSIs, including Accenture, Atos, Deloitte, DXC, and Kyndryl, and hyperscalers such as AWS, GCP, and Azure, on which many of our customers depend, and through which our customers may be able to procure and deploy our solutions. We are dependent on these partner relationships to contribute to enabling our sales growth. We expect that our future growth will be increasingly dependent on the success of our partners and our partner relationships, and if those partnerships do not provide such benefits, our ability to grow our business will be harmed. If we are unable to scale our partner relationships effectively, or if our partners are unable to serve our customers effectively, we may need to expand our services organization, which could adversely affect our results of operations.
Our agreements with our partners are generally non-exclusive, meaning our partners may offer products from several different companies to their customers or have their products or technologies also interoperate with products and technologies of other companies, including products that compete with our offerings. Moreover, some of our partners also compete with us, and if our partners do not effectively market and sell our offerings, choose to use greater efforts to market and sell their own products or those of our competitors or fail to meet the needs of our customers, our ability to grow our business and sell our offerings will be harmed.
18
Many of our customers are also customers of hyperscalers such as AWS, GCP, and Azure. If our solutions fail to interoperate effectively with the hyperscalers’ products, or if our partnerships with one or more of these hyperscalers are not successful or are terminated, our ability to sell additional products or offerings to these customers and our ability to grow our business will be harmed. Furthermore, our partners may cease marketing our offerings with limited or no notice and with little or no penalty, and new partners could require extensive training and may take several months or more to achieve productivity. The loss of a substantial number of our partners, our possible inability to replace them or our failure to recruit additional partners could harm our results of operations. Our partner structure could also subject us to lawsuits or reputational harm if, for example, a partner misrepresents the functionality of our offerings to customers or violates applicable laws or our corporate policies.
We believe the Dynatrace brand is integral to our future success and if we fail to cost-effectively maintain and enhance awareness of our company, our business and competitive position may be harmed.
We believe that maintaining and enhancing the Dynatrace brand and increasing market awareness of our company and our solutions are critical to achieving broad market knowledge of our existing and future solutions. Increasing awareness is important to attract and retain customers, partners, and employees, particularly as we continue to introduce new capabilities and enhancements and expand internationally. In addition, independent industry analysts, such as Gartner and Forrester, often provide reviews of our solutions, as well as those of our competitors, and perception of our solutions in the marketplace may be significantly influenced by these reviews. We have no control over what these or other industry analysts report, and because industry analysts may influence current and potential customers, our brand could be harmed if they do not provide a positive review of our solutions or view us as a market leader.
The successful promotion of the Dynatrace brand and the market’s awareness of our solutions and platform will depend largely upon our ability to continue to offer and market enterprise-grade observability and related solutions, share our thought leadership, and continue to differentiate our solutions successfully from those of our competitors. We have invested, and expect to continue to invest, substantial resources to promote and maintain our brand and generate sales leads, both in the United States and internationally, but there is no guarantee that our awareness strategies will enhance the recognition of our brand or lead to increased sales. If our efforts to promote and maintain our brand are not cost effective or successful, our operating results and our ability to attract and retain customers, partners, and employees may be adversely affected. In addition, even if our brand recognition and customer loyalty increase, this may not result in increased sales of our solutions or higher revenue.
Our sales cycles can be long, unpredictable and vary seasonally, which can cause significant variation in the number and size of transactions that close in a particular quarter.
Many of our customers are large enterprises, whose purchasing decisions, budget cycles and constraints, and evaluation processes are unpredictable and out of our control. During recessionary times, or when there is volatility or uncertainty in the global economy or in the economies of the countries in which we operate, our sales cycles may be elongated and our customers’ purchasing decisions may be delayed or cancelled. In addition, we are experiencing, and we may continue to experience, an increase in the number of large, strategic deals where customers are looking to make broader observability architecture decisions. These deals come with a higher degree of variability, longer sales cycles, greater uncertainty of completing the sale, and specially negotiated terms. The length of our sales cycle, from initial evaluation to payment for our subscriptions, can range from several months to over a year and can vary substantially from customer to customer. Our sales efforts involve significant investment of resources in field sales, partner development, marketing, and educating our customers about the use, technical capabilities, and benefits of our platform and services. Customers often undertake a prolonged evaluation process, which frequently involves not only our platform, but also those of other companies or the consideration of internally developed alternatives, including those using open source software. Some of our customers initially deploy our platform on a limited basis, with no guarantee that they will deploy our platform widely enough across their organization to justify our substantial pre-sales investment. As a result, it is difficult to predict exactly when, or even if, we will make a sale to a potential customer or if we can increase sales to our existing customers.
We have experienced seasonal and end-of-quarter concentration of our transactions and variations in the number and size of transactions that close in a particular quarter, which impacts our ability to grow revenue over the long term and plan and manage cash flows and other aspects of our business and cost structure. Our transactions vary by quarter, with the third and fourth fiscal quarters typically being our largest. In addition, within each quarter, a significant portion of our transactions occur in the last two weeks of that quarter. Large individual sales may also occur in quarters subsequent to those we anticipate, which may make it difficult to forecast our expected sales cycle. If expectations for our business turn out to be inaccurate, our revenue growth may be adversely affected over time and we may not be able to adjust our cost structure on a timely basis and our cash flows and results of operations may suffer.
19
Our ability to succeed depends on the experience and expertise of our senior management team. If we are unable to attract, retain, and motivate our leadership team, our business, operating results, and prospects may be harmed.
Our ability to succeed depends in significant part on the experience and expertise of our senior management team. From time to time, there may be changes in our senior management team resulting from the hiring or departure of executives. In the last two years, we hired a new Chief Customer Officer, Chief Revenue Officer, Chief Marketing Officer, and various new sales and marketing leaders in their organizations, among other leadership changes.
All members of our senior management team are employed on an at-will basis, which means that they are not contractually obligated to remain employed with us and could terminate their employment with us at any time (subject to any applicable notice periods). Accordingly, and despite our efforts to retain our senior management team, they could terminate their employment with us at any time, which could disrupt our operations and negatively impact employee morale and our culture. After their termination, such person could go to work for one of our competitors after the expiration of any applicable non-compete period, and the restrictions on non-competition may in any case be difficult to enforce depending on the circumstances. The loss of members of our senior management team, particularly if closely grouped, could disrupt our operations, negatively impact employee morale and our culture, and adversely affect our ability to formulate and execute our business plan and thus, our business, operating results, and prospects could be adversely affected. If we fail to develop effective succession plans for our senior management team, and to identify, recruit, onboard, train and integrate strategic hires, our business, operating results, and financial condition could be adversely affected.
We rely on highly skilled personnel and if we are unable to attract, retain, or motivate substantial numbers of qualified personnel or expand and train our personnel, we may not be able to grow effectively.
Our success largely depends on the talents and efforts of key technical, sales, and marketing employees and our future success depends on our continuing ability to efficiently and effectively identify, hire, onboard, train, develop, motivate, and retain highly skilled personnel for all areas of our organization. Competition in our industry is intense, and can lead to increased compensation and other personnel costs. In addition, competition for employees with experience in our industry can be intense, particularly in Europe, where our research and development operations are concentrated and where other technology companies compete for management and engineering talent. Our continued ability to compete and grow effectively depends on our ability to attract substantial numbers of qualified new employees and to retain and motivate our existing employees.
Any failure to offer high-quality customer support and professional services may adversely affect our relationships with our customers and our financial results.
We typically bundle customer support with arrangements for our solutions and offer professional services for implementation and training. In deploying and using our platform and solutions, our customers may require the assistance of our services teams to resolve complex technical and operational issues. Increased customer demand for support, without corresponding revenue, could increase costs and adversely affect our operating results. We may also be unable to respond quickly enough to accommodate short-term increases in customer demand for support. If we fail to meet our service level commitments, which relate to uptime or response times, or if we suffer extended periods of unavailability for our solutions, we may be contractually obligated to provide these customers with service credits or we could face contract terminations and be required to provide refunds of prepaid unused fees. Our sales are highly dependent on our reputation and on positive recommendations from our existing customers. Any failure to maintain high-quality customer support and professional services, or a market perception that we do not maintain high-quality product support or services, could adversely affect our reputation, and our ability to sell our solutions to existing and new customers.
We believe that our corporate culture has contributed to our success, and if we cannot successfully maintain our culture as we grow, we could lose the innovation, creativity, and teamwork fostered by our culture.
We believe that a critical component to our success has been a focus on maintaining an entrepreneurial and innovative corporate culture. We believe our culture has contributed significantly to our abilities to innovate and develop new technologies and attract and retain employees. We have spent substantial time and resources in building our team while maintaining this corporate culture. Over our last two fiscal years, our total employee headcount as of March 31, 2025 increased approximately 24% compared to our total headcount as of March 31, 2023 and we also expanded our international employee presence. The addition of new employees from different business backgrounds in different geographic locations, and the significant number of employees who work either on a hybrid or remote basis may make it difficult for us to maintain our corporate culture. If our culture is negatively affected, our ability to support our growth and innovation may diminish.
20
Our Credit Facility contains restrictions that impact our business and expose us to risks that could adversely affect our liquidity and financial condition.
We have access to a Credit Facility in the aggregate amount of $400.0 million. As of March 31, 2025, we had $399.2 million available under the Credit Facility with $0.8 million of letters of credit outstanding. The actual amounts of our debt servicing payments vary based on the amounts of indebtedness outstanding, the applicable interest accrual periods, and the applicable interest rates and fee margins, which vary based on prescribed formulas. The Credit Facility contains various customary covenants (including a financial covenant requiring compliance with a maximum leverage ratio) that are operative so long as our Credit Facility remains outstanding.
If we are unable to generate sufficient cash flow or otherwise to obtain the funds necessary to make required payments under our Credit Facility, or if we fail to comply with the various covenants and other requirements of our set forth in the Credit Facility, we could default under our Credit Facility. Our Credit Facility also contains provisions that trigger repayment obligations or an event of default upon a change of control, as well as various representations and warranties which, if breached, could lead to an event of default. Any such default that is not cured or waived could result in an acceleration of indebtedness then outstanding under our Credit Facility, an increase in the applicable interest rates under our Credit Facility, and a requirement that our subsidiaries that have guaranteed our Credit Facility pay the obligations in full, and would permit the lenders to exercise remedies with respect to all of the collateral that is securing our Credit Facility, including substantially all of our and the subsidiary guarantors’ assets. We cannot be certain that our future operating results will be sufficient to ensure compliance with the covenants in our Credit Facility or to remedy any defaults under our Credit Facility. In the event of any default and related acceleration, we may not have or be able to obtain sufficient funds to make any accelerated payments. Any such default could have a material adverse effect on our liquidity, financial condition, and results of operations.
Risks Related to Information Technology, IP, and Data Security and Privacy
Security breaches, computer malware, computer hacking attacks, and other security incidents or compromises could harm our business, reputation, brand, and operating results.
We have in the past been, and may in the future be, the target and victim of cybersecurity attacks, including email phishing and other types of attacks. In general, security incidents, breaches, and compromises have increased in sophistication and have become more prevalent across industries and may occur on our systems; on the systems of third parties that we use to host our solutions or SaaS solutions that we use in the operation of our business; on the systems or libraries of third parties that we use to develop our products; or on third-party hosting platforms on which our customers host their systems. These security incidents or compromises may be caused by, or result in, but are not limited to, security breaches, computer malware or malicious software, ransomware, phishing attacks, computer hacking, denial of service attacks, security system control failures in our own systems or vendor systems that we or our customers use, software vulnerabilities, social engineering, sabotage, malicious downloads, and the errors or malfeasance of our own or our customers’ or vendors’ employees. Although we have taken significant measures to detect, effectively remediate, and prevent future phishing and other attacks and security threats, we cannot be certain that our efforts will be effective to prevent and remediate all attacks and security threats. As a result, unauthorized access to, security breaches, incidents, or compromises of, or denial-of-service attacks against our platform could result in the unauthorized access to, or use of, and/or loss of, our data, as well as loss of IP, customer data, employee data, trade secrets, or other confidential or proprietary information. In particular, because we utilize a multi-tenant platform for our SaaS solution, any security breach, incident, or compromise could potentially affect a significant amount of our customers.
The consequences of a security breach, incident, or compromise may be more severe if customers have chosen to configure our platform to collect and store confidential, personal, sensitive, or proprietary information. Our customers determine, through their configuration, the nature of the customer data processed by Dynatrace, and accordingly the content of the notices that they provide to data subjects as well as the consents that they obtain, if they do, in fact, obtain consent. As such, our risks are also affected by how our customers obtain consent or provide transparency to the individuals whose data is provided by the customer to Dynatrace. If our customers fail to comply with applicable law or fail to provide adequate notice or to obtain consent, we could be exposed to a risk of loss, litigation, or regulatory action, and possible liability, some or all of which may not be covered by insurance, and our ability to operate our business may be impaired.
We and certain of our service providers have experienced and may in the future experience disruptions, outages, and other performance problems on our internal systems due to service attacks, unauthorized access, or other security related incidents or compromises affecting personal information. Any security breach, incident, or compromise or loss of system control caused by hacking, which involves efforts to gain unauthorized access to information or systems, or to cause intentional malfunctions or loss, modification, or corruption of data, software, hardware or other computer equipment and the transmission of computer malware could harm our business, operating results, and financial condition, and expose us to claims arising from loss or unauthorized disclosure of confidential or personal information or data and the related breach of our contracts with customers or others, or of privacy or data security laws. If an actual or perceived security incident, breach, or compromise occurs, the market perception of the effectiveness of our security controls could be harmed, our brand and reputation could be damaged, we could lose customers, and we could suffer
21
financial exposure due to such events or in connection with remediation efforts, investigation costs, regulatory fines, including fines assessed under the European General Data Protection Regulation (“GDPR”) or other privacy laws, private lawsuits, and changed security control, system architecture, and system protection measures.
We have administrative, technical, and physical security measures in place, as well as policies and procedures in place to contractually require third parties to whom we transfer data to implement and maintain appropriate security measures. We also proactively employ multiple methods at different layers of our systems to defend against intrusion and attack and to protect our data. However, because the techniques used to obtain unauthorized access or to compromise or sabotage systems change frequently and generally are not identified until they are launched against or even penetrate a target, we may be unable to anticipate these techniques or to implement adequate preventative measures that will be sufficient to counter all current and emerging technology threats. We may therefore experience security breaches, incidents, or compromises that may remain undetected for extended periods of time. Vendors’ or suppliers’ software or systems may be susceptible or vulnerable to breaches and attacks, which could compromise our systems. A vendor or other supply chain-related breach or compromise could spread to our own systems or affect our operations or financial systems in material ways that we cannot yet anticipate.
A majority of our employees have the ability to work either partially or fully remote. Certain security systems in homes or other remote workplaces may be less secure than those used in our offices, which may subject us to increased security risks, including cybersecurity-related events, and expose us to risks of data or financial loss and associated disruptions to our business operations. We may also be exposed to risks associated with the locations of remote workers, including exposure to compromised Internet infrastructure. If we are unable to effectively manage the cybersecurity and other risks of remote work, our business could be harmed or otherwise negatively impacted.
Because data security is a critical competitive factor in our industry, we make statements in our privacy policies, our online product documentation, and in our marketing materials describing the security of our platform, including descriptions of certain security measures we employ or security features embedded within our offerings. In addition, our customer contracts include commitments related to security measures and data protection. Should any of these statements be untrue, become untrue, or be perceived to be untrue, even if through circumstances beyond our reasonable control, or if any of these security measures or features prove to be ineffective or are perceived to be ineffective, we may face claims (including claims of unfair or deceptive trade practices or breach of regulations, including GDPR) brought by the U.S. Federal Trade Commission, state, local, or foreign regulators (e.g., a European Union-based data protection authority) or private litigants, and breach of contract.
While we believe that we maintain a sufficient amount of insurance to cover certain risks and incidents related to data security, our insurance coverage may not always cover all costs or losses. In addition, we cannot be certain that sufficient insurance will continue to be available to us on commercially acceptable terms in the future. Any large, successful claim that exceeds our insurance coverage or any changes in insurance availability and requirements could have a material adverse impact on our financial condition and reputation.
Interruptions or disruptions with the delivery of our SaaS solutions, or third-party cloud-based systems that we depend on in our operations, may adversely affect our business, operating results, and financial condition.
Our business and continued growth depends on the ability of our customers to access our platform and solutions, particularly our cloud-based solutions, at any time and within an acceptable amount of time. In addition, our ability to access certain third-party SaaS solutions is important to our operations and the delivery of our customer support and professional services, as well as our sales operations.
We have experienced, and may in the future experience, service disruptions, outages, and other performance problems both in the delivery of our SaaS solutions, and in third-party SaaS solutions we use due to a variety of factors, including infrastructure changes, malicious actors including disgruntled employees, human or software errors, or capacity constraints. We have experienced disruptions, outages, or performance problems in the past causing some of our services to be unavailable for a limited period of time. While none of these occurrences have been material to our business, future events could be more impactful. We utilize a multi-tenant structure, meaning that generally, our customers are hosted on a shared platform. As such, any interruption in service could affect a significant number of our customers. In some instances, we or our third-party service providers may not be able to identify the cause or causes of these performance problems within an acceptable period of time. It may become increasingly difficult to maintain and improve the performance of our SaaS solutions as they become more complex. If our SaaS solutions are unavailable or degraded or if our customers are unable to access features of our SaaS solutions within a reasonable amount of time or at all, our business would be adversely affected. In addition, if any of the third-party SaaS solutions that we use were to experience a significant or prolonged outage or security breach, our business could be adversely affected.
22
We currently host our Dynatrace solutions on cloud infrastructure hyperscaler providers, such as AWS, Azure and GCP. Our Dynatrace solutions reside on hardware operated by these providers. Our operations depend on protecting the virtual cloud infrastructure hosted by a hyperscaler by maintaining its configuration, architecture, features, and interconnection specifications, as well as the information stored in these virtual data centers and which third-party Internet service providers transmit. Although we have disaster recovery plans, including the use of multiple hyperscaler locations, any incident affecting a hyperscaler’s infrastructure that may be caused by fire, flood, severe storm, earthquake, or other natural disasters, actual or threatened public health emergencies, cyber-attacks, terrorist or other attacks, and other similar events beyond our control could negatively affect our platform and our ability to deliver our solutions to our customers. A prolonged hyperscaler service disruption affecting our SaaS platform for any of the foregoing reasons would negatively impact our ability to serve our customers and could damage our reputation with current and potential customers, expose us to liability, cause us to lose customers, or otherwise harm our business. We may also incur significant costs for using alternative equipment or taking other actions in preparation for, or in reaction to, events that damage the hyperscaler services we use.
Hyperscalers have the right to terminate our agreements with them upon material uncured breach following prior written notice. If any of our hyperscaler service agreements are terminated, or there is a lapse of service, we would experience interruptions in access to our platform as well as significant delays and additional expense in arranging new facilities and services and/or re-architecting our solutions for deployment on a different cloud infrastructure, which would adversely affect our business, operating results, and financial condition.
Real or perceived errors, failures, defects, or vulnerabilities in our solutions could adversely affect our financial results and growth prospects.
Our solutions and underlying platform are complex, and in the past, we or our customers have discovered software errors, failures, defects, and vulnerabilities in our solutions after they have been released, including after new versions or updates are released. Our solutions and our platform are frequently deployed and used in large-scale computing environments with different operating systems, system management software and equipment and networking configurations, which have in the past, and may in the future, cause errors in, or failures of, our solutions or other aspects of the computing environment into which they are deployed. In addition, deployment of our solutions into complicated, large-scale computing environments have in the past exposed, and may, in the future, expose undetected errors, failures, defects, or vulnerabilities in our solutions. AI may not work as we had anticipated or it may produce unexpected results or outcomes. Despite testing by us, errors, failures, defects, or vulnerabilities may not be found in our solutions until they are released to our customers or thereafter. Real or perceived errors, failures, defects, or vulnerabilities in our solutions (in particular, any failure of our application security offering to perform as warranted) could result in, among other things, negative publicity and damage to our reputation, lower renewal rates, loss of or delay in market acceptance of our solutions, loss of competitive position, or claims by customers for losses sustained by them or expose us to breach of contract claims, regulatory fines, and related liabilities. If vulnerabilities in our solutions are exploited by adversaries, our customers could experience damages or losses for which our customers seek to hold us accountable. In the case of real or perceived errors, failures, defects, or vulnerabilities in our solutions giving rise to claims by customers, we may be required, or may choose, for regulatory, contractual, customer relations, or other reasons, to expend additional resources in order to help correct the problem.
Assertions by third parties of infringement or other violations by us of their IP rights, or other lawsuits brought against us, could result in significant costs and substantially harm our business, operating results, and financial condition.
Patent and other IP disputes are common in the markets in which we compete. Some companies in the markets in which we compete, including some of our competitors, own large numbers of patents, copyrights, trademarks, and trade secrets, which they may use to assert claims of infringement, misappropriation, or other violations of IP rights against us, our partners, our technology partners, or our customers. As the number of patents and competitors in our market increase, allegations of infringement, misappropriation, and other violations of IP rights may also increase. Our broad solution portfolio and the competition in our markets further exacerbate the risk of additional third-party IP claims against us in the future. Any allegation of infringement, misappropriation, or other violation of IP rights by a third party, even those without merit, could cause us to incur substantial costs and resources defending against the claim, could distract our management from our business, and could cause uncertainty among our customers or prospective customers, all of which could have an adverse effect on our business, operating results, and financial condition. We cannot assure you that we are not infringing or otherwise violating any third-party IP rights.
Furthermore, third parties that bring allegations against us may have the capability to dedicate substantially greater resources to enforce their IP rights and to defend against similar allegations that may be brought against them than we do. We have received, and may in the future receive, notices alleging that we have misappropriated, misused, or infringed other parties’ IP rights, including allegations made by our competitors, and, to the extent we gain greater market visibility, we face a higher risk of being the subject of IP infringement assertions. There also is a market for acquiring third-party IP rights and a competitor, or other entity, could acquire third-party IP rights and pursue similar assertions based on the acquired IP. They may also make such assertions against our customers or partners.
23
An adverse outcome of a dispute may require us to take several adverse steps such as pay substantial damages, including potentially treble damages, if we are found to have willfully infringed a third party’s patents or copyrights; cease making, using, selling, licensing, importing, or otherwise commercializing solutions that are alleged to infringe or misappropriate the IP of others; expend additional development resources to attempt to redesign our solutions or otherwise to develop non-infringing technology, which may not be successful; enter into potentially unfavorable royalty or license agreements in order to obtain the right to use necessary technologies or IP rights or have royalty obligations imposed by a court; or indemnify our customers, partners, and other third parties. Any damages or royalty obligations we may become subject to, or any prohibition against our commercializing our solutions as a result of an adverse outcome could harm our business and operating results.
Additionally, our agreements with customers and partners include indemnification provisions, under which we agree to indemnify them for losses suffered or incurred as a result of allegations of IP infringement and, in some cases, for damages caused by us to property or persons or other third-party allegations. Furthermore, we have agreed in certain instances to defend our partners against third-party claims asserting infringement of certain IP rights, which may include patents, copyrights, trademarks, or trade secrets, and to pay judgments entered on such assertions. Large indemnity payments could harm our business, operating results, and financial condition.
Failure to protect and enforce our proprietary technology and IP rights could substantially harm our business, operating results, and financial condition.
The success of our business depends on our ability to protect and enforce our proprietary rights, including our patents, trademarks, copyrights, trade secrets, and other IP rights, throughout the world. We attempt to protect our IP under patent, trademark, copyright, and trade secret laws, and through a combination of confidentiality procedures, contractual provisions, internal policies and other methods, all of which offer only limited protection. However, the steps we take to protect our IP may be inadequate. We will not be able to protect our IP if we are unable to secure or enforce our rights or if we do not detect unauthorized use of our IP. Despite our precautions, it may be possible for unauthorized third parties to copy our technology and use information that we regard as proprietary to create products, offerings, and services that compete with ours. In the past, we have been made aware of public postings of portions of our source code. It is possible that released source code could reveal some of our trade secrets, create security risks, and impact our competitive advantage. Some license provisions protecting against unauthorized use, copying, transfer, reverse engineering, and disclosure of our technology may be unenforceable under the laws of certain jurisdictions and foreign countries. Further, the laws of some countries do not protect proprietary rights to the same extent as the laws of the United States, and in some countries, there may not be sufficient legal processes available to us, in a timely fashion or at all, to enable us to effectively protect our IP. In expanding our international activities, our exposure to unauthorized copying and use of our technology and proprietary information may increase. In addition, the use of other companies’ generative AI tools by our employees or contractors in a manner that violates our internal policies may compromise some of our proprietary or IP rights.
The process of obtaining patent protection is expensive and time consuming, and we may not be able to successfully prosecute patent applications at a reasonable cost or in a timely manner. We may choose not to seek patent protection for certain innovations and may choose not to pursue patent protection in certain jurisdictions. Furthermore, it is possible that our patent applications may not result in issued patents, that the scope of the claims in our issued patents will be insufficient or not have the coverage originally sought, that our issued patents will not provide us with any competitive advantages, or that our issued patents and other IP rights may be challenged by others or invalidated through administrative process or litigation. In addition, issuance of a patent does not guarantee that we have an absolute right to practice our patented technology, or that we have the right to exclude others from practicing our patented technology. As a result, we may not be able to obtain adequate patent protection or to enforce our issued patents effectively.
In addition to patented technology, we rely on our unpatented proprietary technology and trade secrets. Despite our efforts to protect our proprietary technology and trade secrets, unauthorized parties may attempt to misappropriate, reverse engineer, or otherwise obtain and use them. The contractual provisions that we enter into with employees, consultants, partners, vendors, and customers may not prevent unauthorized use or disclosure of our proprietary technology or trade secrets and may not provide an adequate remedy in the event of unauthorized use or disclosure of our proprietary technology or trade secrets.
Moreover, policing unauthorized use of our technologies, solutions and IP is difficult, expensive, and time-consuming, particularly in foreign countries where the laws may not be as protective of IP rights as those in the United States and where mechanisms for enforcement of IP rights may be weak. We may be unable to determine the extent of any unauthorized use or infringement of our solutions, technologies, or IP rights.
From time to time, legal action by us may be necessary to enforce our patents and other IP rights, to protect our trade secrets, to determine the validity and scope of the IP rights of others, or to defend against allegations of infringement or invalidity. Such litigation could result in substantial costs and diversion of resources and could negatively affect our business, operating results, financial condition, and cash flows. If we are unable to protect our IP rights, our business, operating results and financial condition will be harmed.
24
Our use of open source technology could impose limitations on our ability to commercialize our solutions and platform.
We use open source software in our solutions and platform and expect to continue to use open source software in the future. Although we monitor our use of open source software to avoid subjecting our solutions and platform to conditions we do not intend, we may face allegations from others alleging ownership of, or seeking to enforce the terms of, an open source license, including by demanding release of the open source software, derivative works, or our proprietary source code that was developed using such software. These allegations could also result in litigation. The terms of many open source licenses have not been interpreted by U.S. courts. As a result, there is a risk that these licenses could be construed in a way that could impose unanticipated conditions or restrictions on our ability to commercialize our solutions. In such an event, we could be required to seek licenses from third parties to continue offering our solutions, to make our proprietary code generally available in source code form, to re-engineer our solutions, or to discontinue the sale of our solutions if re-engineering could not be accomplished on a timely basis, any of which could adversely affect our business, operating results, and financial condition.
Our participation in open source initiatives may limit our ability to enforce our IP rights in certain circumstances.
As part of our strategy to broaden our target markets and accelerate adoption of our offerings, we contribute software program code to certain open source projects managed by organizations such as Microsoft, Google, and Cloud Native Computing Foundation. We also undertake our own open source initiatives to promote “open innovation” and “enterprise openness,” meaning that we make technologies available under open source licenses with the goal of exchanging insights and experience with other experts in the community, broadening the adoption of our platform by our customers, and providing our partners with the ability to leverage their own technologies through the Dynatrace platform. In some cases, we accept contributions of code from the community, our customers, and partners.
When we contribute to a third-party managed open source project, the copyrights, patent rights, and other proprietary rights in and to the technologies, including software program code, owned by us that we contribute to these projects are often licensed to the project managers and to all other contributing parties without material restriction on further use or distribution. If and to the extent that any of the technologies that we contribute, either alone or in combination with the technologies that may be contributed by others, practice any inventions that are claimed under our patents or patent applications, then we may be unable to enforce those claims or prevent others from practicing those inventions, regardless of whether such other persons also contributed to the open source project (even if we were to conclude that their use infringes our patents with competing offerings), unless any such third party asserts its patent rights against us. This limitation on our ability to assert our patent rights against others could harm our business and ability to compete. In addition, if we were to attempt to enforce our patent rights, we could suffer reputational injury among our customers and the open source community.
Any actual or perceived failure by us to comply with stringent and evolving privacy laws or regulatory requirements in one or multiple jurisdictions, privacy, and information security policies and/or contractual obligations could result in proceedings, actions, or penalties against us.
We are subject to U.S. federal, state, and international laws, regulations, and standards relating to the collection, use, disclosure, retention, security, transfer, and other processing of personal data. The legal and regulatory frameworks for privacy, data protection and security issues worldwide are rapidly evolving and as a result, implementation standards, potential fines, enforcement practices, and litigation risks are likely to remain uncertain for the foreseeable future.
•In the United States, state legislatures continue to propose and pass comprehensive privacy legislation, including data breach notification laws, personal data privacy laws, and consumer protection laws. For example, the California Consumer Privacy Act (“CCPA”), as amended by the California Privacy Rights Act, gives California residents rights to access and delete their personal information, opt out of certain personal information sharing, and receive detailed information about how their personal information is used. The CCPA also provides for civil penalties for violations, as well as a private right of action for data breaches that is expected to increase data breach litigation. The CCPA has prompted a number of proposals for new federal and state-level privacy legislation, and in some states, efforts to pass comprehensive privacy laws have been successful. To date, numerous other states have enacted laws that impose privacy obligations that are similar to the CCPA and we also anticipate that more states will pass similar legislation. The existence of comprehensive privacy laws in different states in the country will add additional complexity, variation in requirements, restrictions, and potential legal risk, require additional investment of resources in compliance programs, impact strategies and the availability of previously useful data, and has resulted in and will result in increased compliance costs and/or changes in business practices and policies.
•Outside of the United States, virtually every jurisdiction in which we operate has established its own privacy, data protection and/or data security legal framework with which we or our customers must comply, including, but not limited to, the European Union (“EU”).
25
◦In the EU, data protection laws are stringent and continue to evolve, resulting in possible significant operational costs for internal compliance and risk to our business. The EU has adopted the GDPR, which imposes robust obligations upon covered companies, including heightened notice and consent requirements, greater rights of data subjects (e.g., the “right to be forgotten”), increased accountability measures, additional data breach notification and data security requirements, requirements for engaging third-party processors, and increased fines for non-compliance. Serious breaches of the GDPR (and similar data protection regulations in the United Kingdom) may result in monetary penalties of up to €20 million (or £17.5 million in the UK) or 4% of worldwide annual revenue, whichever is greater, for violations. In addition to the GDPR, other European legislative proposals and current laws and regulations apply to cookies and similar tracking technologies, electronic communications, and marketing, with an increased focus on online behavioral advertising.
◦Many jurisdictions outside of Europe where we do business directly or through resellers today and may seek to expand our business in the future, are also considering or have enacted comprehensive data protection legislation, cybersecurity legislation, or both. These include Australia, Brazil, China, Japan, Mexico, Saudi Arabia, Singapore, and United Arab Emirates.
•We are subject to various data transfer rules related to our ability to transfer data from one country to another. This may limit our ability to transfer certain data or require us to guarantee a certain level of protection when transferring data from one country to another.
•We are also subject to data localization laws in certain countries that may, for example, require personal information of citizens to be collected, stored, and modified only within that country. These and similar regulations may interfere with our intended business activities, inhibit our ability to expand into those markets, require modifications to our offerings or services, or prohibit us from continuing to offer services in those markets without significant additional costs.
•Current or future laws, regulations, and ethical considerations related to the use of AI technology may impact our ability to provide insights from data and use certain data to develop our offerings. Our company has significant experience with AI and we have incorporated it within our offerings for several years. While we focus on using AI in a responsible, ethical, and legal manner, our use of AI and the impact of laws, regulations, and ethical considerations for AI generally, and as they apply to our customers, may also require us to develop new or different systems and processes to test for accuracy, bias, and other variables and could increase our burden and cost of research and development in this area. The use of certain AI technology can give rise to IP risks, including compromises to proprietary IP and IP infringement. Additionally, we expect to see increasing government and supranational regulation related to AI use and ethics, which may also significantly increase the burden and cost of research, development and compliance in this area. The rapid evolution of AI will require the application of significant resources to design, develop, test and maintain our products and services to help ensure that AI is implemented in accordance with applicable law and regulation and in a socially responsible manner and to minimize any real or perceived unintended harmful impacts. Our vendors may in turn incorporate AI tools into their own offerings, and the providers of these AI tools may not meet existing or rapidly evolving regulatory or industry standards, including with respect to privacy and data security. Further, bad actors around the world use increasingly sophisticated methods, including the use of AI, to engage in illegal activities involving the theft and misuse of personal information, confidential information and IP. These factors may also impose burdensome and costly requirements on our ability and our customers’ ability to utilize data in innovative ways. For example, the EU has adopted the AI Act and in the United States, new AI-related laws and rulemakings are underway or being proposed at the federal, state, and local levels. AI is evolving rapidly and if our use of AI and data were to draw controversy, it could harm our reputation and give rise to legal or regulatory action.
The regulatory framework both in the United States and internationally governing the collection, processing, storage, use and sharing of certain information, particularly financial and other personal information, is rapidly evolving and is likely to continue to be subject to uncertainty and varying interpretations. It is possible that these laws may be interpreted and applied in a manner that is inconsistent with laws in other jurisdictions or which our existing data management practices or the features of our services and platform capabilities. We therefore cannot yet fully determine the impact these or future laws, rules, regulations, and industry standards may have on our business or operations.
In addition to the laws and regulations to which we are subject regarding the collection, processing, storage, use, and sharing of certain information, our contracts with customers include specific obligations regarding the protection of confidentiality and the permitted uses of personally identifiable and other proprietary information. We also publicly post documentation regarding our practices concerning the collection, processing, use, and disclosure of data. Although we endeavor to comply with our published policies and documentation and the various laws and regulations that we are subject to, we may at times fail to do so or be alleged to have failed to do so. Any failure or perceived failure by us, or any third parties with which we do business, to comply with our posted privacy policies and product documentation or privacy laws or regulations, changing consumer expectations, evolving laws, rules, and regulations, industry standards, or contractual obligations to which we or such third parties are or may become subject, may result in actions or other claims against us by governmental entities or private actors, the expenditure of substantial costs, time and other
26
resources or the imposition of significant fines, penalties or other liabilities, which could, individually or in the aggregate, materially and adversely affect our business, financial condition, and results of operations. In addition, any such action, particularly to the extent we were found to be guilty of violations or otherwise liable for damages, would damage our reputation and adversely affect our business, financial condition, and results of operations.
Additionally, our customers may be subject to differing privacy laws, rules, and legislation, which may mean that they require us to be bound by varying contractual requirements applicable to certain other jurisdictions. Adherence to such contractual requirements may impact our collection, use, processing, storage, sharing, and disclosure of various types of information, including financial information and other personal information, and may mean we become bound by, or voluntarily comply with, self-regulatory or other industry standards relating to these matters that may further change as laws, rules, and regulations evolve. Complying with these requirements and changing our policies and practices may be onerous and costly, and we may not be able to respond quickly or effectively to regulatory, legislative, and other developments. These changes may in turn impair our ability to offer our existing or planned features, products, and services and/or increase our cost of doing business. As we expand our customer base, these requirements may vary from customer to customer, further increasing the cost of compliance and doing business.
Risks Related to Legal, Regulatory, Accounting, and Tax Matters
Tax matters, including changes in tax laws, rules, regulations, and treaties, could impact our effective tax rate and our results of operations.
We operate in over 35 countries around the world and, as a multinational corporation, we are subject to income and non-income taxes, including payroll, sales, use, value-added, net worth, property, and goods and services taxes, in both the United States and various non-U.S. jurisdictions.
Our effective tax rate has fluctuated in the past and is likely to fluctuate in the future. Our effective tax rate is affected by the allocation of revenues and expenses to different jurisdictions and the timing of recognizing revenues and expenses. In addition, in the ordinary course of our global business, there are many intercompany transactions and calculations where the ultimate tax determination is uncertain.
The amount of taxes that we pay is subject to our interpretation of applicable tax laws in the jurisdictions in which we file and changes to tax laws. Significant judgment is required in determining our worldwide provision for income taxes and other tax liabilities, and in determining the realizability of tax attributes such as foreign tax credits and domestic deferred tax assets. For example, during the year ended March 31, 2025, we completed an intra-entity asset transfer of the global economic rights of our IP to Switzerland which resulted in the recognition of a discrete tax benefit and related deferred tax asset of $320.9 million (as discussed in Note 9 to our consolidated financial statements and the “Management’s Discussion and Analysis” section included elsewhere in this Annual Report). From time to time, we are subject to regular tax audits, examinations, and reviews in the ordinary course of business. While we believe that our tax estimates, assumptions, and judgments are reasonable and we have complied with all applicable income tax laws, there can be no assurance that a governing tax authority will not have a different interpretation and require us to pay additional taxes. If any amounts that we ultimately pay to a tax authority differ materially from amounts that we previously recorded or if we experience any unanticipated tax consequences, it could negatively affect our financial results and operations for the period at issue and on an ongoing basis.
We do not collect sales and use, value added, and similar taxes in all jurisdictions in which we have sales, based on our belief that such taxes are not applicable in certain of those jurisdictions. Sales and use, value added, and similar tax laws and rates vary greatly by jurisdiction. Certain jurisdictions in which we do not collect such taxes may assert that such taxes are applicable, which could result in tax assessments, penalties, and interest, and we may be required to collect such taxes in the future. Such tax assessments, penalties, and interest or future requirements may adversely affect our results of operations.
Tax laws, rules, and regulations are constantly under review by persons involved in the legislative process and by tax authorities. Changes to tax laws (which may have retroactive application) could adversely affect us or holders of our common stock. For example, changes in tax laws, rules, regulations, treaties, rates, changing interpretation of existing laws or regulations, the impact of accounting for share-based compensation, the impact of accounting for business combinations, changes in our international organization, and changes in overall levels of income before tax, can increase our or our stockholders’ tax liability. In recent years, many changes have been made to applicable tax laws and changes are likely to continue to occur in the future.
The Organization for Economic Cooperation and Development reached agreement among various countries to implement a minimum 15% tax rate on certain multinational enterprises, commonly referred to as Pillar Two. Many countries continue to announce changes in their tax laws and regulations based on the Pillar Two proposals. For fiscal year 2025, we expect to meet the Transitional Country-by-Country (“CbCR”) Safe Harbor rules for most, if not all, the jurisdictions that have adopted the rules. Based on the guidance available thus far, we do not expect this legislation to have a material impact on our consolidated financial statements, but we will continue to evaluate it as additional guidance and clarification becomes available.
27
We are subject to a number of risks associated with global sales and operations.
Revenue from customers located outside of the United States represented 42% of our total revenue for the fiscal year ended March 31, 2025. As of March 31, 2025, approximately 68% of our employees were located outside of the United States. As a result, our global sales and operations are subject to a number of risks and additional costs, including the following:
•increased expenses associated with international sales and operations, including establishing and maintaining office space and equipment for our international operations;
•fluctuations in exchange rates between the U.S. dollar and other currencies in the markets where we do business, and other controls, regulations, and orders that might restrict our ability to repatriate cash;
•volatility, uncertainties, and recessionary pressures in the global economy or in the economies of the countries in which we operate;
•difficulties in penetrating new markets due to existing competition or local lack of recognition of the Dynatrace brand;
•risks associated with trade restrictions and additional legal requirements, including the exportation of our technology or source code that is required in many of the countries in which we operate;
•greater risk of unexpected changes in regulatory rules, regulations and practices, tariffs and tax laws and treaties;
•compliance with U.S. and foreign import and export control and economic sanctions laws and regulations, including the Export Administration Regulations administered by the U.S. Department of Commerce’s Bureau of Industry and Security and the executive orders and laws implemented by the U.S. Department of the Treasury’s Office of Foreign Asset Controls;
•compliance with anti-bribery laws, including the U.S. Foreign Corrupt Practices Act (“FCPA”) and the U.K. Anti-Bribery Act, and a heightened risk of unfair or corrupt business practices in certain geographies, and of improper or fraudulent sales arrangements that may impact financial results and result in restatements of, or irregularities in, financial statements;
•compliance with privacy, data protection, and data security laws of many countries and jurisdictions, including the EU’s GDPR and the CCPA;
•limited or uncertain protection of IP rights in some countries and the risks and costs associated with monitoring and enforcing IP rights abroad;
•greater difficulty in enforcing contracts and managing collections in certain jurisdictions, as well as longer collection periods;
•management communication and integration problems resulting from cultural and geographic dispersion;
•difficulties hiring local staff, differing employer/employee relationships, and the potential need for country-specific benefits, programs, and systems;
•social, economic, and political instability, epidemics and pandemics, terrorist attacks, wars, geopolitical conflicts, disputes and security concerns in general; and
•potentially adverse tax consequences.
These and other factors could harm our ability to generate future global revenue and, consequently, materially impact our business, results of operations, and financial condition.
Continued uncertainty in the U.S. and global economies, particularly Europe, along with uncertain geopolitical conditions, could negatively affect sales of our offerings and services and could harm our operating results.
As our business has grown, we have become increasingly subject to the risks arising from adverse changes in the domestic and global economies. Uncertainty in the macroeconomic environment and associated global economic conditions, as well as geopolitical disruption, have and may continue to result in extreme volatility in credit, equity, and foreign currency markets. These conditions, including changes in inflationary pressures, increased tariffs, rising interest rates, lower consumer confidence or uneven or lower spending, volatile capital markets, financial and credit market fluctuations, trade wars or trade conflicts, political turmoil, natural catastrophes, epidemics, warfare (including the ongoing conflicts in Ukraine, and in Israel and surrounding areas), and terrorist attacks on the United States or elsewhere, may also adversely affect the buying patterns of our customers and prospective customers, including the size of transactions and length of sales cycles, which would adversely affect our overall pipeline as well as our revenue growth expectations. For example, we have seen lengthening sales cycles, which may affect our future revenues and results of operations. In addition, increased economic uncertainty in the United States and abroad could lead to periods of economic slowdown or recession, continued inflation and higher interest rates, and the occurrence of such events, or public perception that any of these events may occur, could result in a general decrease in spending on technology or other business interruptions. We cannot predict the timing, strength, or duration of any economic slowdown, instability, or recovery, generally or within the technology industry. If macroeconomic or geopolitical conditions deteriorate or if the pace of recovery slows or is uneven, our overall results of operations could be adversely affected.
28
We continue to invest in our international operations. There are significant risks with overseas investments, and our growth prospects in these regions are uncertain. Increased volatility, further declines in the European credit, equity, and foreign currency markets or geopolitical disruptions (including ongoing conflicts in Ukraine, and in Israel and surrounding areas) could cause delays in or cancellations of orders or have other negative impacts on our business operations in Europe (where a significant amount of our research and development operations are concentrated) and other regions throughout the world. If tensions between the United States, members of NATO and other countries continue to escalate and create global security concerns, it may result in an increased adverse impact on regional and global economies and increase the likelihood of cyber-attacks. Increased tariff rates could adversely affect our customers’ and suppliers’ businesses and in turn impact our business, while the imposition of taxes that target U.S. service providers such as us could directly increase the prices that our customers pay and adversely affect our business. Deterioration of economic or geopolitical conditions in the countries in which we do business could also cause slower or impaired collections on accounts receivable. In addition, we could experience delays in the payment obligations of our worldwide reseller customers if they experience weakness in the end-user market, which would increase our credit risk exposure and harm our financial condition. In addition, changes or uncertainties in U.S. trade policies toward foreign countries could create unfavorable economic conditions that may adversely affect our operations and growth.
In 2022, we suspended all business in Russia and Belarus. Although we do not have material operations in Ukraine, Russia, or Belarus, geopolitical instability in the region, new sanctions, and enhanced export controls has and may continue to impact our ability to sell or export our platform in Ukraine, Russia, Belarus and surrounding countries. Similarly, our operations in Israel and the surrounding areas are not material to our business results, though geopolitical instability in the region may impact our ability to sell or export our platform there. While we do not believe the overall impact to be material to our business results, if these conflicts and the scope of sanctions expand further or persist for an extended period of time, our business could be harmed.
Because we recognize revenue from our SaaS subscriptions and term licenses over the subscription or license term, downturns or upturns in new sales and renewals may not be immediately reflected in our operating results and may be difficult to discern.
For customers who purchase a subscription to our Dynatrace platform, whether they purchase a SaaS subscription, or a term license, we generally recognize revenue ratably over the term of their subscription. Thus, substantially all of the revenue that we report in each quarter from the Dynatrace platform is derived from the recognition of revenue relating to contracts entered into during previous quarters. For the three months ended March 31, 2025, revenue recognized from deferred revenue at the beginning of the period was $351.9 million. Consequently, a decline in new or renewed customer contracts in any single quarter may have a small impact on our revenue for that quarter. However, such a decline will negatively affect our revenue in future quarters. Accordingly, the effect of significant downturns in sales and market acceptance of our solutions, and potential changes in our rate of renewals, may not be fully reflected in our results of operations until future periods. In addition, a significant majority of our costs are expensed as incurred, while revenue is recognized over the life of the agreement with our customer. As a result, increased growth in the number of our customers could continue to result in our recognition of more costs than revenue in the earlier periods of the terms of our agreements.
Our revenue recognition policy and other factors may distort our financial results in any given period and make them difficult to predict.
Under accounting standards update No. 2014-09 (Topic 606), Revenue from Contracts with Customers (“ASC 606”), we recognize revenue when our customer obtains control of goods or services in an amount that reflects the consideration that we expect to receive in exchange for those goods or services. Our subscription revenue consists of (i) SaaS agreements, (ii) term-based licenses for the Dynatrace platform which are recognized ratably over the contract term, and (iiii) maintenance and support agreements. A significant increase or decline in our subscription contracts in any one quarter may not be fully reflected in the results for that quarter, but will affect our revenue in future quarters.
Furthermore, the presentation of our financial results requires us to make estimates and assumptions that may affect revenue recognition. In some instances, we could reasonably use different estimates and assumptions, and changes in estimates are likely to occur from period to period. For a full discussion of these estimates and policies, see “Management’s Discussion and Analysis of Financial Condition and Results of Operations - Critical Accounting Policies and Estimates - Revenue Recognition” included in Part II, Item 7 of this Annual Report.
Given the foregoing factors, our actual results could differ significantly from our estimates, comparing our revenue and operating results on a period-to-period basis may not be meaningful, and our past results may not be indicative of our future performance.
29
Changes in existing financial accounting standards or practices may harm our operating results.
Changes in existing accounting rules or practices, new accounting pronouncements, or varying interpretations of current accounting pronouncements or practice could harm our operating results or result in changes to the manner in which we conduct our business. Further, such changes could potentially affect our reporting of transactions completed and reported before such changes are effective.
U.S. Generally Accepted Accounting Principles (“GAAP”) are subject to interpretation by the Financial Accounting Standards Board (“FASB”), the SEC, and various bodies formed to promulgate and interpret appropriate accounting principles. A change in these principles or a change in these interpretations could have a significant effect on our reported financial results and could affect the reporting of transactions completed before the announcement of a change.
We may face exposure to foreign currency exchange rate fluctuations.
We have transacted in foreign currencies and expect to transact in foreign currencies in the future. In addition, we maintain assets and liabilities that are denominated in currencies other than the functional operating currencies of our global entities. Accordingly, changes in the value of foreign currencies relative to the U.S. dollar will affect our revenue and operating results due to transactional and translational remeasurement that is reflected in our earnings. As a result of such foreign currency exchange rate fluctuations, which have been prevalent over recent periods, it could be more difficult to detect underlying trends in our business and results of operations. In addition, to the extent that fluctuations in currency exchange rates cause our results of operations to differ from our expectations or the expectations of our investors, the trading price of our common stock could be adversely affected. We do not currently maintain a program to hedge transactional exposures in foreign currencies. However, in the future, we may use derivative instruments, such as foreign currency forward and option contracts, to hedge certain exposures to fluctuations in foreign currency exchange rates. The use of such hedging activities may not offset any or more than a portion of the adverse financial effects of unfavorable movements in foreign exchange rates over the limited time the hedges are in place. Moreover, the use of hedging instruments may introduce additional risks if we are unable to structure effective hedges with such instruments.
Our sales to government entities are subject to a number of challenges and risks.
We sell our solutions to U.S. federal and state and foreign governmental agency customers, often through our distributors and resellers, and we may increase sales to government entities in the future. Sales to government entities are subject to a number of challenges and risks, including constraints on the budgetary process, including changes in the policies and priorities of the particular government, such as the newly formed Department of Government Efficiency (“DOGE”) to reform federal government processes and reduce government expenditures, continuing resolutions, adherence to government audit and certification requirements, debt ceiling disruptions, deficit-reduction legislation, and any shutdown or default of the particular government. Selling to government entities can be highly competitive, expensive and time consuming, often requiring significant upfront time and expense without any assurance that these efforts will generate a sale. Contracts and subcontracts with government agency customers are subject to procurement laws and regulations relating to the award, administration, and performance of those contracts. Government demand and payment for our solutions are affected by public sector budgetary cycles and funding authorizations, with funding reductions or delays adversely affecting public sector demand for our solutions. We may be subject to audit or investigations relating to our sales to government entities, and any violations could result in various civil and criminal penalties and administrative sanctions, including termination of contracts, refunds of fees received, forfeiture of profits, suspension of payments, fines, and suspension or debarment from future government business including business with governmental agencies across the country involved. Government entities, including DOGE, may have statutory, contractual, or other legal rights to terminate contracts with our distributors and resellers for convenience, non-appropriation, or due to a default. Any of these risks relating to our sales to governmental entities could adversely impact our future sales and operating results.
We may acquire other businesses, products, or technologies in the future which could require significant management attention, disrupt our business or result in operating difficulties, dilute stockholder value, and adversely affect our results of operations.
Our growth depends upon our ability to enhance our existing offerings and our ability to introduce new offerings on a timely basis. We intend to continue to address the need to develop new offerings and enhance existing offerings both through internal research and development, and also through the acquisition of other companies, product lines, technologies, and personnel. In the last two fiscal years, we have closed a small number of acquisitions. We expect to continue to consider and evaluate a wide array of potential acquisitions as part of our overall business strategy, including, but not limited to, acquisitions of certain businesses, technologies, services, products, and other assets and revenue streams. At any given time, we may be engaged in discussions or negotiations with respect to one or more acquisitions, any of which could, individually or in the aggregate, be material to our financial condition and results of operations. There can be no assurance that we will be successful in identifying, negotiating, and consummating favorable acquisition opportunities, and we may not be able to complete such acquisitions on favorable terms. If we do complete acquisitions, we may not ultimately strengthen our competitive position or achieve our goals, and any acquisitions we complete could be viewed negatively by our customers, securities analysts, and investors, and could be disruptive to our operations.
30
Acquisitions may involve additional significant challenges, uncertainties, and risks, including, but not limited to:
•challenges, difficulties, or increased costs associated with integrating new employees, systems, technologies, and business cultures;
•failure of the acquisition to advance our business strategy and failure to achieve the acquisition’s anticipated benefits or synergies;
•disruption of our ongoing operations, diversion of our management’s attention, and increased costs and expenses associated with pursuing acquisition opportunities;
•inadequate data security, cybersecurity, and operational and information technology compliance and resilience;
•failure to identify, or our underestimation of, commitments, liabilities, deficiencies, and other risks associated with acquired businesses or assets;
•inconsistency between the business models of our company and the acquired company, and potential exposure to new or increased regulatory oversight and uncertain or evolving legal, regulatory, and compliance requirements;
•the potential loss of key management, other employees, or customers of the acquired business;
•potential reputational risks that could arise from transactions with, or investments in, companies involved in new or developing businesses or markets, which may be subject to uncertain or evolving legal, regulatory, and compliance requirements;
•potential impairment of goodwill or other acquisition-related intangible assets; and
•the potential for acquisitions to result in dilutive issuances of our equity securities or significant additional debt.
The integration process for an acquired business may require significant time and resources, and we may not be able to manage the process successfully. We may not successfully evaluate or utilize the acquired technology or personnel, or accurately forecast the financial impact of an acquired business, including accounting charges. We may have to pay cash, incur debt, or issue equity securities to pay for any such acquisitions, each of which could adversely affect our financial condition or the value of our common stock. The sale of equity or issuance of debt to finance any such acquisitions could result in dilution to our stockholders. The incurrence of indebtedness would result in increased fixed obligations and could also include covenants or other restrictions that would impede our ability to manage our operations.
Acquisitions may also heighten many of the risks described in this “Risk Factors” section. Acquisitions are inherently risky, may not be successful, and may harm our business, results of operations, and financial condition.
Our business is subject to a wide range of laws and regulations and our failure to comply with those laws and regulations could harm our business, operating results, and financial condition.
Our business is subject to regulation by various U.S. federal, state, local, and foreign governmental agencies, including agencies responsible for monitoring and enforcing employment and labor laws, workplace safety, product safety, environmental laws, consumer protection laws, AI, privacy, cybersecurity and data protection laws, anti-bribery laws, trade controls, public procurement regulations and guidelines, federal securities laws, and tax laws and regulations. In certain foreign jurisdictions, these regulatory requirements may be more stringent than those in the United States. In addition, as we expand our business into new jurisdictions, as we serve customers in certain regulated industries, and as these laws and regulations are subject to change over time, we must continue to monitor and dedicate resources to ensure continued compliance. We also anticipate continued changes in the laws and regulations governing cybersecurity controls and processes, data governance, trade controls, and the use of AI. For example, the European Union’s Digital Operational Resilience Act (DORA), which aims to enhance digital resilience of financial entities against cyber threats and operational disruptions, became effective on January 17, 2025. Non-compliance with applicable regulations or requirements could subject us to litigation, investigations, sanctions, enforcement actions, disgorgement of profits, fines, damages, civil and criminal penalties, or injunctions. If any governmental sanctions are imposed, or if we do not prevail in any possible civil or criminal litigation, our business, operating results, and financial condition could be materially adversely affected. In addition, responding to any action will likely result in a significant diversion of management’s attention and resources and an increase in professional fees. Enforcement actions and sanctions could harm our business, operating results, and financial condition. Changes in cybersecurity, data governance, trade, and AI regulation, as well as geopolitical tensions, could increase our cost of doing business, for example, by requiring breach or vulnerability notifications or increased restrictions on trade, or requiring that data be retained, accessed, and viewed only within specific jurisdictional locations.
31
We are subject to governmental export, import, and sanctions controls that could impair our ability to compete in international markets and subject us to liability if we are not in compliance with applicable laws.
Our solutions are subject to export control and economic sanctions laws and regulations, including the U.S. Export Administration Regulations administered by the U.S. Commerce Department’s Bureau of Industry and Security and the economic and trade sanctions regulations administered by the U.S. Treasury Department’s Office of Foreign Assets Control. Exports, re-exports, and transfers of our software and services, and the transfer or release of our proprietary technology must be made in compliance with these laws and regulations. Obtaining the necessary authorizations, including any required license for a particular sale, may be time consuming, is not guaranteed and may result in the delay or loss of sales opportunities.
Various countries regulate the import of encryption technology. Changes in the encryption or other technology incorporated into our solutions or in applicable export or import laws and regulations may delay the introduction and sale of our solutions in international markets, prevent customers from deploying our solutions or, in some cases, prevent the export or import of our solutions to certain countries, regions, governments, or persons altogether.
Recently, due in part to the geopolitical landscape and national security concerns, some countries in which Dynatrace operates have increasingly restricted trade. Changes in sanctions, export, or import laws and regulations, in the enforcement or scope of existing laws and regulations, or in the countries, regions, governments, persons, or technologies targeted by such laws and regulations, could also result in decreased use of our solutions or in our ability to sell our solutions in certain countries.
Even though we take precautions to prevent our solutions from being provided to restricted countries or persons, our solutions could be provided to those targets by our resellers or customers despite such precautions, and our customers may choose to host their systems including the Dynatrace platform using a hosting vendor that is a restricted person. The decreased use of our solutions or limitation on our ability to export or sell our solutions could adversely affect our business, while violations of these export and import control and economic sanctions laws and regulations could have negative consequences for us and our personnel, including government investigations, administrative fines, civil and criminal penalties, denial of export privileges, suspension or debarment from government contracts for a time, incarceration, and reputational harm.
Due to the global nature of our business, we could be adversely affected by violations of anti-bribery, anti-money laundering and similar laws in other jurisdictions in which we operate.
We are subject to the FCPA, the U.K. Bribery Act and other anti-corruption and anti-money laundering laws in other jurisdictions. These laws generally prohibit companies, their employees, and their intermediaries from making or offering improper payments or other benefits to government officials and others in the private sector.
As we increase our sales and operations outside of the United States and increase our use of third parties, such as partners, resellers, agents and other intermediaries, our risks under these laws increases. Although we take steps to ensure compliance by adopting policies and conducting training, we cannot guarantee that our employees, partners, resellers, agents, or other intermediaries will not engage in prohibited conduct that could render us responsible under these laws. Non-compliance with these laws could subject us to investigations, sanctions, settlements, prosecution, other enforcement actions, disgorgement of profits, significant fines, damages, other civil and criminal penalties or injunctions, suspension and/or debarment from government contracts for a time, the loss of export privileges, reputational harm, adverse media coverage, and other collateral consequences. Any investigations, actions and/or sanctions could have a material negative impact on our business, financial condition, and results of operations.
Risks Related to Our Common Stock
The trading price of our common stock has been, and may continue to be, volatile and you could lose all or part of your investment.
Technology stocks have historically and recently experienced high levels of volatility. The trading price of our common stock has fluctuated substantially and will likely continue to be volatile, ranging from an intraday low of $17.05 to an intraday high of $80.13 between our initial public offering in 2019 through May 20, 2025. Factors that could cause fluctuations in the trading price of our common stock include the following:
•announcements of new products, offerings or technologies, commercial relationships, acquisitions, or other events by us or our competitors;
•changes in how customers perceive the benefits of our platform;
•shifts in the mix of billings and revenue attributable to SaaS subscriptions, licenses and services from quarter to quarter;
•departures of our Chief Executive Officer, Chief Financial Officer, other executive officers, senior management or other key personnel;
•price and volume fluctuations in the overall stock market from time to time;
32
•fluctuations in the trading volume of our shares or the size of our public float;
•sales of large blocks of our common stock;
•actual or anticipated changes or fluctuations in our operating results;
•whether our operating results meet the expectations of securities analysts or investors;
•changes in actual or future expectations of investors or securities analysts;
•litigation, data breaches, or security incidents involving us, our industry or both;
•regulatory developments in the United States, foreign countries or both, including changes to tariffs or trade agreements;
•general economic conditions and trends; and
•major catastrophic events in our domestic and foreign markets.
In addition, if the market for technology stocks or the stock market in general experiences a loss of investor confidence, the trading price of our common stock could decline for reasons unrelated to our business, operating results, or financial condition. The trading price of our common stock might also decline in reaction to events that affect other companies in our industry even if these events do not directly affect us. In the past, following periods of volatility in the trading price of a company’s securities, securities class action litigation has often been brought against that company.
If our internal controls over financial reporting or our disclosure controls and procedures are not effective, we may not be able to accurately report our financial results, prevent fraud or file our periodic reports in a timely manner, which may cause investors to lose confidence in our reported financial information and may lead to a decline in our stock price.
As a public company, we are required to maintain internal control over financial reporting and disclosure controls and procedures. Section 404 of the Sarbanes-Oxley Act requires that we evaluate and determine the effectiveness of our internal control over financial reporting and provide a management report on our internal control over financial reporting. Our testing, or the subsequent testing by our independent registered public accounting firm, may reveal deficiencies in our internal control over financial reporting that are deemed to be material weaknesses. If we are not able to comply with the requirements of Section 404 of the Sarbanes-Oxley Act in a timely manner, or if we or our accounting firm identify deficiencies in our internal control over financial reporting that are deemed to be material weaknesses, the market price of our stock would likely decline and we could be subject to lawsuits, sanctions, or investigations by regulatory authorities, including SEC enforcement actions, and we could be required to restate our financial results, any of which would require additional financial and management resources.
If material weaknesses in our internal control over financial reporting are discovered or occur in the future, our consolidated financial statements may contain material misstatements and we could be required to restate our financial results, which could materially and adversely affect our business, results of operations, and financial condition, restrict our ability to access the capital markets, require us to expend significant resources to correct the material weakness, subject us to fines, penalties or judgments, harm our reputation, or otherwise cause a decline in investor confidence.
Sales of substantial amounts of our common stock in the public markets, or the perception that such sales could occur, could reduce the market price of our common stock.
Sales of a substantial number of shares of our common stock in the public market, or the perception that such sales could occur, could adversely affect the market price of our common stock and may make it more difficult for our stockholders or us to sell our stock at a time and price deemed appropriate. For example, one of our historically largest shareholders, the Thoma Bravo Funds, sold approximately 53.4 million shares of our common stock during our fiscal 2024, and an additional approximately 6.5 million shares in the first quarter of our fiscal 2025, bringing their beneficial ownership below 5% of our common stock. Future substantial sales, or the perception that such sales may occur, could make it more difficult for our stockholders or us to sell shares of our common stock in the public market in the future.
Our issuance of additional capital stock in connection with financings, acquisitions, investments, our stock incentive plans, or otherwise will dilute all other stockholders.
We may issue additional capital stock in the future that will result in dilution to all other stockholders. We may also raise capital through equity financings in the future. As part of our business strategy, we may acquire or make investments in complementary companies, products, offerings or technologies and issue equity securities to pay for any such acquisition or investment. Any such issuances of additional capital stock may cause stockholders to experience significant dilution of their ownership interests and the per share value of our common stock to decline.
33
We cannot guarantee that our share repurchase program will be fully consummated or will enhance long-term stockholder value, and share repurchases could increase the volatility of the trading price of our common stock and diminish our cash reserves.
In May 2024, we announced a share repurchase program under which we are authorized to purchase up to $500.0 million of our common stock from time to time. As of March 31, 2025, a total of $327.4 million remained available for repurchase under the share repurchase program. Our share repurchase program does not have an expiration date and does not obligate us to repurchase any specific dollar amount or to acquire any specific number of shares on any particular timetable or at all. There can be no assurance that we will repurchase shares at favorable prices. Further, our share repurchases could affect the trading price of our common stock, increase its volatility, reduce our cash reserves, and may be suspended or terminated at any time, which may result in a lower market valuation of our common stock.
We do not intend to pay dividends on our common stock and, consequently, your ability to achieve a return on your investment will depend on appreciation in the price of our common stock.
We have never declared or paid any dividends on our common stock, and we do not anticipate paying any cash dividends in the foreseeable future. As a result, you may only receive a return on your investment in our common stock if the market price of our common stock increases. Any determination to pay dividends in the future will be at the discretion of our board of directors. Accordingly, investors must rely on sales of their common stock after price appreciation, which may never occur, as the only way to realize any future gains on their investments.
Our charter and bylaws contain anti-takeover provisions that could delay or discourage takeover attempts that stockholders may consider favorable.
Our charter and bylaws contain provisions that could delay or prevent a change in control of our company. These provisions could also make it difficult for stockholders to elect directors who are not nominated by the current members of our board of directors or take other corporate actions, including effecting changes in our management. These provisions include:
•a classified board of directors with three-year staggered terms, which could delay the ability of stockholders to change the membership of a majority of our board of directors;
•directors may only be removed for cause, and subject to the affirmative vote of the holders of 66 2/3% or more of our outstanding shares of capital stock then entitled to vote at a meeting of our stockholders called for that purpose;
•the ability of our board of directors to issue shares of preferred stock and to determine the price and other terms of those shares, including preferences and voting rights, without stockholder approval, which could be used to significantly dilute the ownership of a hostile acquirer;
•allowing only our board of directors to fill vacancies on our board of directors, which prevents stockholders from being able to fill vacancies on our board of directors;
•a prohibition on stockholder action by written consent, which forces stockholder action to be taken at an annual or special meeting of our stockholders;
•the requirement that a special meeting of stockholders may be called only by our board of directors, the chair of our board of directors, our Chief Executive Officer or our president (in the absence of a Chief Executive Officer), which could delay the ability of our stockholders to force consideration of a proposal or to take action, including the removal of directors;
•the requirement for the affirmative vote of holders of at least 66 2/3% of the voting power of all of the then outstanding shares of the voting stock, voting together as a single class, to amend the provisions of our charter relating to the management of our business (including our classified board structure) or certain provisions of our bylaws, which may inhibit the ability of an acquirer to effect such amendments to facilitate an unsolicited takeover attempt;
•the ability of our board of directors to amend the bylaws, which may allow our board of directors to take additional actions to prevent an unsolicited takeover and inhibit the ability of an acquirer to amend the bylaws to facilitate an unsolicited takeover attempt;
•advance notice procedures with which stockholders must comply to nominate candidates to our board of directors or to propose matters to be acted upon at a stockholders’ meeting, which may discourage or deter a potential acquirer from conducting a solicitation of proxies to elect the acquirer’s own slate of directors or otherwise attempting to obtain control of us; and
•a prohibition of cumulative voting in the election of our board of directors, which would otherwise allow less than a majority of stockholders to elect director candidates.
Our charter also contains a provision that provides us with protections similar to Section 203 of the Delaware General Corporation Law, and prevents us from engaging in a business combination, such as a merger, with an interested stockholder (i.e., a person or group who acquires at least 15% of our voting stock) for a period of three years from the date such person became an interested stockholder, unless (with certain exceptions) the business combination or the transaction in which the person became an interested
34
stockholder is approved in a prescribed manner.
We may issue preferred stock, the terms of which could adversely affect the voting power or value of our common stock.
Our charter authorizes us to issue, without the approval of our stockholders, one or more classes or series of preferred stock having such designations, preferences, limitations and relative rights, including preferences over our common stock respecting dividends and distributions, as our board of directors may determine. The terms of one or more classes or series of preferred stock could adversely impact the voting power or value of our common stock. For example, we might grant holders of preferred stock the right to elect some number of our directors in all events or on the happening of specified events or the right to veto specified transactions. Similarly, the repurchase or redemption rights or liquidation preferences we might assign to holders of preferred stock could affect the residual value of our common stock.
Our bylaws designate certain specified courts as the sole and exclusive forum for certain disputes between us and our stockholders, which could limit our stockholders’ ability to obtain a favorable judicial forum for disputes with us or our directors, officers, or employees.
Pursuant to our bylaws, unless we consent in writing to the selection of an alternative forum, the Court of Chancery of the State of Delaware will be the sole and exclusive forum for state law claims for (1) any derivative action or proceeding brought on our behalf; (2) any action asserting a claim of, or a claim based on, a breach of a fiduciary duty owed by any of our directors, officers, or other employees to us or our stockholders; (3) any action asserting a claim pursuant to any provision of the Delaware General Corporation Law, our certificate of incorporation or our bylaws; (4) any action to interpret, apply, enforce, or determine the validity of our certificate of incorporation or bylaws; or (5) any action asserting a claim governed by the internal affairs doctrine (collectively, the “Delaware Forum Provision”). The Delaware Forum Provision does not apply to any causes of action arising under the Securities Act of 1933, as amended (the “Securities Act”), or the Exchange Act. Our bylaws further provide that, unless we consent in writing to the selection of an alternative forum, the U.S. federal district courts will be the sole and exclusive forum for resolving any complaint asserting a cause of action arising under the Securities Act (the “Federal Forum Provision”). In addition, our bylaws provide that any person or entity purchasing or otherwise acquiring any interest in shares of our common stock is deemed to have notice of and consented to the foregoing provisions; provided, however, that stockholders cannot and will not be deemed to have waived our compliance with the federal securities laws and the rules and regulations thereunder.
The Delaware Forum Provision and the Federal Forum Provision may impose additional litigation costs on stockholders in pursuing the claims identified above. Additionally, the Delaware Forum Provision and the Federal Forum Provision in our bylaws may limit our stockholders’ ability to bring a claim in a judicial forum that it finds favorable for disputes with us or our directors, officers, or other employees, which may discourage the filing of lawsuits against us and our directors, officers, and employees, even though an action, if successful, might benefit our stockholders. In addition, while the Delaware Supreme Court and other state courts have upheld the validity of federal forum selection provisions purporting to require claims under the Securities Act be brought in federal court, there is uncertainty as to whether courts in other states will enforce our Federal Forum Provision. If the Federal Forum Provision is found to be unenforceable in an action, we may incur additional costs associated with resolving such an action. The Federal Forum Provision may also impose additional litigation costs on stockholders who assert that the provision is not enforceable or invalid. The Court of Chancery of the State of Delaware or the U.S. federal district courts may also reach different judgments or results than would other courts, including courts where a stockholder considering an action may be located or would otherwise choose to bring the action, and such judgments may be more or less favorable to us than our stockholders.
General Risk Factors
Catastrophic events could materially interrupt or disrupt our business and others with which we conduct business.
Catastrophic events, such as natural disasters (e.g., fire, flood, severe storm, earthquake and other weather events), pandemics (such as COVID-19), epidemics, or outbreaks of an infectious disease, could interrupt or disrupt our business and our customers, partners, and suppliers, including hyperscaler providers which host Dynatrace solutions on their cloud infrastructure. For a description of some of the risks related to interruption or disruption of our services, please see the risk above entitled, “Interruptions or disruptions with the delivery of our SaaS solutions, or third party cloud-based systems that we depend on in our operations, may adversely affect our business, operating results, and financial condition.”
The impact to our business from any catastrophic event depends on many different factors that cannot be accurately predicted, such as its duration and scope and the interruption, disruption, or instability caused by the event. Future catastrophic events could have severe impacts on our business and our customers’ and prospective customers’ businesses, for example, by adversely impacting their timing, ability, or willingness to spend on software platforms or purchase our offerings. Negative effects of catastrophic events on our customers or prospective customers could lead to pricing discounts or extended payment terms, reductions in the amount or duration of customers’ subscription contracts or term licenses, or increase customer attrition rates. Any of the foregoing, especially for a prolonged period, could adversely affect our productivity, employee morale, future sales, operating results, and overall financial
35
performance. Catastrophic events may also have the effect of heightening many of the other risks described in this “Risk Factors” section.
Climate change may have a long-term negative impact on our business.
The long-term effects of climate change on the global economy and the technology industry in particular are unclear. However, there are inherent climate-related risks such as natural disasters, infrastructure disruptions, and geopolitical instability that have the potential to disrupt and impact our business and the third parties with which we conduct business.
In addition, changes in U.S. federal and state legislation and regulation and the laws, rules, and regulations of other countries where we have operations related to climate change could result in increased capital expenditures to comply with these new requirements. Numerous treaties, laws, and regulations have been enacted or proposed in an effort to regulate climate change, including regulations aimed at limiting greenhouse gas emissions and the implementation of “green” building codes. These laws and regulations may result in increased operating costs across various levels of our supply chain, which could cause us to increase costs to satisfy service obligations to our customers. We may also incur costs associated with increased regulations or investor requirements for increased sustainability disclosures and reporting, including reporting requirements and standards or expectations regarding the environmental impacts of our business. The cost of compliance with, or failure to comply with, such laws, rules, and regulations could result in increased compliance costs, and any untimely or inaccurate disclosure could adversely affect our reputation, business, or financial performance.
ITEM 1B. UNRESOLVED STAFF COMMENTS
None.
ITEM 1C. CYBERSECURITY
We have dedicated substantial resources to prevent and manage cybersecurity risk. We have administrative, technical, and physical security measures in place, as well as policies and procedures to require third parties to whom we transfer data to implement and maintain appropriate security measures. We proactively employ multiple methods at different layers of our systems which are designed to defend against intrusions and attacks and protect our data. We also consider the threats and challenges that we and other companies face as cybersecurity attacks grow in frequency and complexity.
We have in the past been, and may in the future be, the target and victim of cybersecurity attacks. In general, security incidents have increased in sophistication and have become more prevalent across industries and may occur on our systems, or on the systems of third parties we use to host our solutions or SaaS solutions that we use in the operation of our business, or on those third party hosting platforms on which our customers’ host their systems. Although we have taken significant measures to detect, effectively remediate, and prevent phishing and other attacks and security threats, we cannot be certain that our efforts will be effective to prevent and remediate all attacks and security threats. To date, we do not believe we have experienced any cybersecurity incidents that have materially affected or are reasonably likely to materially affect our business strategy, results of operations, or financial condition. See the “Risk Factors” section of this Annual Report for more information on material cybersecurity risks that we face.
Risk Management and Strategy
We have an Information Security Office that is responsible for preventing, assessing, detecting, mitigating, and remediating cybersecurity risks. The Information Security Office, which is led by our Chief Information Security Officer (“CISO”), works cross-functionally with different business and corporate functions, as all Dynatrace employees are considered critical to our company’s security. Our Information Security Office also partners with external organizations to maintain and enhance our cybersecurity systems and processes. Our Board of Directors and two of its committees are also involved in the oversight of our cybersecurity risk management. We discuss our CISO and the Board in more detail in the “Governance” section below.
Risk assessment and management - Our corporate and product security professionals assist in managing cybersecurity systems and in preventing, detecting, assessing, and resolving cybersecurity incidents. We build cybersecurity principles into our product development and system design, we have internal and external penetration testers who test our product platform and corporate systems, and we have a bug bounty program that can incentivize external security researchers who help us identify and fix bugs and vulnerabilities before they are exploited. Our internal audit team and our company’s independent auditors periodically assess the effectiveness of certain of our cybersecurity-related controls. From time to time, we also engage external consultants and advisors to
36
perform independent security testing and assessments and to assist with aspects of our cybersecurity program. We also utilize automated technology that alerts our security team of unusual activity in our corporate systems, product platform, and public-facing systems as well as automated security vulnerability scanning for our code base. As part of our processes, we require applicable internal approvals for changes to security-critical aspects of our product platform and services.
Third-party risk management - We assess the cyber risk of potential third-party service vendors, partners, and other service providers. We evaluate third parties before onboarding and periodically afterwards or if we detect a significant change in their cyber risk rating. We also perform security assessments on third-party code libraries before internal use. We categorize third parties in tiers based on the services that they provide to our company, the information and data that they have access to, and our overall assessment of the significance and risk of their operations to Dynatrace. We focus more detailed reviews and more frequent assessments on third parties that are in our highest tier.
Incident response planning - We have an incident response plan that sets forth a structured process and approach for how we assess, respond to, recover from, and remediate cybersecurity incidents. Under the plan, our CISO, the Information Security Office, and any incident response team that may be formed, work with our legal team, our privacy office, and any other applicable internal teams and external resources to address and communicate about incidents to key stakeholders, including the Board and its Cybersecurity Committee. As part of our incident response processes, we maintain disaster recovery plans and we prepare for any required external disclosures or reporting related to cybersecurity incidents. We review and test our incident response plan from time to time through tabletop exercises and other scenario planning to enhance management and Board preparedness in the event of a potential cybersecurity incident and to identify areas of continuous improvement. We believe that our planning and related processes, reviews, and testing help minimize the potential impacts to our company from cybersecurity incidents and help us recover from them as quickly as possible.
Governance
Board oversight – Our Board of Directors, as a whole and through its committees, has responsibility for the oversight of our risk management. The Board is responsible to satisfy itself that the risk management processes designed and implemented by management are adequate and functioning as designed.
The Board’s Audit Committee oversees our ERM program, which includes cybersecurity risk management as a focus area. The full Board also receives periodic reports from management on the ERM program.
The Chairs of the Cybersecurity Committee and the Audit Committee periodically update the full Board on specific committee-level topics and discussions. This enables the Board and its committees to coordinate the risk oversight role, particularly with respect to risk interrelationships.
From time to time, the CISO and other members of our executive leadership team discuss cybersecurity-related matters with the full Board at its scheduled meetings. Outside of scheduled meetings, management also periodically notifies or updates the Cybersecurity Committee or the Board, as appropriate, regarding certain types of cybersecurity incidents and matters.
Management’s role – Management is responsible for assessing and managing our material cybersecurity risks, practices and policies on a day-to-day basis.
37
The Information Security Office is comprised of professionals who collectively have significant experience in a wide range of cybersecurity matters, including threat assessment and detection, incident response and secure software development, and risk management. The Information Security Office works with Dynatrace’s other business and corporate functions and keeps the CISO informed and updated regarding key cybersecurity-related matters in accordance with our internal reporting processes.
ITEM 2. PROPERTIES
Our corporate headquarters is currently located in Waltham, Massachusetts and consists of approximately 60,000 square feet. We have agreed to terminate this lease, and in July 2025, we plan to relocate our corporate headquarters to Boston, Massachusetts where our office will consist of approximately 25,000 square feet of space under a lease that expires in 2032. Our primary research and development facility is located in Linz, Austria and consists of approximately 93,000 square feet of space under a lease that expires in 2036. In 2026, we plan to expand our Linz campus by an additional 187,000 square feet of space. We also lease other facilities in the United States and internationally, the largest of which in the United States are in Denver, Colorado and Detroit, Michigan, and the largest of which internationally are in Vienna, Austria and Gdansk, Poland. We believe that our facilities are adequate to meet our needs for the immediate future and that we will be able to secure additional space to accommodate expansion of our operations.
ITEM 3. LEGAL PROCEEDINGS
We are, from time to time, party to legal proceedings and subject to claims in the ordinary course of business. Although the outcome of legal proceedings and claims cannot be predicted with certainty, we currently believe that the resolution of any such matters will not have a material adverse effect on our business, operating results, financial condition, or cash flows. Regardless of the outcome, legal proceedings and claims can have an adverse impact on us because of defense and settlement costs, diversion of management resources, and other factors.
ITEM 4. MINE SAFETY DISCLOSURES
Not applicable.
PART II - OTHER INFORMATION
ITEM 5. MARKET FOR REGISTRANT’S COMMON EQUITY, RELATED STOCKHOLDER MATTERS AND ISSUER PURCHASES OF EQUITY SECURITIES
Market Information for Common Stock
Our common stock has been listed on the New York Stock Exchange under the symbol “DT” since August 1, 2019. Prior to that date, there was no public trading market for our common stock.
Holders of Record
As of May 20, 2025, there were 27 stockholders of record of our common stock. We believe a substantially greater number of beneficial owners hold shares through brokers, banks or other nominees.
Dividend Policy
We have never declared or paid any cash dividend on our common stock. We do not expect to pay any dividends on our common stock in the foreseeable future. Any future determination to declare dividends will be made at the discretion of our board of directors, subject to applicable laws, and will depend on a number of factors, including our financial condition, results of operations, capital requirements, contractual restrictions, general business conditions and other factors that our board of directors may deem relevant. In addition, our Credit Facility places restrictions on the ability of our subsidiaries to pay cash dividends or make distributions to us.
Securities Authorized for Issuance under Equity Compensation Plans
Information required by Item 5 of Form 10-K regarding our Equity Compensation Plans is incorporated herein by reference to Item 12, “Security Ownership of Certain Beneficial Owners and Management and Related Stockholder Matters,” of this Annual Report.
38
Performance Graph
The following shall not be deemed “filed” for purposes of Section 18 of the Exchange Act or incorporated by reference into any of our other filings under the Exchange Act or the Securities Act.
The performance graph below compares the cumulative total stockholder return on our common stock with the cumulative total return on the S&P 500 Index and the S&P 500 Information Technology Index. The graph assumes $100 was invested at the market close on March 31, 2020 in our common stock. Data for the S&P 500 Index and the S&P 500 Information Technology Index assume reinvestment of dividends.
The comparisons in the graph below are based upon historical data and are not indicative of, nor intended to forecast, future performance of our common stock.
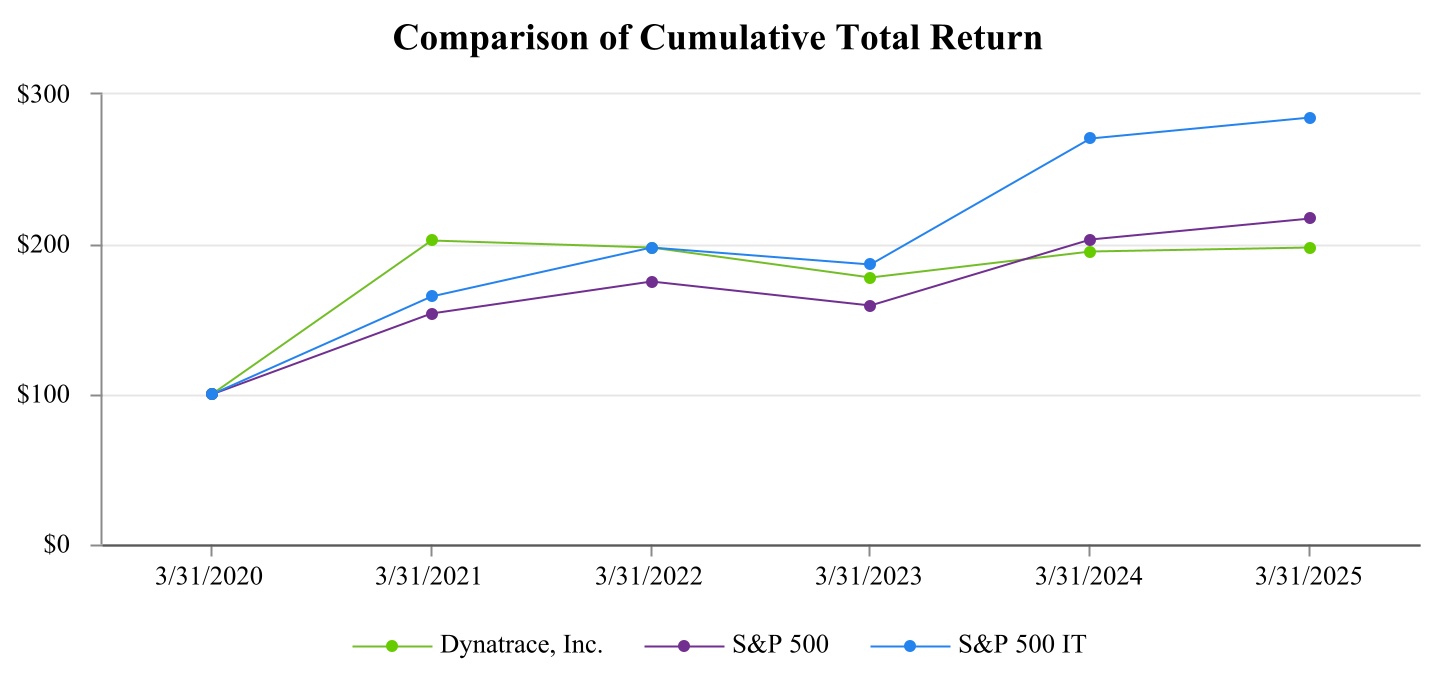
| Base Period | ||||||||||||||||||||||||||||||||
| 3/31/2020 | 3/31/2021 | 3/31/2022 | 3/31/2023 | 3/31/2024 | 3/31/2025 | |||||||||||||||||||||||||||
| Dynatrace, Inc. | $ | 100.00 | $ | 202.35 | $ | 197.57 | $ | 177.43 | $ | 194.80 | $ | 197.78 | ||||||||||||||||||||
| S&P 500 | $ | 100.00 | $ | 153.71 | $ | 175.29 | $ | 158.99 | $ | 203.30 | $ | 217.13 | ||||||||||||||||||||
| S&P 500 Information Technology | $ | 100.00 | $ | 164.81 | $ | 197.55 | $ | 186.58 | $ | 270.16 | $ | 284.23 | ||||||||||||||||||||
Unregistered Sales of Equity Securities
None.
Use of Proceeds
None.
39
Issuer Purchases of Equity Securities
Share repurchase activity during the three months ended March 31, 2025 was as follows (in thousands, except shares and per share data):
Period (1)
|
(a) Total Number of Shares Purchased |
(b) Average Price Paid per Share(2)
|
(c ) Total Number of Shares Purchased as Part of Publicly Announced Plan or Programs |
(d) Approximate Dollar Value of Shares that may Yet be Purchased Under Plans or Programs(3)
|
||||||||||||||||||||||
| January 1, 2025 - January 31, 2025 | 192,814 | $ | 53.63 | 192,814 | $ | 359,555 | ||||||||||||||||||||
| February 1, 2025 - February 28, 2025 | 224,301 | 60.14 | 224,301 | 346,061 | ||||||||||||||||||||||
| March 1, 2025 - March 31, 2025 | 370,150 | 50.44 | 370,150 | 327,382 | ||||||||||||||||||||||
| Total | 787,265 | $ | 53.99 | 787,265 | ||||||||||||||||||||||
(1) Information is based on trade dates of share repurchase transactions.
(2) Excludes commissions paid and any estimated excise taxes payable on share repurchases.
(3) On May 15, 2024, we announced a share repurchase program for up to $500 million of shares of our common stock. Our share repurchase program does not have a time limit.
For additional information, please see Note 14, Shareholders’ Equity, of the consolidated financial statements in this Annual Report.
ITEM 6. RESERVED
Not applicable.
40
ITEM 7. MANAGEMENT’S DISCUSSION AND ANALYSIS OF FINANCIAL CONDITION AND RESULTS OF OPERATIONS
The following discussion and analysis of our financial condition and results of operations should be read in conjunction with the consolidated financial statements and related notes appearing elsewhere in this Annual Report on Form 10-K. The following discussion and analysis contains forward-looking statements that involve risks and uncertainties. When reviewing the discussion below, you should keep in mind the substantial risks and uncertainties that could impact our business. In particular, we encourage you to review the risks and uncertainties described in the section titled “Risk Factors” under Part I, Item 1A in this Annual Report on Form 10-K. These risks and uncertainties could cause actual results to differ materially from those projected in forward-looking statements contained in this report or implied by past results and trends. Our fiscal year ends on March 31. Our historical results are not necessarily indicative of the results that may be expected for any period in the future.
Overview
Dynatrace is advancing observability for today’s digital businesses, helping to transform the complexity of modern digital ecosystems into powerful business assets. By leveraging AI-powered insights, Dynatrace enables organizations to analyze, automate, and innovate faster to drive their business forward. Our vision is a world where software works perfectly.
The Dynatrace platform combines broad and deep observability, continuous runtime application security, and advanced AI to support IT operations, development, security, business, and executive teams. This comprehensive approach enables organizations to optimize cloud and IT operations, accelerate secure software delivery, and improve digital performance.
Our customer base includes some of the largest global enterprises. These organizations rely on the Dynatrace platform as part of their plans to accelerate the adoption of cloud-native and AI-native initiatives and to address the related challenges of increasing workloads, dynamic environments, and evolving cybersecurity threats. Our ability to provide sophisticated analytics and our advanced automation capabilities support their operational goals in environments characterized by rapid technological changes. Cloud modernization and the dramatic growth in the use of AI have resulted in an explosion of data and a massive increase in its scale and complexity that are untenable for many organizations to manage as they previously did. As a result, we believe the need for comprehensive end-to-end observability, such as the Dynatrace platform, has become mandatory, especially for larger organizations building resiliency into ever more complex environments. We also believe our company has a significant market opportunity based on the technical differentiation of our platform, our ability to integrate successfully into customers’ cloud ecosystems, and the trust that we have built within our customer base and partner ecosystem.
We take Dynatrace to market through a combination of our global direct sales team and a network of partners, including GSIs, cloud providers, resellers and technology alliance partners. We target the largest 15,000 global enterprise accounts, which generally have annual revenues in excess of $1 billion, which we believe see more value from our integrated full-stack platform.
We generate revenue primarily by selling subscriptions, which we define as SaaS agreements, term-based licenses, and maintenance and support agreements. The majority of our customers deploy Dynatrace as a SaaS solution to get the latest Dynatrace features and updates with greatly reduced administrative effort. We also provide options to deploy our platform in customer-provisioned infrastructure.
The Dynatrace Platform Subscription (“DPS”) licensing model provides customers with a flexible, scalable, and transparent subscription for the modern cloud. Under the DPS licensing model, a customer makes a minimum annual spend commitment at the platform level and then consumes that commitment based on actual usage and a straightforward rate card. Any platform capability can be used in any quantity at any time based on the customer’s evolving needs.
The Dynatrace platform has been commercially available since 2016 and is the primary offering we sell.
41
Fiscal 2025 Financial Highlights
Our financial highlights for the year ended March 31, 2025 were:
•Our annual recurring revenue (“ARR”) was $1,734 million as of March 31, 2025, which reflected 15% growth year-over-year;
•Our total revenue was $1,699 million, which reflected 19% growth year-over-year;
•Our subscription revenue was $1,622 million, which reflected 19% growth year-over-year;
•We delivered GAAP income from operations of $179 million and non-GAAP income from operations(1) of $494 million; and
•Our net cash provided by operating activities and free cash flow(1) was $459 million and $431 million, respectively.
(1) Non-GAAP financial measure. For additional information, please see the “Key Metrics” section below for applicable definitions and the “Non-GAAP Financial Results” section below for a reconciliation to the most directly comparable GAAP financial measure.
We believe in a disciplined and balanced approach to operating our business. We plan to continue driving innovation to meet customers’ needs and grow our customer base. We also plan to invest in future growth opportunities that we expect will drive long-term value, while leveraging our global partner ecosystem, optimizing costs, and improving efficiency and profitability.
We believe this approach is even more important at this time as we navigate the current macroeconomic environment, which can include geopolitical considerations, fluctuations in credit, equity, and foreign currency markets, changes in inflation, interest rates, consumer confidence and spending, and other factors that may affect the buying patterns of our customers and prospective customers, including the size of transactions and length of sales cycles. In the ongoing dynamic macroeconomic landscape, we have seen resiliency in our industry and we remain confident in our ability to execute in this environment. Please see the section titled “Risk Factors” included under Part I, Item 1A for further discussion of the possible impact of macroeconomic conditions on our business and regarding fluctuations in our annual and quarterly operating results.
Key Factors Affecting Our Performance
Our historical financial performance has been, and we expect our financial performance in the future to be, driven by our ability to:
•Extend our technology and market leadership position. We intend to maintain our position as a leading AI-powered observability platform through increased investment in research and development, and innovation. We plan to expand the functionality of our end-to-end Dynatrace platform and invest in capabilities that address new market opportunities. For example, in fiscal 2026, we believe we are well positioned to grow our next generation log analytics offering, which integrates logs, traces, metrics, and other core observability and security data types into a single platform, providing customers with greater value than legacy log management solutions that are viewed as too expensive, providing too little value, or largely operating independently from existing monitoring tools. We also plan to evolve our AI capabilities to drive differentiation, with a focus on evolving into an agentic AI platform that can act autonomously to make decisions and take actions without human intervention. We believe this strategy will enable new growth opportunities and allow us to deliver differentiated high-value outcomes to our customers.
•Expand and strengthen our relationships with existing customers. We plan to establish new and deeper relationships within our existing customers’ organizations and expand the breadth of our platform capabilities to provide for expansion opportunities. In addition, we believe the ease of implementation of Dynatrace provides us with the opportunity to expand adoption within our existing enterprise customers, across new customer applications, with cloud-native and development teams, and into additional business units or divisions. We also believe that our DPS licensing model will drive broader consumption of the Dynatrace platform and further expansion opportunities for customers that prefer the flexibility and predictability of pricing under that model. Over 40% of our customer base and more than 60% of our ARR leveraged this flexible, scalable, and transparent subscription approach for the fiscal year ended March 31, 2025. With access to the full Dynatrace platform, DPS customers are able to adopt Dynatrace more broadly across their IT environments, which can lead to increased consumption.
•Grow our customer base. We intend to drive new customer growth through ongoing investments in our go-to-market strategy focused on customer segmentation, partner enablement, and continuing to expand our sales motion beyond application performance to include end-to-end observability, tool consolidation, and cloud modernization. We are focused on the largest 15,000 global enterprise accounts, which generally have annual revenues in excess of $1 billion and more complex IT ecosystems and cloud environments. At the start of our fiscal 2025, we increased the focus of our sales force on the largest 500 global companies and strategic enterprise accounts. In addition, we plan to expand our reach internationally to what we believe are large, mostly untapped, markets for our company, while leveraging our sector specialization globally.
42
•Leverage our strategic partner ecosystem. We intend to invest in our strategic partner ecosystem, with a particular emphasis on building cloud-focused, loyal and comprehensive partnerships with GSIs and hyperscaler cloud providers. These strategic partners continually work with their customers to help them digitally transform their businesses and reduce cloud complexity. By working more closely with strategic partners, our objective is to participate in digital transformation projects earlier in the purchasing cycle and enable customers to establish more resilient cloud deployments from the start.
Key Metrics
We monitor the following key metrics to help us measure and evaluate the effectiveness of our operations:
As of March 31, |
|||||||||||||||||
2025 |
2024 |
2023 |
|||||||||||||||
| (in thousands, except percentages) | |||||||||||||||||
| Total ARR | $ | 1,734,164 | $ | 1,503,819 | $ | 1,246,681 | |||||||||||
| Year-over-year increase | 15 | % | 21 | % | 25 | % | |||||||||||
Dollar-based net retention rate |
110 | % | 111 | % | 119 | % | |||||||||||
| Fiscal Years Ended March 31, | |||||||||||||||||
2025 |
2024 |
2023 |
|||||||||||||||
| (in thousands) | |||||||||||||||||
Non-GAAP income from operations(1)
|
$ | 493,540 | $ | 398,239 | $ | 291,791 | |||||||||||
Free cash flow(1)
|
430,617 | 346,382 | 333,345 | ||||||||||||||
(1) Non-GAAP financial measure. For additional information, please see the applicable definitions below and the “Non-GAAP Financial Results” section below for a reconciliation to the most directly comparable GAAP financial measure
ARR: We define ARR as the daily revenue of all subscription agreements that are actively generating revenue as of the last day of the reporting period multiplied by 365. We exclude from our calculation of ARR any revenues derived from month-to-month agreements and/or product usage overage billings.
Dollar-based net retention rate: We define the dollar-based net retention rate as the ARR at the end of a reporting period for the cohort of Dynatrace accounts as of one year prior to the date of calculation, divided by the ARR one year prior to the date of calculation for that same cohort. Our dollar-based net retention rate reflects customer renewals, expansion, contraction and churn. Dollar-based net retention rate is presented on a constant currency basis.
Non-GAAP income from operations: We define non-GAAP income from operations as GAAP income from operations adjusted for the following items: share-based compensation; employer payroll taxes on employee stock transactions; amortization of intangibles; transaction, restructuring and other non-recurring or unusual items that may arise from time to time.
Free cash flow: We define free cash flow as the net cash provided by or used in operating activities less capital expenditures, reflected as purchase of property and equipment and capitalized software additions in our financial statements.
Non-GAAP Financial Results
To supplement our consolidated financial statements, which are prepared and presented in accordance with GAAP, we provide investors with certain non-GAAP financial measures, including non-GAAP income from operations and free cash flow. We use these non-GAAP financial measures for financial and operational decision-making purposes and as a means to evaluate period-to-period comparisons and liquidity. We believe that these non-GAAP financial measures provide useful information about our operating results, enhance the overall understanding of past financial performance, and allow for greater transparency with respect to metrics used by our management in its financial and operational decision-making.
The presentation of the non-GAAP financial measures is not intended to be considered in isolation or as a substitute for, or superior to, the financial information prepared and presented in accordance with GAAP. Our non-GAAP financial measures may not provide information that is directly comparable to similarly titled metrics provided by other companies.
43
The tables below provide a reconciliation of our non-GAAP income from operations and free cash flow to their most directly comparable GAAP measure.
| Fiscal Years Ended March 31, | |||||||||||||||||
| 2025 | 2024 | 2023 | |||||||||||||||
| (in thousands) | |||||||||||||||||
| GAAP income from operations | $ | 179,433 | $ | 128,400 | $ | 92,811 | |||||||||||
| Share-based compensation | 271,703 | 208,896 | 146,874 | ||||||||||||||
| Employer payroll taxes on employee stock transactions | 15,444 | 13,988 | 6,191 | ||||||||||||||
| Amortization of intangibles | 26,802 | 38,558 | 41,856 | ||||||||||||||
| Transaction, restructuring, and other | 158 | 8,397 | 4,059 | ||||||||||||||
| Non-GAAP income from operations | $ | 493,540 | $ | 398,239 | $ | 291,791 | |||||||||||
| Fiscal Years Ended March 31, | |||||||||||||||||
| 2025 | 2024 | 2023 | |||||||||||||||
| (in thousands) | |||||||||||||||||
| Net cash provided by operating activities | $ | 459,419 | $ | 378,109 | $ | 354,885 | |||||||||||
| Purchase of property and equipment | (26,106) | (26,459) | (21,540) | ||||||||||||||
| Capitalized software additions | (2,696) | (5,268) | — | ||||||||||||||
| Free cash flow | $ | 430,617 | $ | 346,382 | 333,345 | ||||||||||||
Key Components of Results of Operations
Revenue
Revenue includes subscriptions and services.
Subscription. Our subscription revenue consists of (i) SaaS agreements, (ii) term-based licenses which are recognized ratably over the contract term, and (iii) maintenance and support agreements. We typically invoice SaaS subscription fees and term licenses annually in advance and recognize subscription revenue ratably over the term of the applicable agreement, provided that all other revenue recognition criteria have been satisfied. See the section titled “Critical Accounting Policies and Estimates-Revenue Recognition” for more information.
Service. Service revenue consists of revenue from helping our customers deploy our software in highly complex operational environments and training their personnel. We recognize the revenues associated with these professional services on a time and materials basis as we deliver the services or provide the training. We generally recognize the revenues associated with our services in the period the services are performed, provided that collection of the related receivable is reasonably assured.
Cost of Revenue
Cost of subscription. Cost of subscription revenue includes all direct costs to deliver and support our subscription products, including salaries, benefits, bonuses, share-based compensation and related expenses such as employer taxes, third-party hosting fees related to our cloud services, allocated overhead for depreciation, facilities, and IT, and amortization of internally developed capitalized software technology. We recognize these expenses as they are incurred.
Cost of service. Cost of service revenue includes salaries, benefits, bonuses, share-based compensation and related expenses such as employer taxes, and allocated overhead for depreciation, facilities, and IT. We recognize these expenses as they are incurred.
Amortization of acquired technology. Amortization of acquired technology includes amortization expense for technology acquired when our former controlling stockholder (the Thoma Bravo Funds) acquired our company in 2014 and from business combinations and asset acquisitions. During the year ended March 31, 2025, the acquired technology from the Thoma Bravo Funds’ acquisition of our company became fully amortized, therefore we expect amortization expense to decrease as compared to historical prices.
44
Gross Profit and Gross Margin
Gross profit is revenue less cost of revenue, and gross margin is gross profit as a percentage of revenue. Gross profit has been and will continue to be affected by various factors, including the mix of our subscription and service revenue, the costs associated with third-party cloud-based hosting services for our cloud-based subscriptions, and the extent to which we expand our customer support and services organizations. We expect that our gross margin will fluctuate from period to period depending on the interplay of these various factors.
Operating Expenses
Personnel costs, which consist of salaries, benefits, bonuses, share-based compensation and, with regard to sales and marketing expenses, sales commissions, are the most significant component of our operating expenses. We also incur other non-personnel costs, such as an allocation of our general overhead expenses, including depreciation, facilities, IT, and other costs.
Research and development. Research and development expenses primarily consist of the cost of programming personnel. We focus our research and development efforts on developing new solutions, core technologies, and to further enhance the functionality, reliability, performance and flexibility of existing solutions. We believe that our software development teams and our core technologies represent a significant competitive advantage for us and we expect that our research and development expenses will continue to increase in absolute dollars as we invest in research and development headcount to further strengthen and enhance our solutions.
Sales and marketing. Sales and marketing expenses primarily consist of personnel and facility-related costs for our sales, marketing, and business development personnel, commissions earned by our sales personnel, and the cost of marketing and business development programs. We expect that sales and marketing expenses will continue to increase in absolute dollars as we continue to hire additional sales and marketing personnel and invest in marketing programs.
General and administrative. General and administrative expenses primarily consist of the personnel and facility-related costs for our executive, finance, legal, human resources and administrative personnel, and other corporate expenses, including those associated with our ongoing public reporting obligations. We anticipate continuing to incur additional expenses as we continue to invest in the growth of our operations.
Amortization of other intangibles. Amortization of other intangibles primarily consists of amortization of customer relationships and tradenames acquired when our former controlling stockholder (the Thoma Bravo Funds) acquired our company in 2014 and from business combinations. During the year ended March 31, 2025, the customer relationships and tradenames acquired from the Thoma Bravo Funds' acquisition of our company became fully amortized, therefore we expect amortization expense to decrease as compared to historical periods.
Interest Income (Expense), Net
Interest income (expense), net, consists primarily of interest income from money market funds, bank deposits, debt securities held as investments, and certificates of deposits, partially offset by interest expense associated with fees on our Credit Facility (as defined later in this section) and amortization of debt issuance costs.
Other (Expense) Income, Net
Other (expense) income, net, consists primarily of foreign currency realized and unrealized gains and losses related to the impact of transactions denominated in a foreign currency, including balances between subsidiaries.
Income Tax Benefit (Expense)
Our income tax expense, deferred tax assets and liabilities, and liabilities for unrecognized tax benefits reflect management’s best assessment of estimated current and future taxes to be paid. We are subject to income taxes in both the United States and numerous foreign jurisdictions. Significant judgments and estimates are required in determining the consolidated income tax expense.
Our income tax rate varies from the U.S. federal statutory rate mainly due to (1) recognition of a deferred tax benefit for the IP Transfer (as defined below), (2) the foreign derived intangibles deduction, and (3) the generation of U.S. foreign tax credits, partially offset by (4) foreign withholding taxes and (5) nondeductible executive compensation. Except for the impact of recognizing the deferred tax benefit for the IP Transfer, we expect these items to continue to affect our income tax rate and income tax expense.
45
During the year ended March 31, 2025, we completed an intra-entity asset transfer of the global economic rights of our IP from a wholly-owned U.S. subsidiary to a wholly-owned Swiss subsidiary, more closely aligning our IP rights with our business operations (the “IP Transfer”). The transaction is taxable in the U.S. over a 20-year period. In Switzerland, the transaction resulted in a step-up of tax-deductible basis in the transferred assets, and accordingly, created a temporary difference where the tax basis exceeded the financial statement basis of such intangible assets, which resulted in the recognition of a tax benefit and related deferred tax asset of $320.9 million. We determined the estimated value of the transferred IP based principally on the present value of projected income related to the IP, requiring management to make significant assumptions related to the discount rate and the forecast of future revenues and expenses. The tax-deductible amortization related to the transferred IP rights will be recognized over 10 years. The deferred tax asset and tax benefit were measured based on the enacted tax rates expected to apply in the years the asset is expected to be realized. We expect to realize the deferred tax asset resulting from the IP Transfer.
Internal Revenue Code (“IRC”) Section 174
For tax years beginning on or after January 1, 2022, the Tax Cuts and Jobs Act of 2017 eliminated the option to currently deduct research and development expenses and requires taxpayers to capitalize and amortize them over five years for research activities performed in the United States and 15 years for research activities performed outside the United States pursuant to IRC Section 174. This law change has increased our U.S. federal and state cash taxes and reduced cash flows since fiscal year 2024.
Share-based compensation
The tax effects of the accounting for share-based compensation may significantly impact our effective tax rate from period to period. In periods in which our share price differs from the grant price of the share-based awards vesting or exercised in that period, we will recognize excess tax benefits or deficiencies that will impact our effective tax rate. The amount and value of share-based compensation issued relative to our earnings in a particular period will also affect the magnitude of the impact of share-based compensation on our effective tax rate. These tax effects are dependent on our share price, which we do not control, and a decline in our share price could significantly increase our effective tax rate and adversely affect our financial results.
Pillar Two proposal
Many countries have enacted or are in the process of enacting laws based on the Pillar Two proposal relating to a 15% global minimum tax issued by the Organization for Economic Cooperation and Development (“OECD”). For fiscal 2025, we do not expect these provisions to have a material impact on our consolidated financial statements based on the guidance available thus far. We will continue to monitor ongoing developments and evaluate any potential impact on future periods.
46
Results of Operations
The following tables set forth our results of operations for the periods presented. The period-to-period comparison of financial results is not necessarily indicative of financial results to be achieved in future periods.
| Fiscal Year Ended March 31, | |||||||||||||||||||||||||||||||||||
| 2025 | 2024 | 2023 | |||||||||||||||||||||||||||||||||
| Amount | Percent | Amount | Percent | Amount | Percent | ||||||||||||||||||||||||||||||
| (in thousands, except percentages) | |||||||||||||||||||||||||||||||||||
| Revenue: | |||||||||||||||||||||||||||||||||||
| Subscription | $ | 1,622,163 | 95 | % | $ | 1,359,354 | 95 | % | $ | 1,083,330 | 94 | % | |||||||||||||||||||||||
| Service | 76,520 | 5 | % | 71,176 | 5 | % | 75,200 | 6 | % | ||||||||||||||||||||||||||
Total revenue |
1,698,683 | 100 | % | 1,430,530 | 100 | % | 1,158,530 | 100 | % | ||||||||||||||||||||||||||
| Cost of revenue: | |||||||||||||||||||||||||||||||||||
| Cost of subscription | 233,299 | 14 | % | 184,765 | 13 | % | 144,445 | 12 | % | ||||||||||||||||||||||||||
| Cost of service | 73,631 | 4 | % | 65,423 | 5 | % | 62,882 | 6 | % | ||||||||||||||||||||||||||
Amortization of acquired technology |
13,262 | 1 | % | 16,265 | 1 | % | 15,564 | 1 | % | ||||||||||||||||||||||||||
Total cost of revenue (1)
|
320,192 | 19 | % | 266,453 | 19 | % | 222,891 | 19 | % | ||||||||||||||||||||||||||
Gross profit |
1,378,491 | 81 | % | 1,164,077 | 81 | % | 935,639 | 81 | % | ||||||||||||||||||||||||||
Operating expenses: |
|||||||||||||||||||||||||||||||||||
Research and development (1)
|
384,572 | 23 | % | 304,739 | 21 | % | 218,349 | 19 | % | ||||||||||||||||||||||||||
Sales and marketing (1)
|
605,599 | 36 | % | 534,233 | 37 | % | 448,015 | 39 | % | ||||||||||||||||||||||||||
General and administrative (1)
|
195,347 | 11 | % | 174,412 | 12 | % | 150,172 | 13 | % | ||||||||||||||||||||||||||
Amortization of other intangibles |
13,540 | 1 | % | 22,293 | 2 | % | 26,292 | 2 | % | ||||||||||||||||||||||||||
| Total operating expenses | 1,199,058 | 1,035,677 | 842,828 | ||||||||||||||||||||||||||||||||
| Income from operations | 179,433 | 11 | % | 128,400 | 9 | % | 92,811 | 8 | % | ||||||||||||||||||||||||||
| Interest income (expense), net | 48,281 | 37,284 | (3,409) | ||||||||||||||||||||||||||||||||
| Other (expense) income, net | (4,285) | (10,769) | 565 | ||||||||||||||||||||||||||||||||
| Income before income taxes | 223,429 | 154,915 | 89,967 | ||||||||||||||||||||||||||||||||
| Income tax benefit (expense) | 260,255 | (283) | 17,992 | ||||||||||||||||||||||||||||||||
| Net income | $ | 483,684 | $ | 154,632 | $ | 107,959 | |||||||||||||||||||||||||||||
_________________
(1)Includes share-based compensation expense as follows:
| Fiscal Year Ended March 31, | ||||||||||||||||||||||||||||||||||||||
| 2025 | 2024 | 2023 | ||||||||||||||||||||||||||||||||||||
| (in thousands) | ||||||||||||||||||||||||||||||||||||||
| Cost of revenue | $ | 36,924 | $ | 26,622 | $ | 18,383 | ||||||||||||||||||||||||||||||||
| Research and development | 100,866 | 69,543 | 41,406 | |||||||||||||||||||||||||||||||||||
| Sales and marketing | 77,336 | 65,762 | 51,147 | |||||||||||||||||||||||||||||||||||
| General and administrative | 56,577 | 46,969 | 35,938 | |||||||||||||||||||||||||||||||||||
| Total share-based compensation expense | $ | 271,703 | $ | 208,896 | $ | 146,874 | ||||||||||||||||||||||||||||||||
47
Fiscal Years Ended March 31, 2025 and 2024
Revenue
| Fiscal Year Ended March 31, | Change | ||||||||||||||||||||||
| 2025 | 2024 | Amount | Percent | ||||||||||||||||||||
| (in thousands, except percentages) | |||||||||||||||||||||||
| Subscription | $ | 1,622,163 | $ | 1,359,354 | $ | 262,809 | 19 | % | |||||||||||||||
| Service | 76,520 | 71,176 | 5,344 | 8 | % | ||||||||||||||||||
| Total revenue | $ | 1,698,683 | $ | 1,430,530 | $ | 268,153 | 19 | % | |||||||||||||||
Subscription
Subscription revenue increased by $262.8 million, or 19%, in fiscal 2025 compared to fiscal 2024, primarily due to the growing adoption of the Dynatrace platform by new customers combined with existing customers expanding their use of our solutions.
Service
Service revenue increased by $5.3 million, or 8%, in fiscal 2025 compared to fiscal 2024. The increase was primarily due to timing of delivery of services.
Cost of Revenue
| Fiscal Year Ended March 31, | Change | ||||||||||||||||||||||
| 2025 | 2024 | Amount | Percent | ||||||||||||||||||||
| (in thousands, except percentages) | |||||||||||||||||||||||
| Cost of subscription | $ | 233,299 | $ | 184,765 | $ | 48,534 | 26 | % | |||||||||||||||
| Cost of service | 73,631 | 65,423 | 8,208 | 13 | % | ||||||||||||||||||
| Amortization of acquired technology | 13,262 | 16,265 | (3,003) | (18 | %) | ||||||||||||||||||
| Total cost of revenue | $ | 320,192 | $ | 266,453 | $ | 53,739 | 20 | % | |||||||||||||||
Cost of subscription
Cost of subscription increased by $48.5 million, or 26%, in fiscal 2025 compared to fiscal 2024. The increase was primarily due to increased personnel costs of $23.2 million, inclusive of a $7.6 million increase in share-based compensation, largely due to headcount growth to support our growing customer base. Also contributing to the increase were increased cloud-based hosting costs of $21.7 million related to our growing cloud-based subscription revenue.
Cost of service
Cost of service increased by $8.2 million, or 13%, in fiscal 2025 compared to fiscal 2024. The increase was primarily due to increased personnel costs of $5.2 million, inclusive of a $2.7 million increase in share-based compensation.
Amortization of acquired technologies
Amortization of acquired technology decreased by $3.0 million, or 18%, in fiscal 2025 compared to fiscal 2024. The decrease was primarily the result of certain acquired technology becoming fully amortized during fiscal 2025.
48
Gross Profit and Gross Margin
| Fiscal Year Ended March 31, | Change | ||||||||||||||||||||||
| 2025 | 2024 | Amount | Percent | ||||||||||||||||||||
| (in thousands, except percentages) | |||||||||||||||||||||||
| Gross profit: | |||||||||||||||||||||||
| Subscription | $ | 1,388,864 | $ | 1,174,589 | $ | 214,275 | 18 | % | |||||||||||||||
| Service | 2,889 | 5,753 | (2,864) | (50 | %) | ||||||||||||||||||
| Amortization of acquired technology | (13,262) | (16,265) | 3,003 | (18 | %) | ||||||||||||||||||
| Total gross profit | $ | 1,378,491 | $ | 1,164,077 | $ | 214,414 | 18 | % | |||||||||||||||
| Gross margin: | |||||||||||||||||||||||
| Subscription | 86 | % | 86 | % | |||||||||||||||||||
| Service | 4 | % | 8 | % | |||||||||||||||||||
| Amortization of acquired technology | (100 | %) | (100 | %) | |||||||||||||||||||
| Total gross margin | 81 | % | 81 | % | |||||||||||||||||||
Subscription
Subscription gross profit increased by $214.3 million, or 18%, in fiscal 2025 compared to fiscal 2024 and subscription gross margin remained consistent at 86%. The increase in gross profit was primarily due to the growth of the Dynatrace platform.
Service
Service gross profit decreased by $2.9 million, or 50%, in fiscal 2025 compared to fiscal 2024. Service gross margin decreased to 4% in fiscal 2025 compared to 8% in fiscal 2024. The decrease in gross profit and gross margin was primarily due to increased personnel costs and share-based compensation expense.
Operating Expenses
| Fiscal Year Ended March 31, | Change | ||||||||||||||||||||||
| 2025 | 2024 | Amount | Percent | ||||||||||||||||||||
| (in thousands, except percentages) | |||||||||||||||||||||||
| Operating expenses: | |||||||||||||||||||||||
| Research and development | $ | 384,572 | $ | 304,739 | $ | 79,833 | 26 | % | |||||||||||||||
| Sales and marketing | 605,599 | 534,233 | 71,366 | 13 | % | ||||||||||||||||||
| General and administrative | 195,347 | 174,412 | 20,935 | 12 | % | ||||||||||||||||||
| Amortization of other intangibles | 13,540 | 22,293 | (8,753) | (39 | %) | ||||||||||||||||||
| Total operating expenses | $ | 1,199,058 | $ | 1,035,677 | $ | 163,381 | 16 | % | |||||||||||||||
Research and development
Research and development expenses increased $79.8 million, or 26%, in fiscal 2025 compared to fiscal 2024. The increase was primarily the result of increased personnel costs of $73.5 million, inclusive of a $31.3 million increase in share-based compensation, largely due to headcount growth to support the continued expansion of functionality and capabilities of the Dynatrace platform.
Sales and marketing
Sales and marketing expenses increased by $71.4 million, or 13%, in fiscal 2025 compared to fiscal 2024. The increase was primarily due to increased personnel costs of $52.5 million, inclusive of an $11.6 million increase in share-based compensation. Also contributing to the increase were marketing program, professional fees, and partner costs of $7.8 million and travel and entertainment expenses of $3.9 million.
General and administrative
General and administrative expenses increased by $20.9 million, or 12%, in fiscal 2025 compared to fiscal 2024. The increase was primarily the result of increased personnel costs of $23.3 million, inclusive of a $9.6 million increase in share-based compensation. Slightly offsetting the increase were lower acquisition-related costs of $8.0 million.
49
Amortization of other intangibles
Amortization of other intangibles decreased by $8.8 million, or 39%, in fiscal 2025 compared to the fiscal 2024. The decrease was primarily the result of certain intangible assets becoming fully amortized during fiscal 2025.
Interest Income, Net
Interest income, net, was $48.3 million in fiscal 2025 compared to $37.3 million in fiscal 2024. The increase in interest income was primarily the result of increased cash, cash equivalent, and investment balances.
Other Expense, Net
Other expense, net, was $4.3 million in fiscal 2025 compared to $10.8 million in fiscal 2024. The change was primarily the result of foreign currency realized and unrealized gains and losses related to the impact of transactions denominated in a foreign currency, including balances between subsidiaries.
Income Tax Benefit (Expense)
Income tax expense decreased by $260.5 million resulting in a benefit of $260.3 million in fiscal 2025 compared to an expense of $0.3 million in fiscal 2024. This decrease was primarily due to a $320.9 million tax benefit from the IP Transfer, partially offset by additional tax expense due to an increase in pre-tax income, decrease of share-based compensation windfall benefits and uncertain tax benefits that were recognized in fiscal 2024 due to the expiration of the statute of limitations in certain tax jurisdictions.
Fiscal Years Ended March 31, 2024 and 2023
Revenue
| Fiscal Year Ended March 31, | Change | ||||||||||||||||||||||
| 2024 | 2023 | Amount | Percent | ||||||||||||||||||||
| (in thousands, except percentages) | |||||||||||||||||||||||
| Subscription | $ | 1,359,354 | $ | 1,083,330 | $ | 276,024 | 25 | % | |||||||||||||||
| Service | 71,176 | 75,200 | (4,024) | (5 | %) | ||||||||||||||||||
| Total revenue | $ | 1,430,530 | $ | 1,158,530 | $ | 272,000 | 23 | % | |||||||||||||||
Subscription
Subscription revenue increased by $276.0 million, or 25%, in fiscal 2024 compared to fiscal 2023, primarily due to the growing adoption of the Dynatrace platform by new customers combined with existing customers expanding their use of our solutions. Changes in foreign currency exchange rates negatively impacted our revenue by $14.1 million.
Service
Service revenue decreased by $4.0 million, or 5%, in fiscal 2024 compared to fiscal 2023. The decrease was primarily due to timing of delivery of services.
Cost of Revenue
| Fiscal Year Ended March 31, | Change | ||||||||||||||||||||||
| 2024 | 2023 | Amount | Percent | ||||||||||||||||||||
| (in thousands, except percentages) | |||||||||||||||||||||||
| Cost of subscription | $ | 184,765 | $ | 144,445 | $ | 40,320 | 28 | % | |||||||||||||||
| Cost of service | 65,423 | 62,882 | 2,541 | 4 | % | ||||||||||||||||||
| Amortization of acquired technology | 16,265 | 15,564 | 701 | 5 | % | ||||||||||||||||||
| Total cost of revenue | $ | 266,453 | $ | 222,891 | $ | 43,562 | 20 | % | |||||||||||||||
Cost of subscription
Cost of subscription increased by $40.3 million, or 28%, in fiscal 2024 compared to fiscal 2023. The increase was primarily due to higher personnel costs of $15.5 million to support the growth of our subscription cloud-based and higher share-based compensation expense of $7.0 million. Also contributing to the increase were higher cloud-based hosting costs and subscriptions of $12.2 million to support the growth of the business and related infrastructure and higher depreciation expense of $3.1 million.
50
Cost of service
Cost of service increased by $2.5 million, or 4%, for the fiscal 2024 compared to the fiscal 2023. The increase was primarily the result of increased professional fees of $2.7 million and higher share-based compensation expense of $1.3 million. Slightly offsetting this increase were third-party professional services of $1.5 million.
Amortization of acquired technologies
In fiscal 2024 and 2023, amortization of acquired technologies was primarily related to amortization expense for technology acquired in connection with Thoma Bravo’s acquisition of our company in 2014.
Gross Profit and Gross Margin
| Fiscal Year Ended March 31, | Change | ||||||||||||||||||||||
| 2024 | 2023 | Amount | Percent | ||||||||||||||||||||
| (in thousands, except percentages) | |||||||||||||||||||||||
| Gross profit: | |||||||||||||||||||||||
| Subscription | $ | 1,174,589 | $ | 938,885 | $ | 235,704 | 25 | % | |||||||||||||||
| Service | 5,753 | 12,318 | (6,565) | (53 | %) | ||||||||||||||||||
| Amortization of acquired technology | (16,265) | (15,564) | (701) | 5 | % | ||||||||||||||||||
| Total gross profit | $ | 1,164,077 | $ | 935,639 | $ | 228,438 | 24 | % | |||||||||||||||
| Gross margin: | |||||||||||||||||||||||
| Subscription | 86 | % | 87 | % | |||||||||||||||||||
| Service | 8 | % | 16 | % | |||||||||||||||||||
| Amortization of acquired technology | (100) | % | (100 | %) | |||||||||||||||||||
| Total gross margin | 81 | % | 81 | % | |||||||||||||||||||
Subscription
Subscription gross profit increased by $235.7 million, or 25%, in fiscal 2024 compared to fiscal 2023. Subscription gross margin decreased from 87% to 86% of total gross margin in fiscal 2024 compared to fiscal 2023. The increase in gross profit was primarily due to the growth of the Dynatrace platform by new customers combined with existing customers expanding their use of our solutions.
Service
Service gross profit decreased by $6.6 million, or 53%, in fiscal 2024 compared to fiscal 2023. Service gross margin decreased from 16% to 8% of total gross margin in fiscal 2024 compared to fiscal 2023. The decrease in gross profit and gross margin was primarily due to the higher personnel and share-based compensation costs.
Operating Expenses
| Fiscal Year Ended March 31, | Change | ||||||||||||||||||||||
| 2024 | 2023 | Amount | Percent | ||||||||||||||||||||
| (in thousands, except percentages) | |||||||||||||||||||||||
| Operating expenses: | |||||||||||||||||||||||
| Research and development | $ | 304,739 | $ | 218,349 | $ | 86,390 | 40 | % | |||||||||||||||
| Sales and marketing | 534,233 | 448,015 | 86,218 | 19 | % | ||||||||||||||||||
| General and administrative | 174,412 | 150,172 | 24,240 | 16 | % | ||||||||||||||||||
| Amortization of other intangibles | 22,293 | 26,292 | (3,999) | (15 | %) | ||||||||||||||||||
| Total operating expenses | $ | 1,035,677 | $ | 842,828 | $ | 192,849 | 23 | % | |||||||||||||||
Research and development
Research and development expenses increased by $86.4 million, or 40%, in fiscal 2024 compared to fiscal 2023. The increase was primarily due to increased personnel and other costs to expand our product offerings of $51.8 million, and higher share-based compensation expense of $28.1 million. Also contributing to the increase were higher cloud-based hosting costs of $7.2 million.
51
Sales and marketing
Sales and marketing expenses increased by $86.2 million, or 19%, in fiscal 2024 compared to fiscal 2023, primarily driven by increased personnel costs of $50.4 million and higher share-based compensation expense of $14.6 million. Also contributing to the increase was higher commission expense of $14.4 million, and increased advertising costs of $8.8 million.
General and administrative
General and administrative expenses increased by $24.2 million, or 16%, in fiscal 2024 compared to fiscal 2023, primarily due to higher share-based compensation expense of $11.0 million. Also contributing to the increase were higher professional fees of $7.9 million and higher IT expenses of $6.3 million.
Amortization of other intangibles
Amortization of other intangibles decreased by $4.0 million, or 15%, in fiscal 2024 compared to fiscal 2023. The decrease was primarily the result of lower amortization for certain intangible assets that are amortized on a systematic basis that reflects the pattern in which the economic benefits of the intangible assets are estimated to be realized and the completion of amortization on certain intangibles.
Interest Income (Expense), Net
Interest income, net, was $37.3 million in fiscal 2024 compared to an expense of $3.4 million in fiscal 2023. The change was primarily the result of higher interest rates on our cash, cash equivalents, and investments coupled with lower interest expense due to the repayment of outstanding debt in fiscal year 2023.
Other (Expense) Income, Net
Other expense, net, increased by $11.3 million in fiscal 2024 compared to fiscal 2023. The change was primarily the result of foreign currency realized and unrealized gains and losses related to the impact of transactions denominated in a foreign currency, including balances between subsidiaries.
Income Tax (Expense) Benefit
Income tax benefit decreased by $18.3 million resulting in an expense of $0.3 million in fiscal 2024 compared to a benefit of $18.0 million in fiscal 2023. In fiscal 2024, a reversal of uncertain tax position resulted in a benefit of $14.8 million. In fiscal 2023, the net reduction of the valuation allowance recorded against global deferred tax assets results in a benefit of $32.6 million.
Liquidity and Capital Resources
We have historically maintained a disciplined and balanced approach to optimizing costs and improving the efficiency and profitability of our business, while continuing to invest in future growth opportunities that we expect will drive long-term value. Our principal sources of liquidity are cash and cash equivalents, marketable securities (investments) and cash provided by operating activities. From time to time, we may borrow under our Credit Facility. As of March 31, 2025, we had $1,017.0 million of cash and cash equivalents, $147.8 million of investments, primarily consisting of U.S. Treasury securities, corporate debt securities, commercial paper, and U.S. agency securities that have maturities between one and 30 months, and $399.2 million available under our Credit Facility.
We have historically financed our operations primarily through payments by our customers for use of our product offerings and related services and, to a lesser extent, the net proceeds we have received from sales of equity securities.
Over the past three years, cash flows from customer collections have increased. However, operating expenses have also increased as we have invested in growing our business. Our operating cash requirements may increase in the future as we continue to invest in the strategic growth of our company.
Our billings may vary over time due to a number of factors, including the mix of subscription and service revenue, the contract length of our customer agreements, and the timing of customer contracts, including renewals. Such variability in the timing and amounts of our billings could impact the timing of our cash collections from period to period.
Our material cash requirements from known contractual and other obligations consist of our rent payments required under operating lease agreements and non-cancelable purchase obligations entered into in the ordinary course of business, primarily for cloud hosting support. As of March 31, 2025, total contractual commitments were $782.8 million, with $126.5 million committed within the next 12 months. For further information regarding our contractual commitments, see Note 13, Commitments and Contingencies, of our audited consolidated financial statements included in this Annual Report.
52
Cash from operations could be affected by various risks and uncertainties, including, but not limited to, the risks detailed in the section titled “Risk Factors” included under Part I, Item 1A of this Annual Report. However, we believe that our existing cash, cash equivalents, investments, funds available under our revolving credit facility, and cash generated from operations, will be sufficient to meet our cash requirements for at least the next 12 months. Our future capital requirements will depend on many factors, including our growth rate, the timing and extent of spending to support research and development efforts, the continued expansion of sales and marketing activities, the introduction of new and enhanced products, seasonality of our billing activities, timing and extent of spending to support our growth strategy, and the continued market acceptance of our products. In the event that additional financing is required from outside sources, we may not be able to raise such financing on terms acceptable to us or at all. If we are unable to raise additional capital when desired, our business, operating results, and financial condition would be adversely affected.
Share Repurchase Program
We announced a share repurchase program for up to $500.0 million of common stock on May 15, 2024. For the year ended March 31, 2025, we repurchased and retired 3.4 million shares of our common stock for a total of $172.6 million. As of March 31, 2025, $327.4 million remained available for future repurchases. For additional information, please see Part II, Item 5 of this Annual Report.
Our Credit Facility
In December 2022, we entered into a senior secured revolving credit facility in an aggregate amount of $400.0 million (as amended to date, the “Credit Facility”). As of March 31, 2025, we had $399.2 million available under the Credit Facility with $0.8 million of letters of credit outstanding. As of March 31, 2025, we were in compliance with all applicable covenants pertaining to the Credit Facility. The Credit Facility is discussed further in Note 11, Long-term Debt, of our audited consolidated financial statements included in this Annual Report.
Summary of Cash Flows
| Fiscal Year Ended March 31, | ||||||||||||||||||||
| 2025 | 2024 | 2023 | ||||||||||||||||||
| (in thousands) | ||||||||||||||||||||
Net cash provided by operating activities(1)
|
$ | 459,419 | $ | 378,109 | $ | 354,885 | ||||||||||||||
| Net cash used in investing activities | (69,315) | (193,048) | (21,540) | |||||||||||||||||
| Net cash (used in) provided by financing activities | (151,630) | 50,663 | (232,344) | |||||||||||||||||
Effect of exchange rate changes on cash and cash equivalents |
(418) | (12,089) | (8,620) | |||||||||||||||||
| Net increase in cash and cash equivalents | $ | 238,056 | $ | 223,635 | $ | 92,381 | ||||||||||||||
_________________
(1) Net cash provided by operating activities includes cash payments for interest and tax as follows:
| Fiscal Year Ended March 31, | ||||||||||||||||||||
| 2025 | 2024 | 2023 | ||||||||||||||||||
| (in thousands) | ||||||||||||||||||||
| Cash paid for interest | $ | 753 | $ | 851 | $ | 7,109 | ||||||||||||||
| Cash paid for (received from) tax, net | $ | 117,979 | $ | 81,360 | $ | (14,311) | ||||||||||||||
Operating Activities
Net cash provided by operating activities was $459.4 million in fiscal 2025 compared to $378.1 million in fiscal 2024. The $81.3 million increase in net cash provided by operating activities was driven by increased net income, adjusted for non-cash charges, of $42.8 million, and favorable working capital changes of $38.5 million. The net increase in operating cash flow was primarily due to higher collections driven by revenue growth.
Net cash provided by operating activities was $378.1 million in fiscal 2024 compared to $354.9 million in fiscal 2023. The $23.2 million increase in net cash provided by operating activities was driven by increased net income, adjusted for non-cash charges, of $106.9 million, partially offset by unfavorable working capital changes of $83.7 million. The net increase in operating cash flow was primarily due to higher collections driven by revenue growth, but were partially offset by a significant income tax refund in fiscal 2023.
Investing Activities
Net cash used in investing activities was $69.3 million in fiscal 2025 compared to $193.0 million in fiscal 2024. The $123.7 million decrease in net cash used in investing activities was driven by a $63.8 million increase in proceeds from the sales and maturities of investments, net of purchases, and a $57.0 million decrease in cash paid for business combination acquisitions.
53
Net cash used in investing activities was $193.0 million in fiscal 2024 compared to $21.5 million in fiscal 2023. The $171.5 million increase in net cash used in investing activities was driven by a $104.2 million increase in purchases of investments and a $57.1 million increase in cash paid for business combination acquisitions.
Financing Activities
Net cash used in financing activities was $151.6 million in fiscal 2025 compared to $50.7 million of net cash provided by financing activities in fiscal 2024. The $202.3 million increase in net cash used in financing activities was driven by $172.6 million of repurchases of common stock pursuant to our share repurchase program, a $19.0 million increase in taxes paid related to net share settlement of equity award, and $10.2 million decrease in proceeds from the exercise of our stock options.
Net cash provided by financing activities was $50.7 million in fiscal 2024 compared to $232.3 million of net cash used in financing activities in fiscal 2023. The $283.0 million increase in net cash provided by financing activities was driven by a $281.1 million decrease in repayment of our term loans, because we terminated the First Lien Credit Agreement and repaid all outstanding borrowings in fiscal 2023.
Critical Accounting Policies and Estimates
We prepare our consolidated financial statements in accordance with GAAP. The preparation of consolidated financial statements also requires us to make estimates and assumptions that affect the reported amounts of assets, liabilities, revenues, costs and expenses and related disclosures. We base our estimates on historical experience and on various other assumptions that we believe to be reasonable under the circumstances. Actual results could differ significantly from our estimates. To the extent that there are differences between our estimates and actual results, our future financial statement presentation, financial condition, results of operations and cash flows will be affected.
We believe that the assumptions and estimates associated with revenue recognition, income taxes, and business combinations have the greatest potential impact on our consolidated financial statements. Therefore, we consider these to be our critical accounting policies and estimates. Accordingly, we believe these are the most critical to fully understand and evaluate our financial condition and results of operations.
Revenue Recognition
We recognize revenue from contracts with customers using the five-step method described in Note 2, Significant Accounting Policies, of our audited consolidated financial statements included in this Annual Report. At contract inception, we evaluate whether two or more contracts should be combined and accounted for as a single contract and whether the combined or single contract includes more than one performance obligation. We combine contracts entered into at or near the same time with the same customer if (i) we determine that the contracts are negotiated as a package with a single commercial objective, (ii) the amount of consideration to be paid in one contract depends on the price or performance of the other contract, or (iii) the services promised in the contracts are a single performance obligation.
The identification of our performance obligations involves review and consideration for the contractual terms, the implied rights of our customers, if any, product demonstrations and published website and marketing materials. Our performance obligations consist of (i) subscription and support services and (ii) professional and other services. Contracts that contain multiple performance obligations require an allocation of the transaction price to each performance obligation based on their relative standalone selling price (“SSP”). We determine SSP for all our performance obligations using observable inputs, such as standalone sales and historical contract pricing. SSP is consistent with our overall pricing objectives, taking into consideration the type of subscription services and professional and other services. SSP also reflects the amount we would charge for that performance obligation if it were sold separately in a standalone sale, and the price we would sell to similar customers in similar circumstances. We have determined that our pricing for software licenses and subscription services is highly variable and we therefore allocate the transaction price to those performance obligations using the residual approach.
In general, we satisfy the majority of our performance obligations over time as we transfer the promised services to our customers. We review the contract terms and conditions to evaluate (i) the timing and amount of revenue recognition, (ii) the related contract balances, and (iii) our remaining performance obligations. We also estimate the number of hours expected to be incurred based on an expected hours approach that considers historical hours incurred for similar projects based on the types and sizes of customers. These evaluations require significant judgment that could affect the timing and amount of revenue recognized.
Income Taxes
We account for income taxes under the asset and liability method, which requires the recognition of deferred tax assets and liabilities for the expected future tax consequences of events that have been included in the consolidated financial statements. Under this method, deferred tax assets and liabilities are determined based on the differences between the consolidated financial statements and
54
income tax bases of assets and liabilities and net operating loss and tax credit carryforwards using enacted tax rates in effect for the year in which the differences are expected to reverse. The effect of a change in tax rates on deferred tax assets and liabilities is recognized in the period that includes the enactment date. We assert that the earnings of certain foreign subsidiaries are indefinitely reinvested and therefore we do not recognize any deferred tax liabilities that arise from outside basis differences in those subsidiaries.
Deferred tax assets are reduced by a valuation allowance if it is more likely than not that some or all of the deferred taxes will not be realized. In making such determination, we consider all available positive and negative evidence, including future reversals of existing taxable temporary differences, projected future taxable income, tax planning strategies and recent financial operations.
We record uncertain tax positions on a two-step process in which (i) we determine whether it is more likely than not that the tax positions will be sustained on the basis of the technical merits of the position and (ii) for those tax positions that meet the more-likely-than-not recognition threshold, we recognize the largest amount of tax benefit that is more than 50% likely to be realized upon ultimate settlement with the related tax authority. We recognize interest and penalties related to unrecognized tax benefits on the income tax expense line the accompanying consolidated statement of operations. Accrued interest and penalties are included on the related tax liability line in the consolidated balance sheet.
During the year ended March 31, 2025, we completed the IP Transfer. For additional information, please see the “Key Components of Results of Operations” section. The assessment of the estimated value of the IP transferred is based on the U.S. transfer pricing regulations as described in section 482 of the IRC and the Treasury Department regulations promulgated thereunder, and the OECD Transfer Pricing guidelines. We determined the estimated value of the transferred IP based principally on the present value of projected income related to the IP, requiring management to make significant assumptions related to the discount rates and the forecast of future revenue and expenses. While we employ experts to assist in the determination of the estimated value of the IP, its value is based on significant management assumptions and estimates, which are inherently uncertain and highly subjective, and actual results may differ from estimates. If different assumptions were to be used, it could materially impact the IP valuation.
Business Combinations
We use our best estimates and assumptions to allocate the fair value of purchase price to the assets acquired and liabilities assumed. The excess of the fair value of purchase price over the fair values of the identifiable assets and liabilities is recorded as goodwill. We apply judgment in determining the fair value of the intangible assets acquired, which involves the use of estimates and assumptions with respect to future expected cash flows, expected asset lives, discount rates, revenue growth rates, and royalty rates. Management bases these estimates on historical experience and various other assumptions that we believe are reasonable. While we use our best estimates and judgments, our estimates are inherently uncertain and subject to refinement. During the measurement period, which may be up to one year from the acquisition date, we may record adjustments to the fair value of these tangible and intangible assets acquired and liabilities assumed, with the corresponding offset to goodwill.
Recent Accounting Pronouncements
For a description of recent accounting pronouncements, and the impact of these pronouncements on our consolidated financial statements, see Note 2, Significant Accounting Policies, of our audited consolidated financial statements included in this Annual Report.
ITEM 7A. QUANTITATIVE AND QUALITATIVE DISCLOSURES ABOUT MARKET RISK
We are exposed to market risk in the ordinary course of our business. Market risk represents the risk of loss that may impact our financial position due to adverse changes in financial market prices and rates. Our market risk exposure is primarily a result of fluctuations in foreign currency exchange rates and interest rates. We do not hold or issue financial instruments for trading purposes.
Foreign Currency Exchange Risk
Our international operations have provided and are expected to continue to provide a significant portion of our consolidated revenues and expenses that we report in U.S. dollars. We do not believe that an immediate 10% increase or decrease in the relative value of the U.S. dollar to other currencies would have a material effect on our results of operations or cash flows, and to date, we have not engaged in any hedging strategies with respect to foreign currency transactions. As our international operations grow, we will continue to reassess our approach to manage our risk relating to fluctuations in currency rates, and we may choose to engage in the hedging of foreign currency transactions in the future.
Translation exposure
Our reporting currency is the U.S. dollar, and the functional currency of each of our subsidiaries is either its local currency or the U.S. dollar, depending on the circumstances. As a result, our consolidated revenues and expenses are affected and will continue to be affected by changes in the U.S. dollar against major foreign currencies, particularly the Euro. Fluctuations in foreign currencies impact
55
the amount of total assets, liabilities, earnings and cash flows that we report for our foreign subsidiaries upon the translation of these amounts into U.S. dollars. In particular, the strengthening of the U.S. dollar generally will reduce the reported amount of our foreign-denominated cash and cash equivalents, total revenues and total expenses that we translate into U.S. dollars and report in our consolidated financial statements. These gains or losses are recorded as a component of accumulated other comprehensive loss within shareholders’ equity.
Transaction exposure
We transact business in multiple currencies. As a result, our results of operations and cash flows are subject to fluctuations due to changes in foreign currency exchange rates on transactions denominated in currencies other than the functional currencies of our subsidiaries. These gains or losses are recorded within “Other (expense) income, net” in our consolidated statements of operations.
Interest Rate Risk
As of March 31, 2025, we had cash and cash equivalents of $1,017.0 million, consisting primarily of money market funds, bank deposits, and highly liquid investments with an original maturity of three months or less, and investments of $147.8 million, primarily consisting of U.S. Treasury securities, corporate debt securities, commercial paper and U.S. agency securities. These interest-earning instruments carry a degree of interest rate risk. We do not enter into investments for trading or speculative purposes and have not used any derivative financial instruments to manage our interest rate risk exposure. A hypothetical 10% change in interest rates during any of the periods presented would not have had a material impact on our consolidated financial statements.
As of March 31, 2025, we also had the Credit Facility- in place, with availability of $399.2 million. The Credit Facility bears interest based on (i) the Term Secured Overnight Financing Rate plus 0.10%, (ii) the Adjusted Euro Interbank Offer Rate, (iii) the Canadian Overnight Repo Rate Average, (iv) the Base Rate, as defined per the Credit Facility, or (v) the Sterling Overnight Index Average, in each case plus an applicable margin, as defined in the Credit Agreement. A hypothetical 10% change in interest rates during any of the periods presented would not have had a material impact on our consolidated financial statements.
56
ITEM 8. FINANCIAL STATEMENTS AND SUPPLEMENTARY DATA
Report of Independent Registered Public Accounting Firm
To the Shareholders and the Board of Directors of Dynatrace, Inc.
Opinion on the Financial Statements
We have audited the accompanying consolidated balance sheets of Dynatrace, Inc. (the Company) as of March 31, 2025 and 2024, the related consolidated statements of operations, comprehensive income, shareholders’ equity and cash flows for each of the three years in the period ended March 31, 2025, and the related notes (collectively referred to as the “consolidated financial statements”). In our opinion, the consolidated financial statements present fairly, in all material respects, the financial position of the Company at March 31, 2025 and 2024, and the results of its operations and its cash flows for each of the three years in the period ended March 31, 2025, in conformity with U.S. generally accepted accounting principles.
We also have audited, in accordance with the standards of the Public Company Accounting Oversight Board (United States) (PCAOB), the Company's internal control over financial reporting as of March 31, 2025, based on criteria established in Internal Control—Integrated Framework issued by the Committee of Sponsoring Organizations of the Treadway Commission (2013 framework), and our report dated May 22, 2025 expressed an unqualified opinion thereon.
Basis for Opinion
These financial statements are the responsibility of the Company's management. Our responsibility is to express an opinion on the Company’s financial statements based on our audits. We are a public accounting firm registered with the PCAOB and are required to be independent with respect to the Company in accordance with the U.S. federal securities laws and the applicable rules and regulations of the Securities and Exchange Commission and the PCAOB.
We conducted our audits in accordance with the standards of the PCAOB. Those standards require that we plan and perform the audit to obtain reasonable assurance about whether the financial statements are free of material misstatement, whether due to error or fraud. Our audits included performing procedures to assess the risks of material misstatement of the financial statements, whether due to error or fraud, and performing procedures that respond to those risks. Such procedures included examining, on a test basis, evidence regarding the amounts and disclosures in the financial statements. Our audits also included evaluating the accounting principles used and significant estimates made by management, as well as evaluating the overall presentation of the financial statements. We believe that our audits provide a reasonable basis for our opinion.
Critical Audit Matters
The critical audit matters communicated below are matters arising from the current period audit of the financial statements that were communicated or required to be communicated to the audit committee and that: (1) relate to accounts or disclosures that are material to the financial statements and (2) involved our especially challenging, subjective or complex judgments. The communication of critical audit matters does not alter in any way our opinion on the consolidated financial statements, taken as a whole, and we are not, by communicating the critical audit matters below, providing separate opinions on the critical audit matters or on the accounts or disclosures to which they relate.
| Revenue Recognition – Determination of Distinct Performance Obligations | |||||
| Description of the Matter |
As described in Note 2 to the consolidated financial statements, the Company enters into contracts with customers that may include promises to transfer software licenses, subscription services, maintenance and support for software licenses, and professional services. Given the nature of the Company’s product and service offerings, there is complexity in determining whether software licenses and services are considered performance obligations that should be accounted for separately or together. Auditing the Company’s determination of distinct performance obligations related to its various product and service offerings involved a high degree of judgment. Specifically, significant auditor judgment was required when assessing whether the when-and-if available updates included within the Company’s maintenance agreements and the related software licenses should be accounted for as separate performance obligations or as inputs to a combined performance obligation. |
||||
57
| How We Addressed the Matter in Our Audit |
We obtained an understanding, evaluated the design and tested the operating effectiveness of internal controls over the Company’s processes as they relate to the determination of distinct performance obligations within contracts with customers. Among other audit procedures, we selected a sample of contracts and evaluated whether management appropriately identified and considered whether the contract had (1) multiple promised products or services that constitute separate performance obligations or (2) a single performance obligation that is comprised of combined products and/or services. To evaluate management’s conclusion that when-and-if available updates included within the Company’s maintenance agreements are critical to the continued utility of the related software licenses such that they should be accounted together as inputs to a combined performance obligation, we obtained an understanding of the nature and importance of the updates, assessed the impact and frequency of updates, and reviewed information around the updates included on the Company’s website and marketing materials. |
||||
| Income Taxes – Valuation of Transferred IP | |||||
| Description of the Matter |
As described in Note 9 to the consolidated financial statements, during the year ended March 31, 2025, the Company completed an intra-entity asset transfer of global economic rights of certain intellectual property assets (“IP”). The transaction resulted in a step-up of tax-deductible basis in the transferred assets, and accordingly, created a temporary difference where the tax basis exceeded the financial statement basis of such intangible assets, which resulted in the recognition of a discrete tax benefit and related deferred tax asset of $320.9 million. The Company determined the estimated value of the IP based principally on the present value of projected income related to the IP, requiring management to estimate discount rates and the forecast of future revenues. Auditing discount rates and the forecast of future revenue assumptions used in the valuation of the IP required a high degree of judgment and an increased extent of effort, including the need to involve our tax transfer pricing specialists, when performing audit procedures to evaluate the reasonableness of management’s methodologies, estimates and assumptions related to the selection of the discount rates and forecasts of future revenues. |
||||
| How We Addressed the Matter in Our Audit |
We obtained an understanding, evaluated the design and tested the operating effectiveness of internal controls over the Company’s processes as they relate to the valuation of the intra-entity IP transfer, including management’s selection of the discount rates and forecasts of future revenue. Among other audit procedures, we evaluated the reasonableness of the discount rates with the assistance from our tax transfer pricing specialist, including testing the source information underlying the determination of the discount rate and the mathematical accuracy of the calculation. We evaluated the reasonableness of management’s forecasts of revenue by comparing the forecasts to (1) historical results, (2) comparable guideline public companies, and (3) industry reports. |
||||
/s/ Ernst & Young LLP
We have served as the Company’s auditor since 2022.
Detroit, Michigan
May 22, 2025
58
DYNATRACE, INC.
CONSOLIDATED BALANCE SHEETS
(In thousands, except share data)
| March 31, | |||||||||||
| 2025 | 2024 | ||||||||||
| Assets | |||||||||||
| Current assets: | |||||||||||
| Cash and cash equivalents | $ | $ | |||||||||
| Short-term investments | |||||||||||
| Accounts receivable, net | |||||||||||
| Deferred commissions, current | |||||||||||
| Prepaid expenses and other current assets | |||||||||||
| Total current assets | |||||||||||
| Long-term investments | |||||||||||
| Property and equipment, net | |||||||||||
| Operating lease right-of-use asset, net | |||||||||||
| Goodwill | |||||||||||
| Intangible assets, net | |||||||||||
| Deferred tax assets, net | |||||||||||
| Deferred commissions, non-current | |||||||||||
| Other assets | |||||||||||
| Total assets | $ | $ | |||||||||
| Liabilities and shareholders' equity | |||||||||||
| Current liabilities: | |||||||||||
| Accounts payable | $ | $ | |||||||||
| Accrued expenses, current | |||||||||||
| Deferred revenue, current | |||||||||||
| Operating lease liabilities, current | |||||||||||
| Total current liabilities | |||||||||||
| Deferred revenue, non-current | |||||||||||
| Accrued expenses, non-current | |||||||||||
| Operating lease liabilities, non-current | |||||||||||
| Deferred tax liabilities | |||||||||||
| Total liabilities | |||||||||||
| Commitments and contingencies (Note 13) | |||||||||||
| Shareholders' equity: | |||||||||||
Common shares, $ |
|||||||||||
| Additional paid-in capital | |||||||||||
| Retained earnings (accumulated deficit) | ( |
||||||||||
| Accumulated other comprehensive loss | ( |
( |
|||||||||
| Total shareholders' equity | |||||||||||
| Total liabilities and shareholders' equity | $ | $ | |||||||||
See accompanying notes to consolidated financial statements
59
DYNATRACE, INC.
CONSOLIDATED STATEMENTS OF OPERATIONS
(In thousands, except per share data)
| Fiscal Year Ended March 31, | |||||||||||||||||
| 2025 | 2024 | 2023 | |||||||||||||||
| Revenue: | |||||||||||||||||
| Subscription | $ | $ | $ | ||||||||||||||
| Service | |||||||||||||||||
| Total revenue | |||||||||||||||||
| Cost of revenue: | |||||||||||||||||
| Cost of subscription | |||||||||||||||||
| Cost of service | |||||||||||||||||
| Amortization of acquired technology | |||||||||||||||||
| Total cost of revenue | |||||||||||||||||
| Gross profit | |||||||||||||||||
| Operating expenses: | |||||||||||||||||
| Research and development | |||||||||||||||||
| Sales and marketing | |||||||||||||||||
| General and administrative | |||||||||||||||||
| Amortization of other intangibles | |||||||||||||||||
| Total operating expenses | |||||||||||||||||
| Income from operations | |||||||||||||||||
| Interest income (expense), net | ( |
||||||||||||||||
| Other (expense) income, net | ( |
( |
|||||||||||||||
| Income before income taxes | |||||||||||||||||
| Income tax benefit (expense) | ( |
||||||||||||||||
| Net income | $ | $ | $ | ||||||||||||||
| Net income per share: | |||||||||||||||||
| Basic | $ | $ | $ | ||||||||||||||
| Diluted | $ | $ | $ | ||||||||||||||
Weighted average shares outstanding: |
|||||||||||||||||
| Basic | |||||||||||||||||
| Diluted | |||||||||||||||||
See accompanying notes to consolidated financial statements
60
DYNATRACE, INC.
CONSOLIDATED STATEMENTS OF COMPREHENSIVE INCOME
(In thousands)
| Fiscal Year Ended March 31, | |||||||||||||||||
| 2025 | 2024 | 2023 | |||||||||||||||
| Net income | $ | $ | $ | ||||||||||||||
| Other comprehensive income (loss) | |||||||||||||||||
| Foreign currency translation adjustment | ( |
( |
|||||||||||||||
| Unrealized gains (losses) on available-for-sale investments, net of taxes | ( |
||||||||||||||||
| Total other comprehensive income (loss) | ( |
( |
|||||||||||||||
| Comprehensive income | $ | $ | $ | ||||||||||||||
See accompanying notes to consolidated financial statements
61
DYNATRACE, INC.
CONSOLIDATED STATEMENTS OF SHAREHOLDERS’ EQUITY
(In thousands)
| Common Shares | Additional Paid-In Capital |
(Accumulated Deficit) Retained Earnings | Accumulated Other Comprehensive Loss |
Shareholders’ Equity | |||||||||||||||||||||||||||||||
| Shares | Amount | ||||||||||||||||||||||||||||||||||
| Balance, March 31, 2022 | $ | $ | $ | ( |
$ | ( |
$ | ||||||||||||||||||||||||||||
| Other comprehensive loss | — | — | — | — | ( |
( |
|||||||||||||||||||||||||||||
| Restricted stock units vested | ( |
— | — | ||||||||||||||||||||||||||||||||
| Restricted stock awards forfeited | ( |
— | — | — | — | — | |||||||||||||||||||||||||||||
| Issuance of common stock related to employee stock purchase plan | — | — | — | ||||||||||||||||||||||||||||||||
| Exercise of stock options | — | — | |||||||||||||||||||||||||||||||||
| Share-based compensation | — | — | — | — | |||||||||||||||||||||||||||||||
| Equity repurchases | — | — | ( |
— | — | ( |
|||||||||||||||||||||||||||||
| Net income | — | — | — | — | |||||||||||||||||||||||||||||||
| Balance, March 31, 2023 | $ | $ | $ | ( |
$ | ( |
$ | ||||||||||||||||||||||||||||
| Other comprehensive loss | — | — | — | — | ( |
( |
|||||||||||||||||||||||||||||
| Restricted stock units vested | ( |
— | — | ||||||||||||||||||||||||||||||||
| Restricted stock awards granted | — | — | — | — | — | ||||||||||||||||||||||||||||||
| Issuance of common stock related to employee stock purchase plan | — | — | |||||||||||||||||||||||||||||||||
| Exercise of stock options | — | — | |||||||||||||||||||||||||||||||||
| Share-based compensation | — | — | — | — | |||||||||||||||||||||||||||||||
| Net income | — | — | — | — | |||||||||||||||||||||||||||||||
| Balance, March 31, 2024 | $ | $ | $ | ( |
$ | ( |
$ | ||||||||||||||||||||||||||||
| Other comprehensive income | — | — | — | — | |||||||||||||||||||||||||||||||
| Restricted stock units vested | ( |
— | — | ||||||||||||||||||||||||||||||||
| Issuance of common stock related to employee stock purchase plan | — | — | — | ||||||||||||||||||||||||||||||||
| Exercise of stock options | — | — | |||||||||||||||||||||||||||||||||
| Share-based compensation | — | — | — | — | |||||||||||||||||||||||||||||||
| Shares withheld for employee taxes | ( |
— | ( |
— | — | ( |
|||||||||||||||||||||||||||||
| Repurchases of common stock | ( |
( |
( |
— | — | ( |
|||||||||||||||||||||||||||||
| Net income | — | — | — | — | |||||||||||||||||||||||||||||||
| Balance, March 31, 2025 | $ | $ | $ | $ | ( |
$ | |||||||||||||||||||||||||||||
See accompanying notes to consolidated financial statements
62
DYNATRACE, INC.
CONSOLIDATED STATEMENTS OF CASH FLOWS
(In thousands)
| Fiscal Year Ended March 31, | |||||||||||||||||
| 2025 | 2024 | 2023 | |||||||||||||||
| Cash flows from operating activities: | |||||||||||||||||
| Net income | $ | $ | $ | ||||||||||||||
| Adjustments to reconcile net income to cash provided by operations: | |||||||||||||||||
| Depreciation | |||||||||||||||||
| Amortization | |||||||||||||||||
| Share-based compensation | |||||||||||||||||
| Loss on extinguishment of debt | |||||||||||||||||
| Deferred income taxes | ( |
( |
( |
||||||||||||||
| Other | |||||||||||||||||
| Net change in operating assets and liabilities: | |||||||||||||||||
| Accounts receivable | ( |
( |
( |
||||||||||||||
| Deferred commissions | ( |
( |
( |
||||||||||||||
| Prepaid expenses and other assets | ( |
( |
|||||||||||||||
| Accounts payable and accrued expenses | |||||||||||||||||
| Operating leases, net | ( |
||||||||||||||||
| Deferred revenue | |||||||||||||||||
| Net cash provided by operating activities | |||||||||||||||||
| Cash flows from investing activities: | |||||||||||||||||
| Purchase of property and equipment | ( |
( |
( |
||||||||||||||
| Capitalized software additions | ( |
( |
|||||||||||||||
| Acquisition of businesses, net of cash acquired | ( |
( |
|||||||||||||||
| Purchases of investments | ( |
( |
|||||||||||||||
| Sales and maturities of investments | |||||||||||||||||
| Net cash used in investing activities | ( |
( |
( |
||||||||||||||
| Cash flows from financing activities: | |||||||||||||||||
| Repayment of term loans | ( |
||||||||||||||||
| Debt issuance costs | ( |
||||||||||||||||
| Payments of deferred consideration related to capitalized software additions | ( |
||||||||||||||||
| Proceeds from employee stock purchase plan | |||||||||||||||||
| Proceeds from exercise of stock options | |||||||||||||||||
| Repurchases of common stock | ( |
||||||||||||||||
| Taxes paid related to net share settlement of equity awards | ( |
||||||||||||||||
| Equity repurchases | ( |
||||||||||||||||
| Net cash (used in) provided by financing activities | ( |
( |
|||||||||||||||
| Effect of exchange rates on cash and cash equivalents | ( |
( |
( |
||||||||||||||
| Net increase in cash and cash equivalents | |||||||||||||||||
| Cash and cash equivalents, beginning of year | |||||||||||||||||
| Cash and cash equivalents, end of year | $ | $ | $ | ||||||||||||||
| Supplemental cash flow data: | |||||||||||||||||
| Cash paid for interest | $ | $ | $ | ||||||||||||||
| Cash paid for (received from) tax, net | $ | $ | $ | ( |
|||||||||||||
| Non-cash investing and financing activities: | |||||||||||||||||
| Capitalized software additions in accounts payable and accrued expenses | $ | $ | $ | ||||||||||||||
See accompanying notes to consolidated financial statements
63
DYNATRACE, INC.
NOTES TO CONSOLIDATED FINANCIAL STATEMENTS
1. Description of the Business
Business
Dynatrace, Inc. (“Dynatrace” or the “Company”) is advancing observability for today’s digital businesses, helping to transform the complexity of modern digital ecosystems into powerful business assets. By leveraging artificial intelligence (“AI”)-powered insights, Dynatrace enables organizations to analyze, automate, and innovate faster to drive their business forward. The Company’s comprehensive solution combines broad and deep observability, continuous runtime application security, and advanced AI to support IT operations, development, security, and business teams, enabling organizations to optimize cloud and IT operations, accelerate secure software delivery, and improve digital performance.
Fiscal year
The Company’s fiscal year ends on March 31. References to fiscal 2025, for example, refer to the fiscal year ended March 31, 2025.
2. Significant Accounting Policies
Basis of presentation and consolidation
Foreign currency translation
The reporting currency of the Company is the U.S. dollar. The functional currency of the Company’s principal foreign subsidiaries is the currency of the country in which each entity operates. Accordingly, assets and liabilities in the consolidated balance sheets have been translated at the rate of exchange at the balance sheet date, and revenues and expenses have been translated at average exchange rates prevailing during the period the transactions occurred. Translation adjustments have been excluded from the results of operations and are reported as accumulated other comprehensive loss within the consolidated statements of shareholders’ equity.
Transaction gains and losses generated by the effect of changes in foreign currency exchange rates on recorded assets and liabilities denominated in a currency different than the functional currency of the applicable entity are recorded in “Other (expense) income, net” in the consolidated statements of operations.
Use of estimates
The preparation of consolidated financial statements in accordance with GAAP requires management to make estimates and assumptions that affect the amounts reported in the consolidated financial statements and accompanying notes. Management evaluates such estimates and assumptions for continued reasonableness. In particular, the Company makes estimates with respect to the stand-alone selling price for each distinct performance obligation in customer contracts with multiple performance obligations, the allowance for credit losses, the fair value of assets acquired and liabilities assumed in business combinations, the valuation of long-lived assets, the valuation of intellectual property (“IP”), the period of benefit for deferred commissions, income taxes, equity-based compensation expense, and the determination of the incremental borrowing rate used for operating lease liabilities, among other things. Management bases these estimates on historical experiences and on various other assumptions that the Company believes are reasonable. Actual results could differ from those estimates.
Segment information
The Company has one
Business combinations
When the Company acquires a business, management allocates the fair value of the purchase price to the assets acquired and liabilities assumed. The excess of the purchase price over the fair values of the identifiable assets and liabilities is recorded as goodwill. Determining the fair values of identifiable assets and liabilities requires management to make estimates and assumptions, especially with respect to intangible assets. These estimates can include, but are not limited to, future expected cash flows, expected asset lives,
64
Revenue recognition
The Company sells subscriptions, software licenses, maintenance and support, and professional services together in contracts with its customers, which include end-customers and channel partners. The Company’s software license agreements provide customers with a right to use software for a defined term. As required under applicable accounting principles, the goods and services that the Company promises to transfer to a customer are accounted for separately if they are distinct from one another. Promised items that are not distinct are bundled as a combined performance obligation. The transaction price is allocated to the performance obligations based on the relative estimated standalone selling prices of those performance obligations.
The Company determines revenue recognition through the following steps:
1.Identification of the contract, or contracts, with a customer
The Company considers the terms and conditions of the contract in identifying the contracts. The Company determines a contract with a customer to exist when the contract is approved, each party’s rights regarding the services to be transferred can be identified, the payment terms for the services can be identified, it has been determined the customer has the ability and intent to pay, and the contract has commercial substance. At contract inception, the Company will evaluate whether two or more contracts should be combined and accounted for as a single contract and whether the combined or single contract includes more than one performance obligation. The Company applies judgment in determining the customer’s ability and intent to pay, which is based on a variety of factors, including the customer’s historical payment experience or, in the case of a new customer, credit, and financial information pertaining to the customer.
2.Identification of the performance obligations in the contract
Performance obligations promised in a contract are identified based on the services and the products that will be transferred to the customer that are both capable of being distinct, whereby the customer can benefit from the service either on its own or together with other resources that are readily available from third parties or from the Company, and are distinct in the context of the contract, whereby the transfer of the services and the products is separately identifiable from other promises in the contract. In identifying performance obligations, the Company reviews contractual terms, considers whether any implied rights exist, and evaluates published product and marketing information. The Company’s performance obligations consist of (a) subscription services; (b) software licenses; (c) maintenance and support for software licenses; and (d) professional services.
3.Determination of the transaction price
The transaction price is determined based on the consideration to which the Company expects to be entitled in exchange for transferring services to the customer. Variable consideration is included in the transaction price if, in the Company’s judgment, it is probable that a significant future reversal of cumulative revenue under the contract will not occur. The Company’s contracts do not contain a significant financing component.
4.Allocation of the transaction price to the performance obligations in the contract
If the contract contains a single performance obligation, the entire transaction price is allocated to the single performance obligation. Contracts that contain multiple performance obligations require an allocation of the transaction price to each performance obligation based on a relative standalone selling price (“SSP”) for arrangements not including subscription services or software licenses. The Company has determined that its pricing for subscription services and software licenses is highly variable and therefore allocates the transaction price to those performance obligations using the residual approach.
5.Recognition of revenue when, or as a performance obligation is satisfied
Revenue is recognized at the time the related performance obligation is satisfied by transferring the control of the promised service to a customer. Revenue is recognized when control of the service is transferred to the customer, in an amount that reflects the consideration that the Company expects to receive in exchange for those services.
Subscription
Subscription revenue relates to performance obligations for which the Company recognizes revenue over time as control of the product or service is transferred to the customer. Subscription revenue is derived from (i) SaaS arrangements that permit customers to access and utilize the Company’s platform on a hosted basis and (ii) arrangements where the software is delivered and used on-premise as term-based licenses, both of which are sold with maintenance. The when-and-if available updates of the Dynatrace platform, which are part of the maintenance agreement, are critical to the continued utility of the Dynatrace platform; therefore, the Company has determined the Dynatrace platform and the related when-and-if available updates to be a combined performance
65
obligation. Subscription revenues from the performance obligations when sold as a SaaS arrangement are generally recognized ratably over the term of the arrangement. When the platform is sold as a term-based license, the revenue for the combined performance obligation is recognized ratably over the license term as maintenance is included for the duration of the license term.
Service
The Company offers implementation, consulting and training services for the Company’s software solutions and SaaS offerings. Services fees are generally based on hourly rates. Revenues from services are recognized in the period the services are performed, provided that collection of the related receivable is reasonably assured.
Deferred commissions
Deferred sales commissions earned by the Company’s sales force are considered incremental and recoverable costs of obtaining a contract with a customer. Sales commissions for new contracts are deferred and then amortized on a straight-line basis over a period of benefit which the Company has estimated to be three years . The period of benefit has been determined by taking into consideration the duration of customer contracts, the life of the technology, renewals of maintenance and other factors. Sales commissions for renewal contracts are deferred and then amortized on a straight-line basis over a period of benefit which the Company has estimated to be three years . Amortization expense is included in “Sales and marketing” expenses on the consolidated statements of operations.
The Company periodically reviews these deferred costs to determine whether events or changes in circumstances have occurred that could impact the period of benefit of these deferred commissions. There were no
Deferred revenue
Deferred revenue consists primarily of billed subscription fees related to the future service period of subscription agreements in effect at the reporting date. Short-term deferred revenue represents the unearned revenue that will be earned within 12 months of the balance sheet date. Long-term deferred revenue represents the unearned revenue that will be earned after 12 months from the balance sheet date.
Payment terms
Payment terms and conditions vary by contract type, although the Company’s terms generally include a requirement of payment within 30 to 60 days. In instances where the timing of revenue recognition differs from the timing of payment, the Company has determined that its contracts do not include a significant financing component. The primary purpose of invoicing terms is to provide customers with simplified and predictable ways of purchasing products and services, not to receive financing from customers or to provide customers with financing.
Contract modifications
Contract modifications are assessed to determine (i) if the additional goods and services are distinct from the goods and services in the original arrangement; and (ii) if the amount of the consideration expected for the added goods and services reflects the SSP of those goods and services, as adjusted for contract-specific circumstances. The Company’s additional goods and services offered have historically been distinct. A contract modification meeting both criteria is accounted for as a separate contract. A contract modification not meeting both criteria is considered a change to the original contract, which the Company accounts for on a prospective basis as the termination of the existing contract and the creation of a new contract.
Research and development
Advertising
Leases
Leases arise from contractual obligations that convey the right to control the use of identified property, plant or equipment for a period of time in exchange for consideration. At the inception of the contract, the Company determines if an arrangement contains a lease based on whether there is an identified asset and whether the Company controls the use of the identified asset. The Company also
66
determines the classification of that lease, between financing and operating, at the lease commencement date. The Company accounts for and allocates consideration to the lease and non-lease components as a single lease component.
A right-of-use asset represents the Company’s right to use an underlying asset for the lease term and a lease liability represents the Company’s obligation to make payments during the lease term. Right-of-use assets are recognized at the lease commencement date for the lease liability, adjusted for initial direct costs incurred and lease incentives received. Lease liabilities are recorded at the present value of the future lease payments over the lease term. The discount rate used to determine the present value is the incremental borrowing rate as the implicit rate for the operating leases is generally not determinable. The Company determines the incremental borrowing rate of the leases by considering various factors, such as the credit rating, interest rates of similar debt instruments of entities with comparable credit ratings, jurisdictions, and the lease term.
The Company’s lease terms may include options to extend or terminate the lease. The Company generally uses the base, non-cancelable, lease term when recognizing the lease assets and liabilities, unless it is reasonably certain that the Company will exercise those options. The Company’s lease agreements do not contain any material residual value guarantees or material restrictive covenants.
The Company does not record leases with terms of 12 months or less on the consolidated balance sheets. Lease expense is recognized on a straight-line basis over the expected lease term.
Concentration of credit risk
Financial instruments that potentially subject the Company to concentrations of credit risk consist of cash and cash equivalents, investments and accounts receivable.
The Company maintains the majority of its cash, cash equivalents and investments with major financial institutions that the Company believes to be of high credit standing. The Company maintains its cash in bank deposit accounts that, at times, may exceed federally insured limits.
As of March 31, 2025 and 2024, there was one one channel partner accounted for 10% of revenue. No channel partners accounted for 10% or more of revenue for the years ended March 31, 2024 and 2023. There were no end-customers who represented 10% or more of revenue for the years ended March 31, 2025, 2024, and 2023.
Cash and cash equivalents
All highly liquid investments with an original maturity of three months or less when purchased are considered cash and cash equivalents.
Investments
The Company’s investments consist of commercial paper, corporate debt securities, U.S. government agency securities, and U.S. treasury securities. These investments are classified as available-for-sale and recorded at fair value in the consolidated balance sheet.
Premiums and discounts are amortized or accreted over the life of the related available-for-sale security as an adjustment to yield. Interest income is recognized when earned.
Unrealized gains and losses on available-for-sale investments, net of tax, are included within accumulated other comprehensive loss in the consolidated balance sheets. The Company regularly reviews the securities in an unrealized loss position and evaluates the current expected credit loss by considering factors such as credit ratings, issuer-specific factors, current economic conditions, and reasonable and supportable forecasts. The Company does not intent to sell these investments and it is more likely than not that the Company will not be required to sell these investments before recovery of their amortized cost basis. Based on the evaluation of available evidence, the Company does not believe any unrealized losses on its investments as of March 31, 2025 represent credit losses.
Realized gains and losses from the sales of available-for-sale investments are based on the specific identification method and are recorded in the consolidated statement of income as “Other (expense) income, net”.
67
Accounts receivable, net
Property and equipment, net
| Computer equipment and software | |||||
| Furniture and fixtures | |||||
| Leasehold improvements | Lesser of |
||||
Goodwill and intangible assets
Goodwill represents the excess of the purchase price of an acquired business over the fair value of the assets acquired and liabilities assumed. Goodwill is evaluated for impairment annually and whenever events or changes in circumstances indicate the carrying value of goodwill may not be recoverable. The Company has elected to first assess the qualitative factors to determine if it is more likely than not that the fair value of the underlying assets is less than its carrying amount. If the Company determines that it is more likely than not that the underlying assets’ fair value is less than its carrying amount in the qualitative analysis, then a quantitative goodwill impairment test will be performed by comparing the fair value of the assets to their carrying value. For the purposes of impairment testing, the Company is evaluated as one reporting unit.
Intangible assets consist primarily of customer relationships, developed technology, tradenames and trademarks, all of which have a finite useful life. Intangible assets are amortized based on either the pattern in which the economic benefits of the intangible assets are estimated to be realized or on a straight-line basis, which approximates the manner in which the economic benefits of the intangible asset will be consumed.
There was no
Capitalized software
Software development costs associated with software developed, acquired or modified for internal use is capitalized. Costs incurred during the preliminary planning and evaluation stage of the project and during the post implementation stages of the project are expensed as incurred. Costs incurred during the application development stage of the project are capitalized. These capitalized costs consist of internal compensation related costs and direct external costs. The amortization period for these capitalized costs is generally to five years depending on the project.
During the year ended March 31, 2024, the Company entered into a license agreement with an application security provider, resulting in $10.3 million of capitalized costs related to software developed for internal use. During the years ended March 31, 2025 and 2023, the Company did not 2.1 million, $0.9 million, and $0.2 million during the years ended March 31, 2025, 2024 and 2023, respectively, and is recorded within “Cost of subscription” in the consolidated statements of operations.
Impairment of long-lived assets
Long-lived assets are reviewed for impairment whenever events or changes in circumstances indicate that the carrying amount of an asset may not be recoverable. If circumstances require a long-lived asset or asset group be tested for possible impairment, the Company first compares undiscounted cash flows expected to be generated by an asset to the carrying value of the asset. If the carrying value of the long-lived asset is not recoverable on an undiscounted cash flow basis, impairment is recognized to the extent that the carrying value exceeds its fair value. Fair value is estimated by the Company using discounted cash flows and other market-
68
Income taxes
The Company accounts for income taxes under the asset and liability method, which requires the recognition of deferred tax assets and liabilities for the expected future tax consequences of events that have been included in the consolidated financial statements. Under this method, deferred tax assets and liabilities are determined based on the differences between the consolidated financial statements and income tax bases of assets and liabilities and net operating loss and tax credit carryforwards using enacted tax rates in effect for the year in which the differences are expected to reverse. The effect of a change in tax rates on deferred tax assets and liabilities is recognized in the period that includes the enactment date. The Company records deferred tax liabilities that arise from outside basis differences in foreign subsidiaries that are not considered indefinitely reinvested.
Deferred tax assets are reduced by a valuation allowance if it is more likely than not that some or all of the deferred taxes will not be realized. In making such determination, the Company considers all available positive and negative evidence, including future reversals of existing taxable temporary differences, projected future taxable income, tax planning strategies and recent financial operations.
The Company records uncertain tax positions in accordance with ASC 740 on the basis of a two-step process in which (1) the Company determines whether it is more likely than not that that the tax positions will be sustained on the basis of the technical merits of the position; and (2) for those tax positions that meet the more likely than not recognition threshold, the Company recognizes the largest amount of tax benefit that is more than 50% likely to be realized upon ultimate settlement with the related tax authority. The Company recognizes interest and penalties related to unrecognized tax benefits on the income tax expense line the accompanying consolidated statement of operations.
Fair value of assets and liabilities
Assets and liabilities recorded at fair value are categorized based upon the level of judgment associated with the inputs used to measure their fair value. The hierarchical levels are as follows:
•Level 1: Observable inputs that reflect quoted prices for identical assets or liabilities in active markets;
•Level 2: Observable inputs, other than Level 1 prices, such as quoted prices for similar assets or liabilities, quoted prices in markets that are not active or other inputs that are observable or can be corroborated by observable market data for substantially the full term of the assets or liabilities; and
•Level 3: Unobservable inputs reflecting the Company’s own assumptions incorporated in valuation techniques used to determine fair value. These assumptions are required to be consistent with market participant assumptions that are reasonably available.
Share-based compensation
The Company measures the cost of employee services received in exchange for an award of equity instruments, including stock options, restricted stock awards (“RSAs”), time-based, performance-based and market-based restricted stock units (“RSUs”), and the purchase rights under the employee stock purchase plan (the “ESPP”), based on the estimated grant-date fair value of the award. The Company calculates the fair value of stock options and the purchase rights under the ESPP using the Black-Scholes option-pricing model. This requires the input of assumptions, including the fair value of the Company’s underlying common stock, the expected term of stock options and purchase rights, the expected volatility of the price of the Company’s common stock, risk-free interest rates, and the expected dividend yield of the Company’s common stock. The fair value of time-based and performance-based RSAs and RSUs is determined by the closing price on the date of grant of the Company’s common stock. The Company calculates the fair value of market-based RSUs using the Monte Carlo simulation model. This requires the input of assumptions, including the fair value of the Company’s underlying common stock, the expected performance period of the award, the expected volatility of the price of the Company’s and peer group’s common stock, risk-free interest rates, and the expected dividend yield of the Company’s common stock.
The Company recognizes share-based compensation expense following the straight-line attribution method over the requisite service period of the entire award for stock options, RSAs and RSUs; and over the offering period for the purchase rights issued under the ESPP. For RSUs that vest based upon continued service and achievement of certain performance conditions, share-based compensation expense is recognized over the requisite service period following the accelerated attribution method based upon the probability that the performance condition will be satisfied. For RSUs that vest based upon continued service and achievement of
69
certain market conditions, share-based compensation expense is recognized following the accelerated attribution method over the requisite service period. Forfeitures are accounted for in the period in which the awards are forfeited.
Net income per share
Recently adopted accounting pronouncements
In November 2023, the Financial Accounting Standards Board (“FASB”) issued Accounting Standards Update (“ASU”) 2023-07, Segment Reporting (Topic 280), Improvements to Reportable Segment Disclosures, which improves reportable segment disclosure requirements, primarily through enhanced disclosures about significant segment expenses and application of all segment disclosure requirement to entities with a single reportable segment. ASU 2023-07 is effective for the Company’s annual periods beginning fiscal 2025 and interim periods beginning the first quarter of fiscal 2026. Effective March 31, 2025, the Company adopted the new standard on a retrospective basis. For further information, refer to Note 18, Segment and Geographic Information.
Recently issued accounting pronouncements
In December 2023, the FASB issued ASU 2023-09, Income Taxes (Topic 740): Improvements to Income Tax Disclosures, which expands disclosures in the income tax rate reconciliation table and disaggregates the income taxes paid by jurisdiction. ASU 2023-09 will be effective for annual periods beginning after December 15, 2024, which will be the Company’s fiscal 2026. The Company is currently evaluating the impact ASU 2023-09 will have on its financial statement disclosures.
3. Revenue Recognition
Disaggregation of revenue
The following table is a summary of the Company’s total revenue by geographic region based on the Company’s contracting entity (in thousands, except percentages):
| Fiscal Year Ended March 31, | ||||||||||||||||||||||||||||||||||||||
| 2025 | 2024 | 2023 | ||||||||||||||||||||||||||||||||||||
| Amount | % | Amount | % | Amount | % | |||||||||||||||||||||||||||||||||
| North America | $ | % | $ | % | $ | % | ||||||||||||||||||||||||||||||||
| Europe, Middle East and Africa | % | % | % | |||||||||||||||||||||||||||||||||||
| Asia Pacific | % | % | % | |||||||||||||||||||||||||||||||||||
| Latin America | % | % | % | |||||||||||||||||||||||||||||||||||
| Total revenue | $ | $ | $ | |||||||||||||||||||||||||||||||||||
For the years ended March 31, 2025, 2024, and 2023, the United States was the only country that represented more than 10% of the Company’s revenues in any period, constituting $987.2 million and 58 %, $807.7 million and 56 %, and $652.0 million and 56 % of total revenue, respectively.
70
Deferred commissions
The following table represents a rollforward of the Company’s deferred commissions (in thousands):
| Fiscal Year Ended March 31, | |||||||||||||||||
| 2025 | 2024 | 2023 | |||||||||||||||
| Beginning balance | $ | $ | $ | ||||||||||||||
| Additions to deferred commissions | |||||||||||||||||
| Amortization of deferred commissions | ( |
( |
( |
||||||||||||||
| Ending balance | $ | $ | $ | ||||||||||||||
Deferred revenue
Revenue recognized during the years ended March 31, 2025, 2024, and 2023 which was included in the deferred revenue balances at the beginning of each respective period was $975.7 million, $800.0 million, and $670.1 million.
Remaining performance obligations
As of March 31, 2025, the aggregate amount of the transaction price allocated to remaining performance obligations was $2,892.7 million, which consists of both billed consideration in the amount of $1,138.5 million and unbilled consideration in the amount of $1,754.2 million that the Company expects to recognize as subscription and service revenue. The Company expects to recognize 53 % of this amount as revenue in the year ending March 31, 2026 and the remainder thereafter.
Contract assets
As of March 31, 2025 and March 31, 2024, contract assets of $1.6 million and $5.2 million, respectively, are included in accounts receivable, net, on the Company’s consolidated balance sheets.
4. Business Combinations
Rookout, Ltd.
On August 31, 2023, the Company acquired 100 % of the outstanding equity of Rookout, Ltd. (“Rookout”), a provider of enterprise-ready and privacy-aware solutions that enable developers to troubleshoot and debug actively running code in Kubernetes-hosted cloud-native applications. This acquisition expanded the Company’s platform from the addition of Rookout’s technology and experienced team. The purchase consideration of Rookout was $33.4 million, after considering certain adjustments, and was paid from cash on hand.
The fair value of the purchase price was allocated to the identifiable assets acquired and liabilities assumed as of the acquisition date, with the excess recorded to goodwill. The Company acquired $6.0 million of net assets, including $7.8 million of intangible assets, resulting in goodwill of $27.4 million. The fair value of acquired assets and assumed liabilities was finalized in August 2024.
Goodwill related to Rookout was primarily attributable to expected synergies and acquired skilled workforce. The goodwill was allocated to the Company’s one reporting unit. The Company identified developed technology as the sole acquired intangible asset. The estimated fair value of the developed technology was $7.8 million, which was based on a valuation using the income approach. The estimated useful life of the developed technology is seven years . The acquired goodwill and intangible asset were not deductible for tax purposes.
Runecast Solutions Limited
On March 1, 2024, the Company acquired a 100 % equity interest in Runecast Solutions Limited (“Runecast”), a provider of software solutions that provide insights for security compliance, vulnerability assessment, and configuration management for complex, on-premises, hybrid and multi-cloud IT environments. This acquisition expanded the Company’s platform from the addition of Runecast’s technology and experienced team.
The purchase consideration consisted of $26.1 million of cash paid at closing and $2.3 million in deferred cash payments for a post-closing purchase price adjustment and a holdback to satisfy potential indemnification claims. For the year ended March 31, 2025, the Company paid $0.1 million for a post-closing purchase price adjustment. The Company is obligated to pay the remaining holdback amount within 15 months after the acquisition date.
71
In connection with the acquisition of Runecast, $9.0 million of RSAs were issued to the previous owners subject to continuing employment and certain indemnification clauses. For the years ended March 31, 2025 and 2024, the Company recognized $3.7 million and $0.3 million of share-based compensation expense for these RSAs, respectively.
The fair value of the purchase price was allocated to the identifiable assets acquired and assumed acquired as of the acquisition date, with the excess recorded to goodwill. The Company acquired $3.2 million of net assets, including $7.5 million of intangible assets, resulting in goodwill of $25.2 million. The fair value of acquired assets and assumed liabilities was finalized in March 2025.
5. Investments and Fair Value Measurements
The following table summarizes the amortized cost, unrealized gains and losses, and fair value of the Company’s available-for-sale investments, including those securities classified within “Cash and cash equivalents” in the consolidated balance sheets (in thousands):
| March 31, 2025 | |||||||||||||||||||||||
| Amortized Cost | Gross Unrealized Gains | Gross Unrealized Losses | Fair Value | ||||||||||||||||||||
| U.S. treasury securities | $ | $ | $ | ( |
$ | ||||||||||||||||||
| Corporate debt securities | ( |
||||||||||||||||||||||
| Commercial paper | ( |
||||||||||||||||||||||
| U.S. government agency securities | ( |
||||||||||||||||||||||
| Total | $ | $ | $ | ( |
$ | ||||||||||||||||||
| March 31, 2024 | |||||||||||||||||||||||
| Amortized Cost | Gross Unrealized Gains | Gross Unrealized Losses | Fair Value | ||||||||||||||||||||
| U.S. treasury securities | $ | $ | $ | ( |
$ | ||||||||||||||||||
As of March 31, 2025, the fair values of available-for-sale investments, excluding those securities classified within “Cash and cash equivalents” in the consolidated balance sheets, by remaining contractual maturity are as follows (in thousands):
| Due within one year | $ | ||||
| Due in one year through five years | |||||
| Total | $ | ||||
Effective January 1, 2024, the Company offers a non-qualified deferred compensation plan to eligible U.S. employees. The Company held $0.7 million and $0.1 million of mutual funds that are associated with this plan and were classified as restricted trading securities as of March 31, 2025 and 2024, respectively. These securities are not included in the tables above but are included as investments in the consolidated balance sheets.
72
The following tables present the Company’s financial assets that have been measured at fair value on a recurring basis as of March 31, 2025 and 2024, and indicate the fair value hierarchy of the valuation inputs utilized to determine such fair value (in thousands):
| March 31, 2025 | |||||||||||||||||||||||
| Level 1 | Level 2 | Level 3 | Total | ||||||||||||||||||||
| Cash equivalents: | |||||||||||||||||||||||
| Money market funds | $ | $ | $ | $ | |||||||||||||||||||
| U.S. treasury securities | |||||||||||||||||||||||
| Commercial paper | |||||||||||||||||||||||
| U.S. government agency securities | |||||||||||||||||||||||
| Investments: | |||||||||||||||||||||||
| Mutual funds | |||||||||||||||||||||||
| U.S. treasury securities | |||||||||||||||||||||||
| Corporate debt securities | |||||||||||||||||||||||
| Commercial paper | |||||||||||||||||||||||
| U.S. government agency securities | |||||||||||||||||||||||
| Total financial assets | $ | $ | $ | $ | |||||||||||||||||||
| March 31, 2024 | |||||||||||||||||||||||
| Level 1 | Level 2 | Level 3 | Total | ||||||||||||||||||||
| Cash equivalents: | |||||||||||||||||||||||
| Money market funds | $ | $ | $ | $ | |||||||||||||||||||
| U.S. treasury securities | |||||||||||||||||||||||
| Investments: | |||||||||||||||||||||||
| Mutual funds | |||||||||||||||||||||||
| U.S. treasury securities | |||||||||||||||||||||||
| Total financial assets | $ | $ | $ | $ | |||||||||||||||||||
The Company recorded interest income from its cash, cash equivalents, and investments of $49.3 million, $38.7 million, $11.1 million for the years ended March 31, 2025, 2024, and 2023, respectively.
6. Prepaid Expenses and Other Current Assets
Prepaid expenses and other current assets consists of the following (in thousands):
| March 31, | |||||||||||
| 2025 | 2024 | ||||||||||
| Prepaid expenses | $ | $ | |||||||||
| Income taxes refundable | |||||||||||
| Other | |||||||||||
| Prepaid expenses and other current assets | $ | $ | |||||||||
73
7. Property and Equipment, Net
The following table summarizes, by major classification, the components of property and equipment (in thousands):
| March 31, | |||||||||||
| 2025 | 2024 | ||||||||||
| Computer equipment and software | $ | $ | |||||||||
| Furniture and fixtures | |||||||||||
| Leasehold improvements | |||||||||||
| Other | |||||||||||
| Total property and equipment | |||||||||||
| Less: accumulated depreciation and amortization | ( |
( |
|||||||||
| Property and equipment, net | $ | $ | |||||||||
Depreciation of property and equipment totaled $19.2 million, $15.5 million, and $12.5 million for the years ended March 31, 2025, 2024, and 2023, respectively.
8. Goodwill and Intangible Assets, Net
Changes in the carrying amount of goodwill on a consolidated basis for fiscal 2025 consists of the following (in thousands):
| March 31, 2025 | |||||
| Balance, beginning of year | $ | ||||
| Foreign currency impact | |||||
| Balance, end of year | $ | ||||
Intangible assets, net, excluding goodwill, consists of the following (in thousands):
| March 31, 2025 | ||||||||||||||||||||||||||
| Gross Carrying Amount | Accumulated Amortization | Net Carrying Amount | Weighted Average Useful Life (in months) | |||||||||||||||||||||||
| Capitalized software | $ | $ | ( |
$ | ||||||||||||||||||||||
| Customer relationships | ( |
|||||||||||||||||||||||||
| Trademarks and tradenames | ( |
|||||||||||||||||||||||||
| Total intangible assets | $ | $ | ( |
$ | ||||||||||||||||||||||
| March 31, 2024 | ||||||||||||||||||||||||||
| Gross Carrying Amount | Accumulated Amortization | Net Carrying Amount | Weighted Average Useful Life (in months) | |||||||||||||||||||||||
| Capitalized software | $ | $ | ( |
$ | ||||||||||||||||||||||
| Customer relationships | ( |
|||||||||||||||||||||||||
| Trademarks and tradenames | ( |
|||||||||||||||||||||||||
| Total intangible assets | $ | $ | ( |
$ | ||||||||||||||||||||||
Amortization of intangible assets totaled $28.9 million, $39.4 million, and $42.1 million for the years ended March 31, 2025, 2024, and 2023, respectively.
74
As of March 31, 2025, the estimated future amortization expense of the Company’s intangible assets is as follows (in thousands):
| Fiscal Years Ending March 31, | Amount | |||||||
| 2026 | $ | |||||||
| 2027 | ||||||||
| 2028 | ||||||||
| 2029 | ||||||||
| 2030 | ||||||||
| Thereafter | ||||||||
| Total | $ | |||||||
9. Income Taxes
Income tax provision
Income before income taxes includes the following (in thousands):
| Fiscal Year Ended March 31, | |||||||||||||||||
| 2025 | 2024 | 2023 | |||||||||||||||
| Domestic | $ | $ | $ | ||||||||||||||
| Foreign | |||||||||||||||||
| Total | $ | $ | $ | ||||||||||||||
The income tax provision includes the following (in thousands):
| Fiscal Year Ended March 31, | |||||||||||||||||
| 2025 | 2024 | 2023 | |||||||||||||||
| Current tax position: | |||||||||||||||||
| Federal | $ | $ | $ | ||||||||||||||
| State | ( |
||||||||||||||||
| Foreign | |||||||||||||||||
| Total current tax position | |||||||||||||||||
| Deferred tax provision: | |||||||||||||||||
| Federal | ( |
( |
( |
||||||||||||||
| State | ( |
( |
( |
||||||||||||||
| Foreign | ( |
( |
( |
||||||||||||||
| Total deferred tax provision | ( |
( |
( |
||||||||||||||
| Total income tax (benefit) expense | $ | ( |
$ | $ | ( |
||||||||||||
During the year ended March 31, 2025, the Company completed an intra-entity asset transfer of the global economic rights of Dynatrace IP from a wholly-owned U.S. subsidiary to a wholly-owned Swiss subsidiary, more closely aligning the Company’s IP rights with its business operations (the “IP Transfer”). The transaction is taxable in the U.S. over a 20-year period. In Switzerland, the transaction resulted in a step-up of tax-deductible basis in the transferred assets, and accordingly, created a temporary difference where the tax basis exceeded the financial statement basis of such intangible assets, which resulted in the recognition of a tax benefit and related deferred tax asset of $320.9
75
The Company’s income tax expense (benefit) differs from the amounts computed by applying the U.S. federal income tax rate of 21
| Fiscal Year Ended March 31, | |||||||||||||||||
| 2025 | 2024 | 2023 | |||||||||||||||
| Income tax expense at U.S. federal statutory income tax rate | $ | $ | $ | ||||||||||||||
| State and local tax expense, net of federal benefits | |||||||||||||||||
| Foreign tax rate differential | |||||||||||||||||
| U.S. effects of foreign branch income | |||||||||||||||||
| Non-taxable income and non-deductible expenses | |||||||||||||||||
| Tax credits | ( |
( |
( |
||||||||||||||
| GILTI inclusion and FDII deduction | ( |
( |
( |
||||||||||||||
| Employee compensation | ( |
||||||||||||||||
| Changes in uncertain tax positions | ( |
||||||||||||||||
| Changes in valuation allowance | ( |
||||||||||||||||
| Foreign withholding tax | |||||||||||||||||
| Inflation and currency related adjustments | ( |
||||||||||||||||
| Intra-entity transfer of IP | ( |
||||||||||||||||
| Other adjustments | ( |
( |
|||||||||||||||
| Total income tax (benefit) expense | $ | ( |
$ | $ | ( |
||||||||||||
Management’s analysis of all available positive and negative evidence as of March 31, 2025 resulted in the conclusion that the net deferred tax assets related to U.S. state and local jurisdictions, with the exception of certain state attributes, are more likely than not to be utilized. As such, the valuation allowance previously recorded against such net deferred tax assets has been reversed accordingly, resulting in a net income tax benefit of $4.8 million.
As of March 31, 2025, the Company continues to maintain a valuation allowance of $38.7 million with respect to certain U.S. federal and state deferred tax assets that, due to their nature, are not likely to be realized. In addition, the Company continues to maintain a valuation allowance of $29.5 million with respect to its deferred tax assets in certain non-U.S. jurisdictions. The net change in the valuation allowance during the year ended March 31, 2025 was $27.7 million, of which $27.1 million impacted tax expense.
76
Temporary differences and carryforwards that give rise to a significant portion of deferred tax assets and liabilities are as follows (in thousands):
| March 31, | |||||||||||
| 2025 | 2024 | ||||||||||
| Deferred tax assets: | |||||||||||
| Deferred revenue | $ | $ | |||||||||
| Capitalized research and development costs | |||||||||||
| Accrued expenses | |||||||||||
| Share-based compensation | |||||||||||
| Operating lease liabilities | |||||||||||
| Net operating loss carryforwards | |||||||||||
| Intangible assets | |||||||||||
| Tax credit carryforwards | |||||||||||
| Other | |||||||||||
| Total deferred tax assets | |||||||||||
| Valuation allowance | ( |
( |
|||||||||
| Total deferred tax assets, net valuation allowance | |||||||||||
| Deferred tax liabilities: | |||||||||||
| Intangible assets | |||||||||||
| Operating lease right-of-use assets | |||||||||||
| Deferred commissions | |||||||||||
| Other | |||||||||||
| Total deferred tax liabilities | |||||||||||
| Net deferred tax assets | $ | $ | |||||||||
At March 31, 2025, the Company had non-U.S. net operating loss carryforwards of $133.8 million, of which $91.2 million expire in periods through 2045 if not utilized, and the remaining balance of $42.6 million may be carried forward indefinitely. The Company also had non-U.S. tax credit carryforwards of $19.3 million, of which $19.1 million expire in periods through 2030 if not utilized, and the remaining balance of $0.2 million may be carried forward indefinitely. Deferred tax assets of $26.2 million related to non-U.S. net operating losses and tax credit carryforwards are subject to valuation allowances as of March 31, 2025.
At March 31, 2025, the Company had U.S. state and local net operating loss carryforwards of $45.5 million, of which $41.3 million expire in periods through 2043 if not utilized, and the remaining balance of $4.2 million may be carried forward indefinitely. The Company also had U.S. federal tax credit carryforwards of $40.3 million, which expire in periods through 2035. Deferred tax assets of $38.7 million primarily related to U.S. federal tax credit carryforwards are subject to valuation allowances as of March 31, 2025.
During the fiscal year ended March 31, 2025, the Company made the determination that the unremitted foreign earnings associated with certain of its foreign subsidiaries are no longer indefinitely reinvested as a result of the IP Transfer. The Company recorded a deferred tax liability of $0.1 million related to the taxes expected to be imposed upon the repatriation of these unremitted foreign earnings that are not considered indefinitely reinvested. The Company has not provided for taxes on the excess of the amount for financial reporting over the tax basis of investments in certain other foreign subsidiaries in which the Company maintains its assertion that it intends these earnings to be indefinitely reinvested. Generally, these earnings will be treated as previously taxed income from either the one-time transition tax or GILTI, or they will be offset with a 100% dividend received deduction. The income taxes applicable to repatriating such earnings are not readily determinable.
Uncertain tax positions
The amount of gross unrecognized tax benefits (“UTBs”) was $20.2 million and $13.7 million as of March 31, 2025 and 2024, respectively, all of which would favorably affect the Company’s effective tax rate if recognized in future periods.
77
The following is a tabular reconciliation of the total amounts of unrecognized tax benefits for the years ended March 31, 2025, 2024, and 2023 (in thousands):
| Fiscal Year Ended March 31, | |||||||||||||||||
| 2025 | 2024 | 2023 | |||||||||||||||
| Gross unrecognized tax benefit, beginning of year | $ | $ | $ | ||||||||||||||
| Gross increases to tax positions for the current period | |||||||||||||||||
| Gross increases to tax positions for prior periods | |||||||||||||||||
| Gross decreases to tax positions for prior periods | ( |
( |
|||||||||||||||
| Decreases related to settlements | ( |
( |
|||||||||||||||
| Decreases due to lapse of statutes of limitations | ( |
( |
( |
||||||||||||||
| Foreign currency translation | $ | $ | ( |
$ | ( |
||||||||||||
| Gross unrecognized tax benefit, end of year | $ | $ | $ | ||||||||||||||
As of March 31, 2025 and 2024, the net interest and penalties payable associated with uncertain tax positions was $0.9 million and $1.1 million, respectively. During the years ended March 31, 2025, 2024, and 2023, the Company recognized a benefit of $0.3 million, $1.4 million, and expense of $1.0 million, respectively, related to interest and penalties.
The Company files tax returns in U.S. federal, state, and foreign jurisdictions and the tax returns are subject to examination by various domestic and international tax authorities. As of March 31, 2025, the Company has open U.S. federal tax years back to fiscal year 2022. The Company also has open years in certain significant state jurisdictions back to fiscal year 2019, and foreign jurisdictions back to 2015. These open years contain matters that could be subject to differing interpretations of applicable tax laws and regulations due to the amount, timing or inclusion of revenue and expenses. It is reasonably possible that approximately $3.0 million of certain U.S. and foreign UTBs may be recognized within the next 12 months as a result of a lapse in the statute of limitations.
10. Accrued Expenses
Accrued expenses, current consists of the following (in thousands):
| March 31, | |||||||||||
| 2025 | 2024 | ||||||||||
| Accrued employee - related expenses | $ | $ | |||||||||
| Accrued tax liabilities | |||||||||||
Income taxes payable
|
|||||||||||
| Other | |||||||||||
| Total accrued expenses, current | $ | $ | |||||||||
11. Long-term Debt
On December 2, 2022, the Company entered into a Credit Agreement for a senior secured revolving credit facility (as amended to date, the “Credit Facility”) in an aggregate amount of $400.0 million. The Credit Facility has sublimits for swing line loans up to $30.0 million and for the issuance of standby letters of credit in a face amount up to $45.0 million. The Credit Facility will mature on December 2, 2027. As of March 31, 2025 and 2024, there were no 0.8 399.2
Borrowings under the Credit Facility are available in U.S. dollars, Euros, Pounds Sterling and Canadian dollars, with a sublimit of $100.0 million for non-U.S. dollar-denominated borrowings. Borrowings under the Credit Facility currently bear interest at (i) the Term Secured Overnight Financing Rate plus 0.10 %, (ii) the Adjusted Euro Interbank Offer Rate, (iii) the Canadian Overnight Repo Rate Average, (iv) the Base Rate, as defined per the Credit Facility, or (v) the Sterling Overnight Index Average, in each case plus an applicable margin as defined per the Credit Agreement. Interest payments are due quarterly, or more frequently, based on the terms of the Credit Facility.
The Company incurs fees with respect to the Credit Facility, including (i) a commitment fee ranging from 0.175 % to 0.35 % per annum, dependent on the Company’s leverage ratio, as defined per the Credit Facility, of the unused commitment under the Credit Facility; (ii) a fronting fee of 0.125 % per annum of the face amount of each letter of credit; (iii) a participation fee equal to the applicable margin, as defined per the Credit Facility, applied to the daily average face amount of letters of credit; and (iv) customary administrative fees.
78
Debt issuance costs of $1.9 million were incurred in connection with the Credit Facility. The debt issuance costs are included within “Other assets” in the consolidated balance sheets and are being amortized into interest expense over the contractual term of the Credit Facility. There were $1.0 million and $1.4 million of unamortized debt issuance costs as of March 31, 2025 and 2024, respectively.
Pursuant to the Credit Facility, obligations owed under the Credit Facility are secured by a first priority security interest on substantially all assets of Dynatrace LLC and other wholly owned subsidiaries of the Company, including a pledge of the capital stock and other equity interests of certain subsidiaries. Under certain circumstances, the guarantees may be released without action by, or consent of, the administrative agent of the Credit Facility. The Credit Facility contains customary affirmative and negative covenants, including financial covenants that require the Company to maintain specified financial ratios. At March 31, 2025, the Company was in compliance with all applicable covenants.
Former first lien credit facilities
The Company’s former First Lien Credit Agreement, as amended, provided for a term loan facility (the “First Lien Term Loan”) in an aggregate principal amount of $950.0 million and a senior secured revolving credit facility (the “Revolving Facility”) in an aggregate amount of $60.0 million. The Revolving Facility included a $25.0 million letter of credit sub-facility. Borrowings under the First Lien Term Loan and the Revolving Facility bore interest, at the Company’s election, at either (i) the Alternative Base Rate, as defined per the credit agreement, plus 1.25 % per annum, or (ii) LIBOR plus 2.25 % per annum. The maturity date on the First Lien Term Loan and Revolving Facility was August 23, 2025 and August 23, 2023, respectively, with payment due in full on the maturity date.
The incurred debt issuance costs and original issuance discount are recorded as a reduction of the debt balance in the consolidated balance sheets and were amortized into interest expense over the term of the loans. The Company recognized $1.4 million of amortization of debt issuance costs and original issuance discount for the year ended March 31, 2023, which is included in the accompanying consolidated statements of operations.
During the year ended March 31, 2023, the Company terminated the First Lien Credit Agreement and repaid all outstanding borrowings, including accrued interest. The Company recognized a loss on debt extinguishment of $5.9 million within “Interest income (expense), net” in the consolidated statements of operations for the year ended March 31, 2023.
Interest expense
For the years ended March 31, 2025, 2024, and 2023, the Company recognized $1.0 million, $1.4 million, and $8.6 million in interest expense and amortization of debt issuance costs and original issuance discount, respectively.
12. Leases
The Company leases office space under non-cancelable operating leases which expire at various dates from fiscal 2026 to 2035. As of March 31, 2025, the weighted average remaining lease term was 6.1 years and the weighted average discount rate was 4.2 %. The Company does not have any finance leases.
The following table presents information about leases on the consolidated statements of operations (in thousands):
| Fiscal Year Ended March 31, | ||||||||||||||||||||
| 2025 | 2024 | 2023 | ||||||||||||||||||
Operating lease expense (1)
|
$ | $ | $ | |||||||||||||||||
Short-term lease expense
|
$ | $ | $ | |||||||||||||||||
Variable lease expense
|
$ | $ | $ | |||||||||||||||||
_________________
(1) Presented gross of sublease income.
The following table presents supplemental cash flow information about the Company’s leases (in thousands):
| Fiscal Year Ended March 31, | ||||||||||||||||||||
| 2025 | 2024 | 2023 | ||||||||||||||||||
| Cash paid for amounts included in the measurement of lease liabilities | $ | $ | $ | |||||||||||||||||
| Operating lease assets obtained in exchange for new operating lease liabilities | $ | $ | $ | |||||||||||||||||
79
As of March 31, 2025, remaining maturities of lease liabilities were as follows (in thousands):
| Fiscal Years Ending March 31, | Amount | |||||||
| 2026 | $ | |||||||
| 2027 | ||||||||
| 2028 | ||||||||
| 2029 | ||||||||
| 2030 | ||||||||
| Thereafter | ||||||||
| Total operating lease payments | ||||||||
| Less: imputed interest | ( |
|||||||
| Total operating lease liabilities | $ | |||||||
13. Commitments and Contingencies
Legal matters
The Company is, from time to time, party to legal proceedings and subject to claims in the ordinary course of business. Although the outcome of legal proceedings and claims cannot be predicted with certainty, the Company currently believes that the resolution of any such matters will not have a material adverse effect on its business, operating results, financial condition, or cash flows.
Contractual commitments
The following table summarizes the Company’s contractual commitments as of March 31, 2025 (in thousands):
| Total | |||||
Operating lease payments (1)
|
$ | ||||
| Other commitments | |||||
| Total contractual commitments | $ | ||||
_________________
(1) Includes commitments for operating leases that have not yet commenced.
14. Shareholders’ Equity
Share Repurchase Program
In May 2024, the Company announced a share repurchase program for up to $500 million of common stock. The share repurchase program does not have a time limit, does not obligate the Company to acquire a specific number of shares, and may be suspended, modified, or terminated at any time, without prior notice. Repurchases may be made from time to time on the open market, pursuant to 10b5-1 trading plans, or by other legally permissible means.
80
15. Share-based Compensation
The following table summarizes the components of total share-based compensation expense included in the consolidated statements of operations for each period presented (in thousands):
| Fiscal Year Ended March 31, | |||||||||||||||||
| 2025 | 2024 | 2023 | |||||||||||||||
| Cost of revenue | $ | $ | $ | ||||||||||||||
| Research and development | |||||||||||||||||
| Sales and marketing | |||||||||||||||||
| General and administrative | |||||||||||||||||
| Total share-based compensation expense | $ | $ | $ | ||||||||||||||
The total income tax benefit recognized in the consolidated statements of operations for share-based compensation arrangements was $68.5 million, $64.1 million, and $38.1 million for the years ended March 31, 2025, 2024, and 2023, respectively.
Amended and Restated 2019 Equity Incentive Plan
In July 2019, the Company’s board of directors (the “Board”), upon the recommendation of the compensation committee of the Board, adopted the 2019 Equity Incentive Plan (the “2019 Plan”) which was subsequently approved by the Company’s stockholders and was later amended and restated by the Board in January 2021.
The Company initially reserved 52,000,000 shares of common stock for the issuance of awards under the 2019 Plan. The 2019 Plan provides that the number of shares reserved and available for issuance under the plan automatically increases each April 1 by 4 % of the outstanding number of shares of the Company’s common stock on the immediately preceding March 31 or such lesser number determined by the compensation committee. This number is subject to adjustment in the event of a stock split, stock dividend or other change in the Company’s capitalization. As of March 31, 2025, 56,719,444 shares of common stock were available for future issuance under the 2019 Plan.
The awards granted under the 2019 Plan have varying terms but generally vest over a - or four-year period, upon satisfaction of a service-based vesting condition, with 33 % and 25 % vesting one year three years for three-year and four-year grants, respectively. From time to time, the Company also grants performance-based and market-based awards to certain key employees that generally vest over a - or four-year period upon satisfaction of certain financial performance and relative total stockholder return performance targets established and approved by the Company’s Board for each fiscal year.
Stock options
The following table summarizes activity for stock options during the period ended March 31, 2025:
| Number of Options |
Weighted Average
Exercise Price
|
Weighted Average Remaining Contractual Term | Aggregate Intrinsic Value | ||||||||||||||||||||
| (in thousands) | (per share) | (years) | (in thousands) | ||||||||||||||||||||
| Balance, March 31, 2024 | $ | $ | |||||||||||||||||||||
| Exercised | ( |
||||||||||||||||||||||
| Forfeited or expired | ( |
||||||||||||||||||||||
| Balance, March 31, 2025 | $ | $ | |||||||||||||||||||||
| Options vested and expected to vest at March 31, 2025 | $ | $ | |||||||||||||||||||||
| Options vested and exercisable at March 31, 2025 | $ | $ | |||||||||||||||||||||
There were no 28.1 million, $46.1 million, and $37.9 million, respectively. The grant date fair value of options vested during fiscal 2025, 2024, and 2023 was $1.6 million, $9.1 million, and $16.7 million, respectively.
81
As of March 31, 2025, the total unrecognized compensation expense related to non-vested stock options was $0.1 million and is expected to be recognized over a weighted average period of 0.2 years.
Restricted shares and units
The following table provides a summary of the changes in the number of RSAs and RSUs for the year ended March 31, 2025:
Number of RSAs |
Weighted Average
Grant Date Fair Value
|
Number of RSUs |
Weighted Average
Grant Date Fair Value
|
||||||||||||||||||||
| (in thousands) | (per share) | (in thousands) | (per share) | ||||||||||||||||||||
| Balance, March 31, 2024 | $ | $ | |||||||||||||||||||||
| Granted | |||||||||||||||||||||||
| Vested | ( |
( |
|||||||||||||||||||||
| Forfeited | ( |
||||||||||||||||||||||
| Balance, March 31, 2025 | $ | $ | |||||||||||||||||||||
RSUs outstanding as of March 31, 2025 were comprised of 9.0 million RSUs with only service conditions and 1.0 million RSUs with both service and performance or market-based conditions (“PSUs”).
During the year ended March 31, 2025, the Company granted PSUs that contain financial performance conditions (the “Financial PSUs”) and PSUs based on relative total stockholder return performance (the “rTSR PSUs”). Both the Financial PSUs and rTSR PSUs are not earned if the applicable threshold percentage of the specific metric is not achieved. The maximum number of shares that may be earned is 200 % of the target award. The PSUs are also subject to time-based vesting and are contingent upon the employee remaining employed by the Company or one of its subsidiaries through the applicable vesting date.
The Financial PSUs generally vest 33 % one year after the grant date and the remaining 67 % vest ratably on a quarterly basis over the following two years . The number of shares that may be earned pursuant to the Financial PSUs is based on specific Company metrics related to the Company’s fiscal year ending March 31, 2025.
The rTSR PSUs generally vest 33 % annually after the grant date. The number of shares that may be earned pursuant to the rTSR PSUs is based on the Company’s stock price performance relative to companies that are the constituents of the Russell 3000 index over performance periods of one, two, and three fiscal years that began on April 1, 2024.
The Company estimated the fair value of rTSR PSUs on grant date using the Monte Carlo simulation model with the following assumptions:
| Fiscal Year Ended March 31, | |||||
| 2025 | |||||
| Expected dividend yield | |||||
| Expected volatility of the Company | |||||
| Average expected volatility of peer group | |||||
| Expected term (years) | |||||
| Risk-free interest rate | |||||
The Company has not paid and does not expect to pay dividends. Consequently, the Company uses an expected dividend yield of zero . The expected volatility of the Company is based on the historical volatility of the Company’s common stock and the average expected volatility of the peer group is based on the average historical volatility of the constituents of the Russell 3000 index. The computation of expected term is based upon the remaining term of each performance period upon grant date. The risk-free interest rate is based on the continuously compounded U.S. Treasury yield curve in effect at the time of grant that corresponds with the longest remaining performance period.
The weighted average grant-date fair value of RSUs granted during fiscal 2025, 2024, and 2023 was $48.27 , $51.60 , and $40.42 , respectively. The weighted average grant-date fair value of RSAs granted during fiscal 2024 was $49.05 . There were no
82
The aggregate fair value of RSAs vested during fiscal 2025, 2024, and 2023 was $2.7 million, $0.2 million, and $6.8 million, respectively. The aggregate fair value of RSUs vested during fiscal 2025, 2024, and 2023 was $266.7 million, $220.3 million, and $82.1 million, respectively.
As of March 31, 2025, the total unrecognized compensation expense related to unvested RSAs is $5.0 million and is to be recognized over a weighted average period of 1.9 years. As of March 31, 2025, the total unrecognized compensation expense related to unvested RSUs was $378.0 million and is expected to be recognized over a weighted average period of 2.0 years.
Employee Stock Purchase Plan
In July 2019, the Board adopted, and the Company’s stockholders approved, the 2019 Employee Stock Purchase Plan (“ESPP”). The Company offers, sells and issues shares of common stock under this ESPP from time to time based on various factors and conditions, although the Company is under no obligation to sell any shares under this ESPP. The ESPP provides that the number of shares reserved and available for issuance under the plan will automatically increase each April 1 by lesser of (i) 1 % of the outstanding number of shares of the Company’s common stock on the immediately preceding March 31, (ii) 3,500,000 shares of common stock, or (iii) such lesser number determined by the compensation committee. The ESPP provides for six-month offering periods and each offering period consists of six-month purchase periods. On each purchase date, eligible employees purchase shares of the Company’s common stock at a price per share equal to 85 % of the lesser of (1) the fair market value of the Company’s common stock on the offering date or (2) the fair market value of the Company’s common stock on the purchase date. For the year ended March 31, 2025, 531,301 shares of common stock were purchased under the ESPP. As of March 31, 2025, 18,303,111 shares of common stock were available for future issuance under the ESPP.
As of March 31, 2025, there was approximately $1.3 million of unrecognized share-based compensation related to the ESPP that is expected to be recognized over the remaining term of the current offering period.
The Company estimated the fair value of the ESPP purchase rights using a Black-Scholes option pricing model with the following assumptions:
| Fiscal Year Ended March 31, | |||||||||||||||||
| 2025 | 2024 | 2023 | |||||||||||||||
| Expected dividend yield | |||||||||||||||||
| Expected volatility | |||||||||||||||||
| Expected term (years) | |||||||||||||||||
| Risk-free interest rate | |||||||||||||||||
The Company has not paid and does not expect to pay dividends. Consequently, the Company uses an expected dividend yield of zero . Beginning in May 2022, the expected volatility is based on the historical volatility of the Company’s common stock. Prior to May 2022, the computation of expected volatility was based on a calculation using the historical volatility of a group of publicly traded peer companies. The computation of expected term was based on the offering period, which is six months . The risk-free interest rate is based on the U.S. Treasury yield curve that corresponds with the expected term at the time of grant.
16. Net Income Per Share
The following table sets forth the computation of basic and diluted net income per share (in thousands, except per share data):
| Fiscal Year Ended March 31, | |||||||||||||||||
| 2025 | 2024 | 2023 | |||||||||||||||
| Numerator: | |||||||||||||||||
| Net income | $ | $ | $ | ||||||||||||||
| Denominator: | |||||||||||||||||
| Weighted average shares outstanding, basic | |||||||||||||||||
| Dilutive effect of share-based awards | |||||||||||||||||
| Weighted average shares outstanding, diluted | |||||||||||||||||
| Net income per share, basic | $ | $ | $ | ||||||||||||||
| Net income per share, diluted | $ | $ | $ | ||||||||||||||
83
The effect of certain common share equivalents were excluded from the computation of weighted-average diluted shares outstanding for the years ended March 31, 2025, 2024, and 2023 as inclusion would have resulted in anti-dilution. A summary of these weighted-average anti-dilutive common share equivalents is provided in the table below (in thousands):
| Fiscal Year Ended March 31, | |||||||||||||||||
| 2025 | 2024 | 2023 | |||||||||||||||
| Stock options | |||||||||||||||||
| Unvested RSAs and RSUs | |||||||||||||||||
17. Employee Benefit Plan
The Company has established a 401(k) tax-deferred savings plan (the “401(k) Plan”), which permits participants to make contributions by salary deduction pursuant to Section 401(k) of the Internal Revenue Code. The Company is responsible for administrative costs of the 401(k) Plan and may, at its discretion, make matching contributions to the 401(k) Plan. In addition, the Company offers defined contribution plans to employees in certain countries outside the U.S and as of January 2024, a non-qualified deferred compensation plan to certain eligible employees. For the years ended March 31, 2025, 2024, and 2023, the Company made contributions of $7.9 million, $7.0 million and $6.3 million to the U.S. 401(k) Plan, respectively.
18. Segment and Geographic Information
The Company’s CODM is its Chief Executive Officer. The CODM uses consolidated net income for purposes of making operating decisions, assessing financial performance and allocating resources in the budget and forecasting process and budget-to-actual reviews. As such, the Company has determined that it operates as one
The CODM also utilizes expense information in order to assess the Company’s financial performance. The Company’s significant expenses and other segment items, as included in consolidated net income, are provided in the table below (in thousands):
| Fiscal Year Ended March 31, | |||||||||||||||||
| 2025 | 2024 | 2023 | |||||||||||||||
| Revenue | $ | $ | $ | ||||||||||||||
Adjusted cost of revenue(1)
|
|||||||||||||||||
Adjusted research and development expenses(1)
|
|||||||||||||||||
Adjusted sales and marketing expenses(1)
|
|||||||||||||||||
Adjusted general and administrative expenses(1)
|
|||||||||||||||||
| Share-based compensation and related employer payroll taxes | |||||||||||||||||
| Amortization of intangibles | |||||||||||||||||
Other segment items(2)
|
( |
( |
( |
||||||||||||||
| Segment net income | $ | $ | $ | ||||||||||||||
| Consolidated net income | $ | $ | $ | ||||||||||||||
(1) Excludes share-based compensation; employer payroll taxes on employee stock transactions; amortization of intangibles; and transaction, restructuring and other-non-recurring or unusual items, which are independently reviewed by the CODM.
(2) Other segment items primarily includes interest income (expense), net; other (expense) income, net; and income tax benefit (expense), as reported in the consolidated statements of operations. Other segment items also includes $0.2 million, $8.4 million, and $4.1 million of transaction, restructuring and other-non-recurring or unusual items for the years ended March 31, 2025, 2024, and 2023, respectively.
The measure of segment assets is the total assets as reported in the consolidated balance sheets.
Revenue
Revenues by geography are based on the region of the Company’s contracting entity. Refer to Note 3, Revenue Recognition, for a disaggregation of revenue by geographic region.
84
Long-lived assets, net
The following table presents the Company’s net long-lived assets, which consists of property and equipment, net, and operating lease right-of-use asset, net, by geographic region for the periods presented (in thousands):
| March 31, | |||||||||||
| 2025 | 2024 | ||||||||||
| North America | $ | $ | |||||||||
| Europe, Middle East and Africa | |||||||||||
| Asia Pacific | |||||||||||
| Latin America | |||||||||||
| Total long-lived assets, net | $ | $ | |||||||||
85
ITEM 9. CHANGES IN AND DISAGREEMENTS WITH ACCOUNTANTS ON ACCOUNTING AND FINANCIAL DISCLOSURE
None.
ITEM 9A. CONTROLS AND PROCEDURES
Evaluation of Disclosure Controls and Procedures
Our management, including our Chief Executive Officer and Chief Financial Officer, have evaluated the effectiveness of our disclosure controls and procedures (as defined in Rules 13a-15(e) and 15d-15(e) under the Exchange Act) as of the end of the period covered by this Annual Report. Based on such evaluation, our Chief Executive Officer and Chief Financial Officer have concluded that our disclosure controls and procedures, as of March 31, 2025, were effective and provided reasonable assurance that the information required to be disclosed in the reports that we file or submit under the Exchange Act is recorded, processed, summarized, and reported within the time periods specified in the SEC’s rules and forms, and that such information is accumulated and communicated to management as appropriate to allow timely decisions regarding required disclosure.
Management’s Annual Report on Internal Control Over Financial Reporting
Our management is responsible for establishing and maintaining adequate internal control over financial reporting as defined in Rules 13a-15(f) and 15d-15(f) under the Exchange Act. This system is designed to provide reasonable assurance regarding the reliability of financial reporting and the preparation of consolidated financial statements for external purposes in accordance with GAAP.
Our management performed an assessment of the effectiveness of our internal control over financial reporting at March 31, 2025, utilizing the criteria discussed in the “Internal Control – Integrated Framework (2013)” issued by the Committee of Sponsoring Organizations of the Treadway Commission. The objective of this assessment was to determine whether our internal control over financial reporting was effective as of March 31, 2025.
Based on management’s assessment, we have concluded that our internal control over financial reporting was effective as of March 31, 2025.
The effectiveness of our internal control over financial reporting as of March 31, 2025 has been audited by Ernst & Young LLP, an independent registered public accounting firm, as stated in its attestation report on the internal control over our financial reporting which is included herein.
Changes in Internal Control Over Financial Reporting
There were no changes to our internal control over financial reporting (as defined in Rules 13a‑15(f) and 15d‑15(f) under the Exchange Act) during the quarter ended March 31, 2025 that have materially affected, or are reasonably likely to materially affect, our internal control over financial reporting.
Inherent Limitations on Effectiveness of Controls
Our management, including our Chief Executive Officer and Chief Financial Officer, does not expect that our disclosure controls and procedures or our internal control over financial reporting will prevent or detect all errors and all fraud. A control system, no matter how well designed and operated, can provide only reasonable, not absolute, assurance that the objectives of the control system are met. Further, the design of a control system must reflect the fact that there are resource constraints, and the benefits of controls must be considered relative to their costs. Because of the inherent limitation in all control systems, no evaluation of controls can provide absolute assurance that all control issues and instances of fraud, if any, within our company have been detected. These inherent limitations include the realities that judgments in decision-making can be faulty, and that breakdowns can occur because of a simple error or mistake. Additionally, controls can be circumvented by the individual acts of some persons, by collusion of two or more people or by management override of the controls. The design of any system of controls is also based in part upon certain assumptions about the likelihood of future events, and there can be no assurance that any design will succeed in achieving its stated goals under all potential future conditions; over time, controls may become inadequate because of changes in conditions, or the degree of compliance with policies or procedures may deteriorate. Due to inherent limitations in a cost-effective control system, misstatements due to error or fraud may occur and not be detected.
86
Report of Independent Registered Public Accounting Firm
To the Shareholders and the Board of Directors of Dynatrace, Inc.
Opinion on Internal Control over Financial Reporting
We have audited Dynatrace, Inc.’s internal control over financial reporting as of March 31, 2025, based on criteria established in Internal Control—Integrated Framework issued by the Committee of Sponsoring Organizations of the Treadway Commission (2013 framework) (the COSO criteria). In our opinion, Dynatrace, Inc. (the Company) maintained, in all material respects, effective internal control over financial reporting as of March 31, 2025, based on the COSO criteria.
We also have audited, in accordance with the standards of the Public Company Accounting Oversight Board (United States) (PCAOB), the consolidated balance sheets of the Company as of March 31, 2025 and 2024, the related consolidated statements of operations, comprehensive income, shareholders’ equity and cash flows for each of the three years in the period ended March 31, 2025, and the related notes and our report dated May 22, 2025 expressed an unqualified opinion thereon.
Basis for Opinion
The Company’s management is responsible for maintaining effective internal control over financial reporting and for its assessment of the effectiveness of internal control over financial reporting included in the accompanying Management’s Annual Report on Internal Control Over Financial Reporting. Our responsibility is to express an opinion on the Company’s internal control over financial reporting based on our audit. We are a public accounting firm registered with the PCAOB and are required to be independent with respect to the Company in accordance with the U.S. federal securities laws and the applicable rules and regulations of the Securities and Exchange Commission and the PCAOB.
We conducted our audit in accordance with the standards of the PCAOB. Those standards require that we plan and perform the audit to obtain reasonable assurance about whether effective internal control over financial reporting was maintained in all material respects.
Our audit included obtaining an understanding of internal control over financial reporting, assessing the risk that a material weakness exists, testing and evaluating the design and operating effectiveness of internal control based on the assessed risk, and performing such other procedures as we considered necessary in the circumstances. We believe that our audit provides a reasonable basis for our opinion.
Definition and Limitations of Internal Control over Financial Reporting
A company’s internal control over financial reporting is a process designed to provide reasonable assurance regarding the reliability of financial reporting and the preparation of financial statements for external purposes in accordance with generally accepted accounting principles. A company’s internal control over financial reporting includes those policies and procedures that (1) pertain to the maintenance of records that, in reasonable detail, accurately and fairly reflect the transactions and dispositions of the assets of the company; (2) provide reasonable assurance that transactions are recorded as necessary to permit preparation of financial statements in accordance with generally accepted accounting principles, and that receipts and expenditures of the company are being made only in accordance with authorizations of management and directors of the company; and (3) provide reasonable assurance regarding prevention or timely detection of unauthorized acquisition, use, or disposition of the company’s assets that could have a material effect on the financial statements.
Because of its inherent limitations, internal control over financial reporting may not prevent or detect misstatements. Also, projections of any evaluation of effectiveness to future periods are subject to the risk that controls may become inadequate because of changes in conditions, or that the degree of compliance with the policies or procedures may deteriorate.
/s/ Ernst & Young LLP
Detroit, Michigan
May 22, 2025
87
ITEM 9B. OTHER INFORMATION
During the three months ended March 31, 2025, none of the Company’s directors or officers (as defined in Rule 16a-1(f) of the Exchange Act) adopted , modified or terminated
On February 19, 2025 , Stephen Lifshatz , a director of the Company, adopted a Rule 10b5-1 trading arrangement that contemplates the sale of up to 10,000 shares of the Company’s common stock previously issued to him after the vesting of RSUs. The duration of the trading arrangement is from May 26, 2025 through May 19, 2026 (or earlier, if all transactions under the trading arrangement are completed).
ITEM 9C. DISCLOSURE REGARDING FOREIGN JURISDICTIONS THAT PREVENT INSPECTIONS
None.
PART III
ITEM 10. DIRECTORS, EXECUTIVE OFFICERS AND CORPORATE GOVERNANCE
Code of Business Conduct and Ethics
We have adopted a written Code of Business Conduct and Ethics that applies to our directors, officers, and employees, including our principal executive officer, principal financial officer, principal accounting officer and controller, and persons performing similar functions. We intend to disclose any amendment or waiver of a provision of the Code of Business Conduct and Ethics that applies to our principal executive officer, principal financial officer, principal accounting officer and controller or persons performing similar functions, by posting such information on our website available at http://ir.dynatrace.com and/or in our public filings with the SEC. To date, there have been no waivers granted under the Code of Business Conduct and Ethics to our directors, principal executive officer, principal financial officer, principal accounting officer and controller, and persons performing similar functions. We also have a human rights policy and a supplier code of conduct. The Code of Business Conduct and Ethics and these other policies are available at www.dynatrace.com/company/sustainability/.
Insider Trading Policies and Procedures
We have adopted an insider trading policy and related Rule 10b5-1 trading plan policy, which we believe are reasonably designed to promote compliance with applicable insider trading laws, rules, regulations, and NYSE listing standards. It is also our company’s policy to comply with applicable insider trading laws, rules, and regulations, and NYSE listing standards when engaging in transactions in company securities.
Our insider trading policy prohibits our officers, directors, employees, designated consultants, and their affiliated persons from trading in company securities while in possession of material nonpublic information about the company. The policy also prohibits tipping (i.e., disclosing material nonpublic information about our company to others who may trade of the basis of that information).
Under our insider trading policy, designated insiders may only trade in company securities during open trading windows at a time when they do not possess material nonpublic information about our company. We also require our executive officers, directors, and certain other employees to receive approval before trading in company securities.
Our insider trading policy also expressly prohibits short sales; purchases or sales of puts, calls, or other derivative securities or hedging transactions; using company securities as collateral in a margin account; or pledging company securities as collateral for a loan.
Any waiver of the provisions of this policy requires the approval of our Audit Committee. To date, no such requests have been made or approved.
We have adopted an additional policy that governs adoption, modification, and termination of written securities trading plans, known as Rule 10b5-1 plans, by our directors, executive officers, and certain other persons (“Covered Persons”). These plans are intended to take advantage of a safe harbor provided under SEC rules from liability for violating federal antifraud prohibitions that proscribe certain insider trading, including Section 10(b) of the Exchange Act. A qualifying Rule 10b5-1 plan may only be entered into when the individual is not in possession of material nonpublic information about the company and must authorize a broker to buy or sell shares of our common stock on a periodic basis pursuant to parameters established by the Covered Person when entering into the plan, without further direction from them. A Covered Person may amend or terminate a Rule 10b5-1 plan in certain circumstances. Our policy provides that all Rule 10b5-1 plans must comply with SEC rules applicable to the Rule 10b5-1 safe harbor and provides
88
additional requirements and limitations. A Covered Person also may buy or sell additional shares outside of a Rule 10b5-1 plan when they are not in possession of material nonpublic information, subject to compliance with the terms of our insider trading policy.
A copy of our insider trading policy and related Rule 10b5-1 trading plan policy has been filed as Exhibit 19.1 to this Annual Report.
The remaining information called for by this item will be set forth in our definitive Proxy Statement for the 2025 Annual Meeting of Stockholders to be filed with the SEC within 120 days of the fiscal year ended March 31, 2025 and is incorporated herein by reference.
ITEM 11. EXECUTIVE COMPENSATION
The information called for by this item will be set forth in our definitive Proxy Statement for the 2025 Annual Meeting of Stockholders to be filed with the SEC within 120 days of the fiscal year ended March 31, 2025 and is incorporated herein by reference.
ITEM 12. SECURITY OWNERSHIP OF CERTAIN BENEFICIAL OWNERS AND MANAGEMENT AND RELATED STOCKHOLDER MATTERS
The information called for by this item will be set forth in our definitive Proxy Statement for the 2025 Annual Meeting of Stockholders to be filed with the SEC within 120 days of the fiscal year ended March 31, 2025 and is incorporated herein by reference.
ITEM 13. CERTAIN RELATIONSHIPS AND RELATED PARTY TRANSACTIONS, AND DIRECTOR INDEPENDENCE
The information called for by this item will be set forth in our definitive Proxy Statement for the 2025 Annual Meeting of Stockholders to be filed with the SEC within 120 days of the fiscal year ended March 31, 2025 and is incorporated herein by reference.
ITEM 14. PRINCIPAL ACCOUNTING FEES AND SERVICES
The information called for by this item will be set forth in our definitive Proxy Statement for the 2025 Annual Meeting of Stockholders to be filed with the SEC within 120 days of the fiscal year ended March 31, 2025 and is incorporated herein by reference.
Our independent public accounting firm is Ernst & Young, LLP , Detroit, MI , PCAOB Auditor ID #42 .
89
PART IV
ITEM 15. EXHIBITS AND FINANCIAL STATEMENT SCHEDULES
(a) Listing of Documents
1.Financial Statements
The following financial statements are included in Part II, Item 8 of this Form 10-K:
Reports of Independent Registered Public Accounting Firm
CONSOLIDATED BALANCE SHEETS
CONSOLIDATED STATEMENTS OF OPERATIONS
CONSOLIDATED STATEMENTS OF COMPREHENSIVE INCOME
CONSOLIDATED STATEMENTS OF SHAREHOLDERS’ EQUITY
CONSOLIDATED STATEMENTS OF CASH FLOWS
2.Financial Statement Schedules
All other schedules have been omitted because they are not required, not applicable, or the required information is otherwise included.
3.Exhibits
The documents listed in the Exhibit Index of this report are incorporated by reference or are filed with this report, in each case as indicated therein (numbered in accordance with Item 601 of Regulation S-K).
EXHIBIT INDEX
|
Exhibit
Number
|
Description | |||||||
| 3.1 | ||||||||
| 3.2 | ||||||||
| 3.3 | ||||||||
| 4.1 | ||||||||
| 4.2 | ||||||||
| 4.3 | ||||||||
| 10.1# | ||||||||
| 10.2# | ||||||||
| 10.3# | ||||||||
| 10.4# | ||||||||
| 10.5# | ||||||||
| 10.6# | ||||||||
| 10.7# | ||||||||
| 10.8# | ||||||||
| 10.9# | ||||||||
| 10.10# | ||||||||
| 10.11# | ||||||||
90
91
| 31.1* | ||||||||
| 31.2* | ||||||||
| 32.1** | ||||||||
| 97.1 | ||||||||
| 101.INS | XBRL Instance Document - the instance document does not appear in the Interactive Data File because its XBRL tags are embedded within the Inline XBRL Document. | |||||||
| 101.SCH | Inline XBRL Taxonomy Extension Schema Document. | |||||||
| 101.CAL | Inline XBRL Taxonomy Extension Calculation Linkbase Document. | |||||||
| 101.DEF | Inline XBRL Taxonomy Extension Definition Linkbase Document. | |||||||
| 101.LAB | Inline XBRL Taxonomy Extension Label Linkbase Document. | |||||||
| 101.PRE | Inline XBRL Taxonomy Extension Presentation Linkbase Document. | |||||||
| 104 | Cover Page Interactive Data File - the cover page interactive data file does not appear in the Interactive Data File because its XBRL tags are embedded within the Inline XBRL document. | |||||||
_________________
# Indicates a management contract or any compensatory plan, contract or arrangement.
* Filed herewith.
** The certifications furnished in Exhibit 32.1 hereto are deemed to accompany this Annual Report on Form 10-K and will not be deemed “filed” for purposes of Section 18 of the Securities Exchange Act of 1934, as amended, except to the extent that the Registrant specifically incorporates it by reference. Such certifications will not be deemed to be incorporated by reference into any filings under the Securities Act of 1933, as amended, or the Securities Exchange Act of 1934, as amended, except to the extent that the Registrant specifically incorporates it by reference.
ITEM 16. FORM 10-K SUMMARY
Not applicable.
92
SIGNATURES
Pursuant to the requirements of Section 13 or 15(d) of the Securities Exchange Act of 1934, as amended, the Registrant has duly caused this report to be signed on its behalf by the undersigned, thereunto duly authorized.
| DYNATRACE, INC. | |||||||||||||||||
| Date: | May 22, 2025 | By: | /s/ Rick McConnell | ||||||||||||||
| Rick McConnell | |||||||||||||||||
| Chief Executive Officer | |||||||||||||||||
| (Principal Executive Officer) | |||||||||||||||||
POWER OF ATTORNEY
KNOW ALL PERSONS BY THESE PRESENTS, that each person whose signature appears below hereby constitutes and appoints each of Rick McConnell, James Benson and Nicole Fitzpatrick as such person’s true and lawful attorney-in-fact and agent with full power of substitution and resubstitution, for such person in such person’s name, place and stead, in any and all capacities, to sign any and all amendments to this Annual Report on Form 10-K, and to file the same, with all exhibits thereto, and other documents in connection therewith, with the Securities and Exchange Commission, granting unto said attorney-in-fact, proxy, and agent full power and authority to do and perform each and every act and thing requisite and necessary to be done in connection therewith, as fully to all intents and purposes as such person might or could do in person, hereby ratifying and confirming all that said attorney-in-fact, proxy and agent, or any substitute or substitutes of any of them, may lawfully do or cause to be done by virtue hereof.
Pursuant to the requirements of the Securities Exchange Act of 1934, as amended, this report has been signed below by the following persons on behalf of the Registrant and in the capacities and on the dates indicated.
| Signature | Title | Date | ||||||||||||
| /s/ Rick McConnell |
Chief Executive Officer and Director
(Principal Executive Officer)
|
May 22, 2025 | ||||||||||||
| Rick McConnell | ||||||||||||||
| /s/ James Benson | Chief Financial Officer and Treasurer (Principal Financial Officer) |
May 22, 2025 | ||||||||||||
| James Benson | ||||||||||||||
| /s/ Daniel Yates | Chief Accounting Officer (Principal Accounting Officer) |
May 22, 2025 | ||||||||||||
| Daniel Yates | ||||||||||||||
| /s/ Jill Ward | Director, Board Chair | May 22, 2025 | ||||||||||||
| Jill Ward | ||||||||||||||
| /s/ Lisa Campbell | Director | May 22, 2025 | ||||||||||||
| Lisa Campbell | ||||||||||||||
| /s/ Michael Capone | Director | May 22, 2025 | ||||||||||||
| Michael Capone | ||||||||||||||
| /s/ Amol Kulkarni | Director | May 22, 2025 | ||||||||||||
| Amol Kulkarni | ||||||||||||||
| /s/ Stephen Lifshatz | Director | May 22, 2025 | ||||||||||||
| Stephen Lifshatz | ||||||||||||||
| /s/ Steve Rowland | Director | May 22, 2025 | ||||||||||||
| Steve Rowland | ||||||||||||||
| /s/ Kirsten Wolberg | Director | May 22, 2025 | ||||||||||||
| Kirsten Wolberg | ||||||||||||||
93