DRS/A: Draft registration statement submitted by Emerging Growth Company under Securities Act Section 6(e) or by Foreign Private Issuer under Division of Corporation Finance policy
Published on May 31, 2019
Table of Contents
As confidentially submitted to the Securities and Exchange Commission on May 31, 2019. This Amendment No. 2 to the draft registration statement has not been filed publicly with the Securities and Exchange Commission and all information herein remains strictly confidential.
Registration No. 333-
UNITED STATES
SECURITIES AND EXCHANGE COMMISSION
Washington, D.C. 20549
Form S-1
REGISTRATION STATEMENT
UNDER
THE SECURITIES ACT OF 1933
Dynatrace Holdings LLC
(Exact name of registrant as specified in its charter)
| Delaware | 7372 | 47-2386428 | ||
|
(State or other jurisdiction of incorporation or organization) |
(Primary Standard Industrial Classification Code Number) |
(I.R.S. Employer Identification No.) |
1601 Trapelo Road, Suite 116
Waltham, MA 02451
(781) 530-1000
(Address, including zip code, and telephone number, including area code, of registrants principal executive offices)
Craig Newfield
General Counsel
Dynatrace LLC
1601 Trapelo Road, Suite 116
Waltham, MA 02451
(781) 530-1000
(Name, address, including zip code, and telephone number, including area code, of agent for service)
Copies to:
| Kenneth J. Gordon Joseph C. Theis, Jr. Goodwin Procter LLP 100 Northern Avenue Boston, MA 02210 (617) 570-1000 |
Bradley C. Reed, P.C. Michael P. Keeley Kirkland & Ellis LLP 300 North LaSalle Chicago, IL 60654 (312) 862-2000 |
Mark G. Borden David A. Westenberg Wilmer Cutler Pickering Hale and Dorr LLP 60 State Street Boston, MA 02019 (617) 526-6000 |
Approximate date of commencement of proposed sale of the securities to the public:
As soon as practicable after the effective date of this Registration Statement.
If any of the securities being registered on this Form are to be offered on a delayed or continuous basis pursuant to Rule 415 under the Securities Act of 1933, check the following box: ☐
If this Form is filed to register additional securities for an offering pursuant to Rule 462(b) under the Securities Act, check the following box and list the Securities Act registration statement number of the earlier effective registration statement for the same offering. ☐
If this Form is a post-effective amendment filed pursuant to Rule 462(c) under the Securities Act, check the following box and list the Securities Act registration statement number of the earlier effective registration statement for the same offering. ☐
If this Form is a post-effective amendment filed pursuant to Rule 462(d) under the Securities Act, check the following box and list the Securities Act registration statement number of the earlier effective registration statement for the same offering. ☐
Indicate by check mark whether the registrant is a large accelerated filer, an accelerated filer, a non-accelerated filer, smaller reporting company, or an emerging growth company. See the definitions of large accelerated filer, accelerated filer, smaller reporting company, and emerging growth company in Rule 12b-2 of the Exchange Act.
| Large accelerated filer ☐ | Accelerated filer ☐ | Non-accelerated filer ☒ | Smaller reporting company ☐ | Emerging growth company ☒ |
If an emerging growth company, indicate by check mark if the registrant has elected not to use the extended transition period for complying with any new or revised financial accounting standards provided pursuant to Section 7(a)(2)(B) of the Securities Act. ☐
CALCULATION OF REGISTRATION FEE
|
|
||||
| Title of Each Class of Securities to be Registered |
Proposed Maximum Aggregate Offering Price(1)(2) |
Amount of Registration Fee(3) |
||
| Common stock, $ par value per share |
$ | $ | ||
|
|
||||
|
|
||||
| (1) | Estimated solely for the purpose of calculating the registration fee pursuant to Rule 457(o) under the Securities Act of 1933, as amended. |
| (2) | Includes the aggregate offering price of additional shares that the underwriters have the option to purchase to cover over-allotments. |
| (3) | Calculated pursuant to Rule 457(o) based on the estimate of the proposed maximum aggregate offering price. |
The registrant hereby amends this registration statement on such date or dates as may be necessary to delay its effective date until the registrant shall file a further amendment that specifically states that this registration statement shall thereafter become effective in accordance with Section 8(a) of the Securities Act of 1933, as amended, or until this registration statement shall become effective on such date as the Securities and Exchange Commission, acting pursuant to said Section 8(a), may determine.
Table of Contents
EXPLANATORY NOTE
Dynatrace Holdings LLC, the registrant whose name appears on the cover of this registration statement, is a Delaware limited liability company and indirect equityholder of Dynatrace Holding Corp. Dynatrace LLC is a wholly owned subsidiary of Dynatrace Holding Corp. Immediately prior to the effectiveness of this registration statement, Dynatrace Holdings LLC will (i) through a series of corporate reorganization steps, become the parent company of Dynatrace Holding Corp. and (ii) immediately thereafter, convert into a Delaware corporation with the name Dynatrace, Inc. As a result of those transactions, each of Dynatrace Holding Corp. and Dynatrace LLC will be a wholly owned indirect subsidiary of Dynatrace, Inc., and the unit holders of Dynatrace Holdings LLC will become holders of shares of common stock of Dynatrace, Inc.
Except as disclosed in the prospectus, the consolidated financial statements and selected historical consolidated financial data and other financial information included in this registration statement are those of Dynatrace, Inc. and its subsidiaries after giving effect to the transactions described above. Shares of common stock of Dynatrace, Inc. are being offered by the prospectus included in this registration statement.
Table of Contents
The information in this prospectus is not complete and may be changed. We may not sell these securities until the registration statement filed with the Securities and Exchange Commission is effective. This prospectus is not an offer to sell these securities and it is not soliciting an offer to buy these securities in any jurisdiction where the offer or sale is not permitted.
Subject To Completion. Dated , 2019.
Shares

Common Stock
This is an initial public offering of common stock of Dynatrace, Inc.
Prior to this offering, there has been no public market for the common stock. It is currently estimated that the initial public offering price per share will be between $ and $ . We intend to apply to list our common stock on the New York Stock Exchange under the symbol DT.
Upon completion of this offering, affiliates of Thoma Bravo, LLC will own approximately % of our issued and outstanding shares of common stock (or % of our issued and outstanding shares of common stock if the underwriters option to purchase additional shares is exercised in full). As a result, we will be a controlled company as defined under the New York Stock Exchange listing rules. See ManagementStatus as a Controlled Company.
We are an emerging growth company as defined under the federal securities laws, and as such, we have elected to comply with certain reduced public company reporting requirements for this prospectus and may elect to comply with reduced public company reporting requirements in future filings.
See Risk Factors beginning on page 19 to read about factors you should consider before buying shares of our common stock.
Neither the Securities and Exchange Commission nor any state securities commission or other regulatory body has approved or disapproved of these securities or passed upon the accuracy or adequacy of this prospectus. Any representation to the contrary is a criminal offense.
| Per share | Total | |||||||
| Initial Public Offering Price |
||||||||
| Underwriting discount(1) |
||||||||
| Proceeds, before expenses, to Dynatrace, Inc. |
||||||||
| (1) | See the section titled Underwriting beginning on page 154 for a description of the compensation payable to the underwriters. |
To the extent the underwriters sell more than shares of common stock, the underwriters will have the option to purchase up to an additional shares from us at the initial price to the public less the underwriting discount.
The underwriters expect to deliver the shares against payment in New York, New York on , 2019.
| Goldman Sachs & Co. LLC | J.P. Morgan | Citigroup |
| Barclays | Jefferies | RBC Capital Markets | UBS Investment Bank |
| KeyBanc Capital Markets | William Blair | Canaccord Genuity | JMP Securities | Macquarie Capital | Piper Jaffray |
Prospectus dated , 2019
Table of Contents
| Page | ||||
| 1 | ||||
| 19 | ||||
| 52 | ||||
| 55 | ||||
| 56 | ||||
| 57 | ||||
| 59 | ||||
| 61 | ||||
| 64 | ||||
| Managements Discussion and Analysis of Financial Condition and Operating Results |
67 | |||
| 95 | ||||
| 112 | ||||
| 119 | ||||
| 126 | ||||
| 131 | ||||
| 134 | ||||
| 136 | ||||
| 141 | ||||
| 147 | ||||
| Material U.S. Federal Income Tax Considerations for Non-U.S. Holders of Our Common Stock |
149 | |||
| 154 | ||||
| 159 | ||||
| 159 | ||||
| 159 | ||||
| F-1 | ||||
Through and including , 2019 (the 25th day after the date of this prospectus), all dealers effecting transactions in these securities, whether or not participating in this offering, may be required to deliver a prospectus. This is in addition to a dealers obligation to deliver a prospectus when acting as an underwriter and with respect to an unsold allotment or subscription.
Neither we nor the underwriters have authorized anyone to provide any information or make any representations other than the information contained in this prospectus or in any free writing prospectus prepared by or on behalf of us or to which we have referred you. We and the underwriters take no responsibility for, and can provide no assurance as to the reliability of, any other information that others may give you. If anyone provides you with different or inconsistent information, you should not rely on it.
We are offering to sell, and seeking offers to buy, shares of our common stock only in jurisdictions where offers and sales are permitted. The information contained in this prospectus is accurate only as of the date of this prospectus, regardless of the time of delivery of this prospectus or of any sale of our common stock. Our business, financial condition, results of operations and prospects may have changed since that date.
For investors outside of the United States: neither we nor the underwriters have done anything that would permit this offering or possession or distribution of this prospectus in any jurisdiction where
i
Table of Contents
action for that purpose is required, other than in the United States. You are required to inform yourselves about and to observe any restrictions relating to this offering and the distribution of this prospectus outside of the United States.
Unless the context otherwise requires, the terms Dynatrace, the Company, we, us and our in this prospectus refer to Dynatrace, Inc. and its consolidated subsidiaries after giving effect to the Spin-Off Transactions described herein. The term Thoma Bravo Funds refers to Thoma Bravo Fund X, L.P., Thoma Bravo Fund X-A, L.P., Thoma Bravo Fund XI, L.P., Thoma Bravo Fund XI-A, L.P., Thoma Bravo Executive Fund XI, L.P., Thoma Bravo Special Opportunities Fund I, L.P. and Thoma Bravo Special Opportunities Fund I AIV, L.P., and the term Thoma Bravo refers to Thoma Bravo, LLC, the management company and ultimate general partner of the Thoma Bravo Funds, and, unless the context otherwise requires, its affiliated entities. The term Dynatrace® refers to our Software Intelligence Platform.
ii
Table of Contents
This summary highlights selected information that is presented in greater detail elsewhere in this prospectus. This summary does not contain all of the information you should consider before investing in our common stock. You should read this entire prospectus carefully, including the sections titled Risk Factors and Managements Discussion and Analysis of Financial Condition and Results of Operations and our consolidated financial statements and the related notes included elsewhere in this prospectus, before making an investment decision.
DYNATRACE, INC.
Overview
We offer the market-leading software intelligence platform, purpose-built for the enterprise cloud. As enterprises embrace the cloud to effect their digital transformation, our all-in-one intelligence platform is designed to address the growing complexity faced by technology and digital business teams. Our platform utilizes artificial intelligence at its core and advanced automation to provide answers, not just data, about the performance of applications, the underlying hybrid cloud infrastructure, and the experience of our customers users. We designed our software intelligence platform to allow our customers to modernize and automate IT operations, develop and release high quality software faster, and improve user experiences for better business outcomes. As a result, as of March 31, 2019, our products are trusted by more than 2,300 customers in over 70 countries in diverse industries such as banking, insurance, retail, manufacturing, travel and software. Representative customers include Lloyds TSB, The Western Union Company, American Fidelity Assurance Company, The Kroger Co., Daimler AG, Air Canada, SAP SE and Autodesk, Inc.
Todays leading companies are striving to deliver innovative, high performance digital services that expand market opportunities, to compete more effectively, and to operate with increased agility. Software is increasingly central to how enterprises seek to accomplish these goals. Applications sit at the core of this software revolution and are central to the digital transformation of these enterprisesfrom the mission critical enterprise applications that power factories, enable trading, manage transportation networks, and run business systems to the applications that consumers use every day to bank, shop, entertain, travel, and more.
Developing and operating software is harder than ever, largely driven by:
| 1) | Cloud Transformation: Enterprises are building and deploying software across multiple public and on-premise platforms, creating significant visibility challenges across all of an enterprises hosted environments. |
| 2) | Application Complexity: Applications are increasingly complex and deployed as microservices-based architectures that are written in multiple different programming languages with hundreds of loosely coupled service connections. The scale of this complexity is heightened by the advent of the Internet of Things, which increases the number of potential sources of application failure. |
| 3) | DevOps: Ensuring that software updates work without issues has grown more challenging due to the increased frequency of software releases, reduced testing time, and the use of independent development teams. |
| 4) | User Experience: User expectations for software performance have rapidly increased and enterprises are focused on advancing branded experiences to maximize revenue, differentiate offerings, and retain competitive positions. |
1
Table of Contents
Traditional approaches for developing, operating, and monitoring software were not designed for the enterprise cloud environment. Traditional monitoring solutions were developed in an era in which applications were monolithic, updated infrequently, and run in static data center environments. These monitoring solutions, including application performance monitoring, or APM, infrastructure monitoring, incident and alert management, and user experience monitoring, are difficult to deploy, narrow in scope, and were designed to operate in a simpler, siloed environment. Each tool in this approach only collects data about individual components of the computing stack, such as applications, infrastructures, logs, networks, or user experiences. In order to get an end-to-end view using these traditional approaches, IT teams are required to aggregate and correlate data from these disparate monitoring solutions in an attempt to identify actionable answers, including where bottlenecks occur, how best to optimize for performance and scalability, if an issue is impacting service, and if so, where to find the problem and what to do about it.
With the advent of the enterprise cloud, the challenges and limitations of traditional solutions have been exacerbated. What was once a well understood layering of applications running on operating systems on physical servers connected to physical networks has rapidly become virtualized into software at all levels. Environments have become dynamic. Applications are no longer monolithic and are fragmented into dozens to potentially thousands of microservices, written in multiple software languages. These enterprise cloud environments sprawl from traditional backend applications run on relational databases and mainframes to modern IaaS platforms run on Amazon Web Services, or AWS, Microsoft Azure, or Azure, and Google Cloud Platform. All these factors result in an environment that is web-scale, extremely complex, and dynamic at all layers of the new computing stack.
We believe the scale, complexity, and dynamic nature of this emerging enterprise cloud environment, including the applications that run on it, require a comprehensive monitoring strategy that we refer to as software intelligence. Starting in 2014, we leveraged the knowledge and experience of the same engineering team that founded Dynatrace to develop a solution to address the disruptive shift to the enterprise cloud. These efforts resulted in the creation of a new platform, the Dynatrace Software Intelligence Platform, or Dynatrace®. Dynatrace® leverages an automatic instrumentation technology that we call OneAgent®, a real-time dependency mapping system we call SmartScape®, our transaction-centric code analysis technology that we call PurePath®, and an open artificial intelligence, or AI, engine that we call DavisTM for instant answers to degradations in service, anomalies in behavior, and user impact. Dynatrace® simplifies the complexity of the enterprise cloud for cloud architects, application teams and operations teams, while providing actionable insights that accelerate cloud migrations, cloud adoption, and DevOps success.
Unlike traditional multi-tool approaches, Dynatrace® has been integrated with key components of the enterprise cloud ecosystem to support dynamic cloud orchestration, including for AWS, Azure, Google Cloud Platform, Pivotal Cloud Foundry, Red Hat OpenShift, and Kubernetes. In these environments, Dynatrace® automatically launches and monitors the full cloud stack and all the applications and containers running anywhere in the stack, including applications and workloads that may traverse multiple cloud and hybrid environments. We believe that our ability to integrate Dynatrace® with cloud platforms simplifies development and operational efforts, increases visibility, and improves situational awareness for our customers.
We designed Dynatrace® to maximize flexibility and control of the rich monitoring data captured and analyzed by our platform. We believe that it provides the simplicity of software-as-a-service, or SaaS, with the customer option of either maintaining data in the cloud, or at the edge in customer-provisioned infrastructure, which we refer to as Dynatrace® Managed. In this managed offering, we provide updates and enhancements automatically on a monthly basis while allowing customers the flexibility and control to adhere to their own data security and sovereignty requirements.
2
Table of Contents
We market Dynatrace® through a combination of our global direct sales team and a network of partners, including resellers, system integrators, and managed service providers. We target the largest 15,000 global enterprise accounts, which generally have annual revenues in excess of $750 million.
The Dynatrace Software Intelligence Platform has been commercially available since 2016 and has become our primary offering. The number of Dynatrace® customers increased to 1,364 as of March 31, 2019 from 574 as of March 31, 2018, representing year-over-year growth of 138%. As of March 31, 2019, approximately 53% of Dynatrace® customers added to the platform since April 1, 2017 were new customers, and the remaining 47% were existing customers that either added or converted to Dynatrace®. Our Dynatrace® dollar-based net expansion rate was 140% as of March 31, 2019. See section titled Managements Discussion and Analysis of Financial Condition and Results of OperationsKey Metrics.
Our subscription revenue for the years ended March 31, 2017, 2018, and 2019 was $232.8 million, $257.6 million, and $349.8 million, respectively, representing 57%, 65%, and 81%, respectively, of total revenue and year-over-year growth of 11% and 36%. Our total revenue for the years ended March 31, 2017, 2018, and 2019 was $406.4 million, $398.0 million, and $431.0 million, respectively, representing a year-over-year decline of 2% and a year-over-year increase of 8%.
We had net income (loss) of $0.8 million, $9.2 million, and $(116.2) million for the years ended March 31, 2017, 2018, and 2019, respectively. Our adjusted EBITDA for the years ended March 31, 2017, 2018, and 2019 was $108.3 million, $92.8 million, and $92.9 million, respectively, representing 26.6%, 23.3%, and 21.5%, respectively, of total revenue. See section titled Non-GAAP Financial Measures for information regarding our use of adjusted EBITDA and the reconciliation of this measure to net income (loss) determined in accordance with generally accepted accounting principles in the United States, or GAAP.
Industry Background
Key trends impacting the way enterprises develop, manage, and optimize their software environment include:
Software Applications Have Become Central to Digital Transformation for Businesses Across All Sectors
Whether it is retailers driving higher customer engagement through mobile apps, industrial companies reducing production downtime with predictive maintenance applications, or automobile manufacturers designing self-driving cars, software has become central to how enterprises deliver a differentiated user experience. At the same time, software is increasingly embedded throughout the enterprise, managing business critical systems, such as payments processing, inventory and supply chain management, logistics, and many other front- and back-office operations.
Enterprises now focus more of their budget on software innovation and less on operating and maintaining systems in order to remain competitive. As a result, enterprises are investing in new platforms that are built to automate the development, deployment, and operation of modern software applications and accelerate the transition to the enterprise cloud. Further, maintaining visibility across a broad hybrid cloud environment represents a significant challenge, which we believe is a primary reason why digital transformations are slow, often disrupted by performance issues, and can fail to achieve intended objectives.
3
Table of Contents
Changing Customer Expectations are Requiring Enterprises to Prioritize the User Experience
Enterprises are increasingly seeking to differentiate their products and services based on user experiences, with digital interaction becoming the primary channel of communication between enterprises and their customers, partners, and employees. User experience is closely tied to the performance of software applications. As a result, optimal application performance and exceptional user experiences are important to the entire enterprise, not just to the IT staff that maintain these applications. We believe that the need for an exceptional user experience to engage and retain customers will continue to drive demand for instrumentation that helps enterprises to provide high quality, user-focused outcomes.
Benefits of the Enterprise Cloud Make it Essential for Digital Transformation
Enterprises are increasingly adopting cloud technologies to increase agility and accelerate innovation. The key advantages of an enterprise cloud include:
| | Ability to build better applications at a faster rate. Cloud-based application development technologies such as container and microservices architectures, enable enterprises to focus developer resources more on creating and improving value-add application features and less on managing underlying operating systems and infrastructure. In addition to new cloud-based development technologies, enterprises are adopting new processes such as DevOps and Artificial Intelligence for IT Operations, or AIOps, that help accelerate the software delivery cycle. |
| | Operational efficiency. Enterprises are moving to the cloud to be more agile and to reduce spending on expensive and static systems, as well as the IT staff needed to maintain them. Furthermore, cloud services can be purchased dynamically as demand ebbs and flows over time, affording greater flexibility, financial efficiencies, and scale than traditional systems. |
Shift to Enterprise Cloud Introduces Fundamentally New Software Delivery Challenges
While the cloud offers enterprises some clear advantages over traditional systems, moving to the cloud also creates fundamental new challenges, such as:
| | Greater complexity. Hybrid cloud strategies require that IT teams manage applications and ensure interoperability of operations between private and multiple public clouds, such as AWS, Azure, Google Cloud Platform, or SAP Cloud platform. In addition, these applications are containerized and increasingly fragmented into microservices that are hosted across multiple cloud platforms, creating interdependencies across heterogeneous environments that increase the risk of incompatibility issues and the number of potential failure points if the applications are not deployed and maintained correctly. |
| | Highly dynamic environments. Cloud infrastructure and applications are built to scale up or down in real-time depending upon usage and traffic. The automation required to monitor these highly dynamic environments is beyond what is required for monolithic, on-premise applications. |
| | Massive scale. As software becomes more critical to business success, the number and size of applications will continue to grow and encompass more features and greater functionality. At the same time, web-scale architectures are enabling enterprises to build applications that are deployed across thousands of hosts and serve millions of users simultaneously. The breadth of functionality and scale of deployments of enterprise cloud applications regularly exceed even the largest applications built in the pre-cloud era. |
4
Table of Contents
| | More frequent changes to software. The adoption of DevOps practices and cloud architectures have increased the speed at which software updates can be developed and deployed. With the application development lifecycle accelerating, enterprises must adapt their software operations environment and culture to ensure that performance and business outcomes are not adversely affected by frequent changes. |
Traditional Monitoring Approaches Were Not Built for the Modern Enterprise Cloud
Traditional application monitoring approaches were built before the enterprise cloud was the driving force in digital transformation, and suffer from significant shortcomings when applied in cloud-based environments. Challenges of traditional monitoring solutions for the enterprise cloud include:
| | Manual configuration processes that do not scale. Traditional monitoring tools require unique agents for each component of an application and rely on IT personnel to manually pre-configure each agent. The complexity and dynamic nature of enterprise cloud applications, which can include thousands of containers and microservices, makes this multi-agent approach costly, slow, and impractical to install and maintain, especially as these applications are rapidly modified and updated. |
| | Not designed to capture data across the full application stack. Traditional APM solutions were created to view a limited portion of the full software stack and provide visibility only into individual applications, without providing visibility into how the applications are interconnected. In order to get a complete view of all applications, from the underlying infrastructure to the user experience, IT personnel are required to manually implement and manage many disparate tools. We believe this approach has resulted in enterprises overinvesting in operations and underinvesting in development, which slows innovation. |
| | Only able to provide data, not answers. Traditional monitoring tools provide data only about narrow components of the technology stack. As a result, IT teams must manually integrate and correlate the data from disparate systems and apply their own assumptions to identify the underlying cause of performance issues. This process is slow, prone to errors, and is made especially challenging by the complexity of enterprise cloud applications. |
| | Collect limited snapshots of data that do not provide real-time visibility. Traditional APM tools were not designed for the far larger and more complex data sets produced by enterprise cloud applications and can only capture snapshots of application performance or user data. This approach requires these tools to rely on partial data sets, reducing their effectiveness in performing precise root-cause determination, adding risk, and delaying innovation. In addition, traditional monitoring tools do not provide visibility into containers and microservices, which leads to blind spots in software performance monitoring when used in closed-based environments. |
| | Lack of flexible deployment options. Traditional monitoring solutions are either deployed as SaaS-only or on-premise-only. SaaS-only solutions often fail to meet the strict governance, security, and scale requirements of large enterprises, and were not built to monitor on-premise applications, making them incompatible with the needs of customers who manage hybrid-hosted applications. Conversely, traditional on-premise solutions were not built to manage cloud applications and are typically upgraded less frequently and thus innovate more slowly than cloud-based applications. |
Our Solution
We offer the market-leading software intelligence platform, purpose-built for the enterprise cloud. We built our Dynatrace Software Intelligence Platform from the ground up to meet the challenges of
5
Table of Contents
running an enterprise cloud. Our AI-powered, full-stack, and completely automated platform provides deep insight into dynamic, web-scale, hybrid cloud ecosystems. Dynatrace® is able to provide real-time actionable insights about the performance of our customers entire software ecosystem by integrating high fidelity, web-scale data, mapping its dependencies in real-time, and analyzing them with an open, deterministic AI engine. Dynatrace® is brought to market through our global direct sales force and a network of partners. The combination of our market-leading platform and go-to-market strategy has allowed us to achieve the scale, growth, and margins that we believe will provide us the capital to continue investing in driving further product differentiation.
Our platform provides the following key benefits:
| | Single agent, fully automated configuration. Dynatrace® is installed as a single agent, which we refer to as OneAgent®, that automatically configures itself, discovering all components of the full-stack to enable high fidelity and web-scale data capture. OneAgent® dynamically profiles the performance of all components of the full-stack with code-level precision, even as applications and environments change. |
| | Full-stack, all-in-one approach with deep cloud integrations. Dynatrace® combines APM with Cloud Infrastructure Monitoring, AIOps, and Digital Experience Management, or DEM, in a single full-stack approach. We believe that this all-in-one approach reduces the need for a variety of disparate tools and enables our customers to improve productivity and decision making while reducing operating costs. Dynatrace® provides out-of-the-box configuration for the leading cloud platforms, such as AWS, Azure, Google Cloud Platform, Red Hat OpenShift, Pivotal Cloud Foundry, and SAP Cloud Platform, as well as coverage for traditional on-premise mainframe and monolithic applications in a single, easy-to-use, intelligent platform. |
| | AI-powered, answer-centric insights. DavisTM, our deterministic AI engine, dynamically baselines the performance of all components in the full-stack, continually learning normal performance thresholds in order to provide precise answers when performance deviates from expected or desired conditions. Unlike correlation engines that overwhelm IT professionals with dozens of alerts from many different tools, Dynatrace® provides a single problem resolution and precise root cause determination. We believe that the accuracy and precision of the answers delivered by our AI engine enable our customers to program automated remediation actions, taking a significant step towards our vision of autonomous cloud operations and accelerating the DevOps transformation. |
| | Web-scale and enterprise grade. Dynatrace® utilizes big data architecture and enterprise-proven cloud technologies that are engineered for web-scale environments. With role-based access and advanced security functionality, Dynatrace® was purpose-built for enterprise wide adoption. |
| | Flexible deployment options. We deploy our platform as a SaaS solution, with the option of retaining the data in the cloud, or at the edge in customer-provisioned infrastructure, which we refer to as Dynatrace® Managed. The Dynatrace® Managed offering allows customers to maintain control of the environment where their data resides, whether in the cloud or on-premise, combining the simplicity of SaaS with the ability to adhere to their own data security and sovereignty requirements. Our Mission Control center automatically upgrades all Dynatrace® instances and offers on-premise cluster customers auto-deployment options that suit their specific enterprise management processes. |
6
Table of Contents
Our Opportunity
We believe that our full-stack, all-in-one, software intelligence platform, Dynatrace®, has the ability to expand our potential market opportunity by allowing us to offer our solutions into adjacent markets beyond APM, replacing traditional monitoring tools, and potentially disrupting various well-established IT spending categories, such as infrastructure monitoring, alert and incident management, and network monitoring as enterprise cloud computing replaces traditional data centers. According to Gartner, the global IT operations software market in 2019 is estimated to be $29 billion and is expected to grow at a compound annual growth rate of 6.7% to $37.5 billion in 2023.
We believe a significant portion of our market opportunity remains unpenetrated today. According to Gartner, enterprises will quadruple their APM use due to increasingly digitized business processes from 2018 through 2021, to reach 20% of all business applications. As this trend continues, we believe there is an opportunity to increase our annual recurring revenue as enterprise customers expand the number of applications instrumented.
We estimate that the annual potential market opportunity for our Dynatrace® solution is currently approximately $18 billion. We calculated this figure using the largest 15,000 global enterprises with greater than $750 million in annual revenue, as identified by S&P Capital IQ in February 2019. We then banded these companies by revenue scale, and multiplied the total number of companies in each band by our calculated annualized booking per customer for companies in each respective band. The calculated annualized bookings per customer applied for each band is calculated using internal company data of actual customer spend. For each respective band, we calculate the average annualized bookings per customer of the top 10% of customers in the band, which we believe to be representative of having achieved broader implementation of our solutions within their enterprises. We believe our potential market opportunity could expand further as enterprises increasingly instrument, monitor, and optimize more of their applications and underlying infrastructure.
Our Growth Strategy
| | Extend our technology and market leadership position. We intend to maintain our position as the market-leading software intelligence platform through increased investment in research and development and continued innovation. We expect to focus on expanding the functionality of Dynatrace® and investing in capabilities that address new market opportunities. We believe this strategy will enable new growth opportunities and allow us to continue to deliver differentiated high-value outcomes to our customers. |
| | Grow our customer base. We intend to drive new customer growth by expanding our direct sales force focused on the largest 15,000 global enterprise accounts, which generally have annual revenues in excess of $750 million. In addition, we expect to leverage our global partner ecosystem to add new customers in geographies where we have direct coverage and work jointly with our partners. In other geographies, we utilize a multi-tier master reseller model, such as in Africa, Japan, the Middle East, Russia, and South Korea. |
| | Increase penetration within existing customers. We plan to continue to increase penetration within our existing customers by expanding the breadth of our platform capabilities to provide for continued cross-selling opportunities. In addition, we believe the ease of implementation for Dynatrace® provides us the opportunity to expand adoption within our existing enterprise customers, across new customer applications, and into additional business units or divisions. Once customers are on the Dynatrace® platform, we have seen significant dollar-based net expansion due to the ease of use and power of our new platform. |
7
Table of Contents
| | Enhance our strategic partner ecosystem. Our strategic partners include industry-leading system integrators, software vendors, and cloud and technology providers. We intend to continue to invest in our partner ecosystem, with a particular emphasis on expanding our strategic alliances and cloud-focused partnerships, such as AWS, Azure, Google Cloud Platform, Red Hat OpenShift, and Pivotal Cloud Foundry. |
Our Sponsor
Thoma Bravo is a leading investment firm building on a more than 35-year history of providing capital and strategic support to experienced management teams and growing companies. Thoma Bravo has invested in many fragmented, consolidating industry sectors in the past, but has become known particularly for its history of successful investments in the application, infrastructure and security software and technology-enabled services sectors, which now have been its investment focus for more than 15 years. Thoma Bravo manages a series of investment funds representing more than $30 billion of capital commitments.
Risks Affecting Us
We are subject to a number of risks, including risks that may prevent us from achieving our business objectives or that may adversely affect our business, financial condition, results of operations and prospects. You should carefully consider the risks described under the heading Risk Factors included elsewhere in this prospectus. These risks include, among others:
| | We have experienced rapid subscription revenue growth in recent periods, and our recent growth rates may not be indicative of our future growth. |
| | Our substantial level of indebtedness could materially and adversely affect our financial condition. |
| | Market adoption of software intelligence solutions for application performance monitoring, digital experience monitoring, infrastructure monitoring, and AIOps is relatively new and may not grow as we expect, which may harm our business and prospects. |
| | Our business is dependent on overall demand for software intelligence solutions and therefore reduced spending on software intelligence solutions or overall adverse economic conditions may negatively affect our business, operating results and financial condition. |
| | If we cannot successfully execute on our strategy and continue to develop and effectively market solutions that anticipate and respond to the needs of our customers, our business, operating results and financial condition may suffer. |
| | We may experience a loss of customers and annualized recurring revenue as customers convert from our Classic products to our Dynatrace® platform. |
| | We face significant competition which may adversely affect our ability to add new customers, retain existing customers and grow our business. |
| | Failure to protect and enforce our proprietary technology and intellectual property rights could substantially harm our business, operating results and financial condition. |
| | We expect to be a controlled company within the meaning of the New York Stock Exchange rules and, as a result, will qualify for and intend to rely on exemptions from certain corporate governance requirements. Upon the completion of this offering, our executive officers, |
8
Table of Contents
| directors, and Thoma Bravo will beneficially own approximately % of our issued and outstanding shares of common stock, assuming the sale by us of shares of common stock in this offering. |
| | Thoma Bravo has a controlling influence over matters requiring stockholder approval, which may have the effect of delaying or preventing changes of control, or limiting the ability of other stockholders to approve transactions they deem to be in their best interest. |
Corporate Information
Our principal executive offices are located at 1601 Trapelo Road, Suite 116, Waltham, MA 02451 and our telephone number at that address is (781) 530-1000. Our website address is www.dynatrace.com. Information contained on, or that can be accessed through, our website does not constitute part of this prospectus, and inclusions of our website address in this prospectus are inactive textual references only.
The Dynatrace design logo and our other registered or common law trademarks, service marks or trade names appearing in this prospectus are the property of Dynatrace LLC. This prospectus includes our trademarks and trade names, including, without limitation, Dynatrace®, OneAgent®, SmartScape®, PurePath® and Davis, which are our property and are protected under applicable intellectual property laws. Other trademarks and trade names referred to in this prospectus are the property of their respective owners.
Spin-Off Transactions
Prior to this offering, Compuware Parent, LLC, or Parent, through its wholly owned indirect subsidiary Dynatrace Holding Corp., or DHC, owned and operated three separate and distinct businesses through three indirect subsidiaries: (i) Dynatrace LLC, the principal operating company of our business, (ii) Compuware Software Group LLC, or Compuware, and (iii) SIGOS LLC, or SIGOS. Dynatrace Holdings LLC is an indirect equityholder of Parent that is treated as a corporation for U.S. federal income tax purposes and that will, after the completion of the transactions described below, convert into a Delaware corporation with the name Dynatrace, Inc. and be the issuer of the shares offered pursuant to this prospectus.
Prior to the effectiveness of the registration statement of which this prospectus is a part, Parent, DHC, Compuware, we, and the other direct and indirect equityholders of Parent will effect the following transactions which will result in (i) the spin-off of Compuware and SIGOS as separate companies to the equityholders of Parent and (ii) Dynatrace, Inc. becoming the ultimate parent company of Dynatrace LLC:
| | DHC will, through a series of transactions, distribute to Parent, and Parent will spin-off and distribute to certain of its equityholders (including the Thoma Bravo Funds), all of the equity interests of SIGOS, or the SIGOS Spin-Off; |
| | All of the equityholders of Parent (including the Thoma Bravo Funds) will, through a series of transactions, receive units of Dynatrace Holdings LLC (or, in the case of Dynatrace employees, directors and other service providers who hold unvested equity awards in Parent, a new equity award under our 2019 Equity Incentive Plan that is equivalent in value to such unvested award) in exchange for their equity interests of Parent, after which Parent will merge with and into DHC; |
9
Table of Contents
| | DHC will, through a series of transactions, distribute to Dynatrace Holdings LLC, and Dynatrace Holdings LLC will spin-off and distribute to certain of its equityholders (including the Thoma Bravo Funds), all of the equity interests of Compuware, or the Compuware Spin-Off; |
| | Compuware will distribute to us an amount equal to $ million, which represents the estimated tax payable by us in connection with the Compuware Spin-Off, and all outstanding intercompany receivables and payables between Dynatrace, Compuware, SIGOS and their respective subsidiaries will be extinguished; and |
| | Dynatrace Holdings LLC will convert into a Delaware corporation with the name of Dynatrace, Inc., and the unit holders of Dynatrace Holdings LLC will becomes holders of shares of common stock of Dynatrace, Inc. |
The foregoing transactions are collectively referred to herein as the Spin-off Transactions.
Corporate-level U.S. federal (and possibly state and local) taxes of approximately $ will be payable by us in connection with the Compuware Spin-Off. Compuware has agreed to distribute to us such amount substantially concurrently with the Compuware Spin-Off and prior to the closing of this offering, and we have agreed to promptly remit such amount to the applicable taxing authorities. However, our tax liability relating to the Compuware Spin-Off will not be determined until we complete our applicable tax returns with respect to the taxable period that includes the Compuware Spin-Off. We will be solely responsible for any amount of taxes owed in excess of the amount we receive from Compuware prior to this offering. We do not expect to incur any material tax liabilities in connection with the SIGOS Spin-Off because we estimate that the fair market value of the SIGOS assets is materially similar to the adjusted tax basis in such assets. See Risk FactorsRisks Related to Our BusinessThe Compuware Spin-Off and the SIGOS Spin-Off are taxable transactions for us, and we will be subject to tax liabilities in connection with such transactions.
10
Table of Contents
The following diagram shows our organizational structure immediately prior to giving effect to the Spin-Off Transactions.
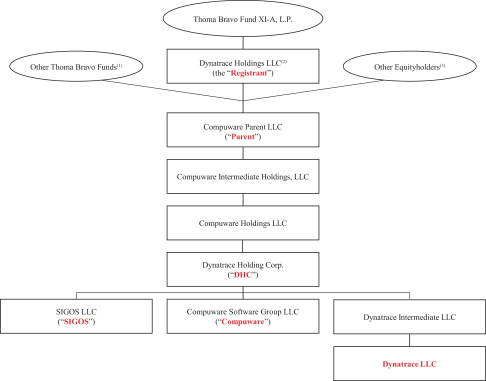
| (1) | Includes special purpose investment entities wholly-owned by certain Thoma Bravo Funds. |
| (2) | Dynatrace Holdings LLC will convert into a corporation with the name Dynatrace, Inc. immediately prior to the effectiveness of the registration statement of which this prospectus is a part. |
| (3) | Includes employee equityholders and other equityholders who invested alongside the Thoma Bravo Funds. |
Following the completion of the Spin-Off Transactions and prior to the closing of this offering, (i) the Thoma Bravo Funds will own approximately % of Dynatrace, Inc.s issued and outstanding common stock, (ii) DHC will be a wholly owned indirect subsidiary of Dynatrace, Inc. and (iii) Dynatrace LLC will be a wholly owned indirect subsidiary of DHC. Dynatrace, Inc. will be the ultimate parent company of Dynatrace LLC and will have no material assets or operations other than its direct and indirect ownership interests in its subsidiaries, including Dynatrace LLC. Additionally, Dynatrace, Inc. will have several wholly owned direct subsidiaries that are legacies from the corporate structure that existed prior to this offering. Those entities will have no material assets or operations other than their ownership of a portion of the outstanding shares of DHC. See section titled Spin-Off Transactions.
11
Table of Contents
The following diagram shows our organizational structure, and the ownership of Compuware and SIGOS, after giving effect to the Spin-Off Transactions.
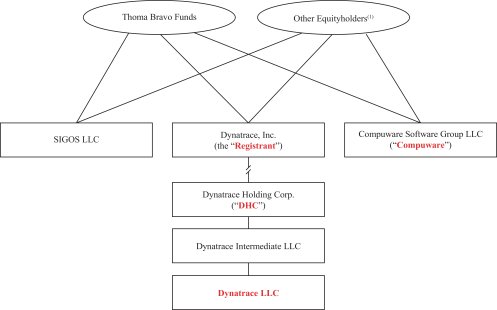
| (1) | Includes employee equityholders and other equityholders who invested alongside the Thoma Bravo Funds. |
Emerging Growth Company
We are an emerging growth company within the meaning of the Jumpstart Our Business Startups Act of 2012, or the JOBS Act. As an emerging growth company, we may take advantage of certain exemptions from various public reporting requirements, including the requirement that we provide more than two years of audited financial statements and related managements discussion and analysis of financial condition and results of operations, that our internal control over financial reporting be audited by our independent registered public accounting firm pursuant to Section 404 of the Sarbanes-Oxley Act of 2002, or the Sarbanes-Oxley Act, that we provide certain disclosures regarding executive compensation, and that we hold nonbinding stockholder advisory votes on executive compensation and any golden parachute payments not previously approved. We may take advantage of these exemptions until we are no longer an emerging growth company.
In addition, under the JOBS Act, emerging growth companies can delay adopting new or revised accounting standards until such time as those standards apply to private companies. We have elected to take advantage of the longer phase-in periods for the adoption of new or revised financial accounting standards under the JOBS Act until we are no longer an emerging growth company. Our election to use the phase-in periods permitted by this election may make it difficult to compare our financial statements to those of non-emerging growth companies and other emerging growth companies that have opted out of the longer phase-in periods permitted under the JOBS Act and who will comply with new or revised financial accounting standards. If we were to subsequently elect instead to comply with public company effective dates, such election would be irrevocable pursuant to the JOBS Act.
12
Table of Contents
We will remain an emerging growth company until the earliest to occur of (i) the last day of the fiscal year in which we have more than $1.07 billion in annual revenue; (ii) the date on which we become a large accelerated filer (the fiscal year-end on which more than $700 million of equity securities are held by non-affiliates as of the last day of our then most recently completed second fiscal quarter (and we have been a public company for at least 12 months and have filed one annual report on Form 10-K)); (iii) the date on which we have issued, in any three-year period, more than $1.0 billion in non-convertible debt securities; and (iv) the last day of the fiscal year ending after the fifth anniversary of the completion of this offering.
Status as a Controlled Company
Because the Thoma Bravo Funds will initially own shares of our common stock, representing approximately % of the voting power of our issued and outstanding capital stock following the completion of this offering, we will be a controlled company as of the completion of the offering under the Sarbanes-Oxley Act, and the rules of the New York Stock Exchange, or the NYSE. As a controlled company, a majority of our board of directors is not required to be independent, and we are not required to form independent compensation and nominating and corporate governance committees of our board of directors. As a controlled company, we will remain subject to rules of the Sarbanes-Oxley Act and the NYSE that require us to have an audit committee composed entirely of independent directors. Under these rules, we must have at least one independent director on our audit committee by the date our common stock is listed on the NYSE, at least two independent directors on our audit committee within 90 days of the listing date, and at least three directors, all of whom must be independent, on our audit committee within one year of the listing date. We expect to have independent directors upon the closing of this offering, of whom will qualify as independent for audit committee purposes.
If at any time we cease to be a controlled company, we will take all action necessary to comply with the Sarbanes-Oxley Act and rules of the NYSE, including by having a majority of independent directors and ensuring we have a compensation committee and a nominating and corporate governance committee, each composed entirely of independent directors, subject to a permitted phase-in period. See the section titled ManagementStatus as a Controlled Company.
13
Table of Contents
THE OFFERING
| Common stock offered |
shares. | |
| Option to purchase additional shares |
shares. | |
| Common stock to be outstanding after this offering |
shares ( shares if the underwriters option to purchase additional shares is exercised in full). |
|
| Use of proceeds |
We estimate that the net proceeds from the sale of shares of our common stock in this offering will be approximately $ million (or approximately $ million if the underwriters option to purchase additional shares is exercised in full), assuming an initial public offering price of $ per share (the midpoint of the estimated price range set forth on the cover page of this prospectus), after deducting estimated underwriting discounts and commissions and estimated offering expenses payable by us.
We intend to use the net proceeds from this offering for general corporate purposes, including working capital, operating expenses and capital expenditures, and to repay a portion of the borrowings outstanding under our first and second lien term loan facilities, under which affiliates of certain of the underwriters in this offering are lenders. See section titled Use of Proceeds for additional information. |
|
| Controlled company |
After this offering, the Thoma Bravo Funds will own approximately % of our issued and outstanding shares of common stock (or % of our issued and outstanding shares of common stock if the underwriters option to purchase additional shares is exercised in full). As a result, we expect to be a controlled company within the meaning of the corporate governance standards of the NYSE. See section titled ManagementStatus as a Controlled Company. | |
| Risk factors |
See section titled Risk Factors and other information included in this prospectus for a discussion of factors you should carefully consider before deciding to invest in our common stock. | |
| Proposed New York Stock Exchange symbol |
DT | |
14
Table of Contents
The number of shares of our common stock to be outstanding after this offering is based on shares of common stock outstanding as of 2019, and excludes:
| | shares of our common stock issuable upon the exercise of stock options outstanding as of at a weighted average exercise price of $ per share; |
| | shares of common stock available for future issuance under our equity compensation plans; |
| | shares of our common stock that will become available for future issuance under our 2019 Equity Incentive Plan, which will become effective in connection with the completion of this offering; and |
| | shares of our common stock that will become available for future issuance under our 2019 Employee Stock Purchase Plan, which will become effective in connection with the completion of this offering. |
Except as otherwise indicated, all information contained in this prospectus assumes or gives effect to:
| | the filing of our amended and restated certificate of incorporation, or charter, and the effectiveness of our amended and restated bylaws, or bylaws, upon the closing of this offering; |
| | the completion of the Spin-Off Transactions; and |
| | no exercise by the underwriters of their option to purchase up to an additional shares of our common stock from us. |
15
Table of Contents
SUMMARY CONSOLIDATED FINANCIAL AND OTHER DATA
You should read the following summary consolidated financial data together with our consolidated financial statements and the related notes appearing at the end of this prospectus and the Selected Consolidated Financial Data and Managements Discussion and Analysis of Financial Condition and Results of Operations sections of this prospectus. We have derived the consolidated statement of operations data for the years ended March 31, 2017, 2018 and 2019 from our audited consolidated financial statements appearing at the end of this prospectus. Our historical results are not necessarily indicative of results that may be expected in the future.
The following tables present selected consolidated financial data for the periods indicated.
| Year Ended March 31, | ||||||||||||
| 2017 | 2018 | 2019 | ||||||||||
| Consolidated Statements of Operations Data: |
||||||||||||
| Revenue: |
||||||||||||
| Subscriptions |
$ | 232,783 | $ | 257,576 | $ | 349,830 | ||||||
| License |
130,738 | 98,756 | 40,354 | |||||||||
| Services |
42,856 | 41,715 | 40,782 | |||||||||
|
|
|
|
|
|
|
|||||||
| Total revenue |
406,377 | 398,047 | 430,966 | |||||||||
|
|
|
|
|
|
|
|||||||
| Cost of revenues: |
||||||||||||
| Cost of subscriptions |
52,176 | 48,270 | 56,934 | |||||||||
| Cost of services |
30,735 | 30,316 | 31,529 | |||||||||
| Amortization of acquired technology |
19,261 | 17,948 | 18,338 | |||||||||
|
|
|
|
|
|
|
|||||||
| Total cost of revenues(1) |
102,172 | 96,534 | 106,801 | |||||||||
|
|
|
|
|
|
|
|||||||
| Gross Profit |
304,205 | 301,513 | 324,165 | |||||||||
|
|
|
|
|
|
|
|||||||
| Operating expenses: |
||||||||||||
| Research and development(1) |
52,885 | 58,320 | 76,759 | |||||||||
| Sales and marketing(1) |
129,971 | 145,350 | 178,886 | |||||||||
| General and administrative(1) |
49,232 | 64,114 | 91,778 | |||||||||
| Amortization of other intangibles |
51,947 | 50,498 | 47,686 | |||||||||
| Restructuring and other |
7,637 | 4,990 | 1,763 | |||||||||
|
|
|
|
|
|
|
|||||||
| Total operating expenses |
291,672 | 323,272 | 396,872 | |||||||||
|
|
|
|
|
|
|
|||||||
| Income (loss) from operations |
12,533 | (21,759 | ) | (72,707 | ) | |||||||
| Other expense, net |
(28,926 | ) | (30,016 | ) | (67,204 | ) | ||||||
|
|
|
|
|
|
|
|||||||
| (Loss) before taxes |
(16,393 | ) | (51,775 | ) | (139,911 | ) | ||||||
| Income tax benefit |
17,189 | 60,997 | 23,717 | |||||||||
|
|
|
|
|
|
|
|||||||
| Net income (loss) |
$ | 796 | $ | 9,222 | $ | (116,194 | ) | |||||
|
|
|
|
|
|
|
|||||||
16
Table of Contents
| (1) | The following table summarizes the classification of stock-based compensation expense in our consolidated statements of operations: |
| Year Ended March 31, | ||||||||||||
| 2017 | 2018 | 2019 | ||||||||||
| Cost of revenues |
$ | 28 | $ | 1,720 | $ | 5,777 | ||||||
| Research and development |
71 | 3,858 | 12,566 | |||||||||
| Sales and marketing |
122 | 7,536 | 24,673 | |||||||||
| General and administrative |
128 | 9,180 | 28,135 | |||||||||
|
|
|
|
|
|
|
|||||||
| Total compensation expense |
$ | 349 | $ | 22,294 | $ | 71,151 | ||||||
|
|
|
|
|
|
|
|||||||
| As of March 31, 2019 | ||||||||||||
| Actual | Pro Forma(2) | Pro Forma as Adjusted(3)(4) |
||||||||||
| Consolidated Balance Sheet Data: |
||||||||||||
| Cash and cash equivalents |
$ | 51,314 | ||||||||||
| Working capital, excluding deferred revenue(1) |
132,239 | |||||||||||
| Total assets |
1,811,366 | |||||||||||
| Deferred revenue, current and non-current portion |
365,745 | |||||||||||
| Long-term debt, net of current portion |
1,011,793 | |||||||||||
| Total liabilities |
2,201,624 | |||||||||||
| Total members deficit |
(390,258 | ) | ||||||||||
| (1) | We define working capital as current assets less current liabilities, excluding related-party payables. |
| (2) | Gives effect to the completion of the Spin-Off Transactions, as set forth under the section titled Spin-Off Transactions, prior to the effectiveness of the registration statement of which this prospectus forms a part. |
| (3) | Gives effect to the pro forma adjustments set forth above and the sale and issuance by us of shares of our common stock in this offering, assuming an initial public offering price of $ per share (the midpoint of the estimated offering price range set forth on the cover page of this prospectus), after deducting estimated underwriting discounts and commissions and estimated offering expenses payable by us, and the application of the net proceeds from this offering as set forth under the section titled Use of Proceeds. |
| (4) | Each $1.00 increase (decrease) in the assumed initial public offering price of $ per share (the midpoint of the estimated offering price range set forth on the cover page of this prospectus), would increase (decrease) the pro forma as adjusted amount of cash and cash equivalents, working capital excluding deferred revenue, total assets and total stockholders equity by $ million, assuming that the number of shares offered by us, as set forth on the cover page of this prospectus, remains the same and after deducting estimated underwriting discounts and commissions and estimated offering expenses payable by us. We may also increase or decrease the number of shares we are offering. Each increase (decrease) of 1.0 million shares in the number of shares offered by us, as set forth on the cover page of this prospectus, would increase (decrease) the pro forma as adjusted amount of each of cash and cash equivalents, working capital, excluding deferred revenue, total assets and total stockholders equity by $ million, assuming no change in the assumed initial public offering price per share and after deducting estimated underwriting discounts and commissions and estimated offering expenses payable by us. |
17
Table of Contents
Key Metrics
In addition to our financial information presented in accordance with GAAP, we use a number of operating and financial metrics, including the following key metrics, to clarify and enhance our understanding of past performance and future prospects.
Customers, Annual Recurring Revenue (ARR), Dollar-Based Net Expansion Rate and Total ARR
|
|
As of | |||||||||||||||||||||||||||||||
| 6/30/2017 | 9/30/2017 | 12/31/2017 | 3/31/2018 | 6/30/2018 | 9/30/2018 | 12/31/2018 | 3/31/2019 | |||||||||||||||||||||||||
| Number of Dynatrace® Customers |
201 | 276 | 399 | 574 | 733 | 899 | 1,149 | 1,364 | ||||||||||||||||||||||||
| Dynatrace® ARR (in thousands) |
$ | 30,739 | $ | 45,007 | $ | 61,165 | $ | 85,306 | $ | 118,371 | $ | 159,949 | $ | 226,976 | $ | 282,815 | ||||||||||||||||
| Classic ARR (in thousands) |
$ | 201,522 | $ | 202,650 | $ | 201,927 | $ | 195,008 | $ | 187,732 | $ | 166,490 | $ | 145,341 | $ | 120,459 | ||||||||||||||||
| Total ARR (in thousands) |
$ | 232,261 | $ | 247,657 | $ | 263,092 | $ | 280,314 | $ | 306,103 | $ | 326,439 | $ | 372,317 | $ | 403,274 | ||||||||||||||||
| Dynatrace® Dollar-Based Net Expansion Rate |
* | * | * | * | 122 | % | 120 | % | 129 | % | 140 | % | ||||||||||||||||||||
| * | Not meaningful |
For an explanation of our key metrics, see section titled Managements Discussion and Analysis of Financial Condition and Results of OperationsKey Metrics.
18
Table of Contents
Investing in our common stock involves a high degree of risk. You should carefully consider the risks and uncertainties described below, together with all of the other information in this prospectus, including the section titled Managements Discussion and Analysis of Financial Condition and Results of Operations and our consolidated financial statements and related notes, before making a decision to invest in our common stock. The risks and uncertainties described below may not be the only ones we face. If any of the risks actually occur, our business, operating results, financial condition and prospects could be materially and adversely affected. In that event, the market price of our common stock could decline, and you could lose all or part of your investment.
Risks Related to Our Business
We have experienced rapid subscription revenue growth in recent periods, and our recent growth rates may not be indicative of our future growth.
We have experienced rapid subscription revenue growth in recent periods. From the year ended March 31, 2018 to the year ended March 31, 2019, our subscription revenue grew 35.8% from $257.6 million to $349.8 million, respectively. From the fiscal year ended March 31, 2018 to the year ended March 31, 2019, subscription revenue as a percentage of total revenue grew from 65% to 81%, respectively. From the year ended March 31, 2017 to the year ended March 31, 2018, our subscription revenue grew 10.7% from $232.8 million to $257.6 million, respectively. From the year ended March 31, 2017 to the year ended March 31, 2018, subscription revenue as a percentage of total revenue grew from 57% to 65%, respectively. This subscription revenue growth may not be indicative of our future subscription revenue growth and we may not be able to sustain revenue growth consistent with recent history, or at all. We believe our ability to continue to increase our revenue depends on a number of factors, including, but not limited to:
| | our ability to attract new customers and retain and increase sales to existing customers; |
| | our ability to continue to expand customer adoption of our Dynatrace® platform, including the conversion of customers from our Classic products; |
| | our ability to develop our existing platform and introduce new solutions on our platform; |
| | continued growth of cloud-based services and solutions; |
| | our ability to continue to develop and offer products and solutions that are superior to those of our competitors; |
| | our ability to retain customers; and |
| | our ability to hire and retain sufficient numbers of sales and marketing, research and development and general and administrative personnel, and expand our global operations. |
If we are unable to achieve any of these requirements, our subscription revenue growth will be adversely affected.
Our quarterly and annual operating results may be adversely affected due to a variety of factors, which could make our future results difficult to predict.
Our annual and quarterly revenue and operating results have fluctuated significantly in the past and may vary significantly in the future due to a variety of factors, many of which are outside of our control. Our financial results in any one quarter may not be meaningful and should not be relied upon as indicative of future performance. If our revenues, earnings or operating results fall below the
19
Table of Contents
expectations of investors or securities analysts in a particular quarter, or below any guidance that we may provide, the price of our common stock could decline. We may not be able to accurately predict our future billings, revenues, earnings or operating results. Some of the important factors that may cause our operating results to fluctuate from quarter to quarter or year to year include:
| | fluctuations in the demand for our solutions, and the timing of purchases by our customers, particularly larger purchases; |
| | fluctuations in the rate of utilization by enterprise customers of the cloud to manage their business needs, or a slow-down in the migration of enterprise systems to the cloud; |
| | our ability to attract new customers and retain existing customers; |
| | the budgeting cycles and internal purchasing priorities of our customers; |
| | changes in customer renewal rates, churn and our ability to cross-sell additional solutions to our existing customers and our ability to up-sell additional quantities of previously purchased products to existing customers; |
| | the seasonal buying patterns of our customers; |
| | the payment terms and contract term length associated with our product sales and their effect on our billings and free cash flow; |
| | changes in customer requirements or market needs; |
| | the emergence of significant privacy, data protection, security or other threats, regulations or requirements applicable to the use of enterprise systems or cloud-based systems that we are not prepared to meet or that require additional investment by us; |
| | changes in the demand and growth rate of the market for software and systems monitoring and analytics solutions; |
| | our ability to anticipate or respond to changes in the competitive landscape, or improvements in the functionality of competing solutions that reduce or eliminate one or more of our competitive advantages; |
| | our ability to timely develop, introduce and gain market acceptance for new solutions and product enhancements; |
| | our ability to adapt and update our products and solutions on an ongoing and timely basis in order to maintain compatibility and efficacy with the frequently changing and expanding variety of software and systems that our products are designed to monitor; |
| | our ability to successfully expand our business internationally; |
| | our ability to maintain and expand our relationships with strategic technology partners, who own, operate and offer the major platforms on which cloud applications operate, with which we must interoperate and remain compatible, and from which we must obtain certifications and endorsements in order to maintain credibility and momentum in the market; |
| | our ability to control costs, including our operating expenses; |
| | our ability to efficiently complete and integrate any acquisitions or business combinations that we may undertake in the future; |
| | general economic, industry and market conditions, both domestically and in our foreign markets; |
| | the emergence of new technologies or trends in the marketplace; |
| | foreign currency exchange rate fluctuations; |
20
Table of Contents
| | the timing of revenue recognition for our customer transactions, and the effect of the mix of time-based licenses, SaaS subscriptions and perpetual licenses on the timing of revenue recognition; |
| | extraordinary expenses, such as litigation or other dispute-related settlement payments; and |
| | future accounting pronouncements or changes in our accounting policies. |
Any one of the factors referred to above or the cumulative effect of some of the factors referred to above may result in our operating results being below our expectations and the expectations of securities analysts and investors, or may result in significant fluctuations in our quarterly and annual operating results, including fluctuations in our key performance indicators. This variability and unpredictability could result in our failure to meet our business plan or the expectations of securities analysts or investors for any period. In addition, a significant percentage of our operating expenses are fixed in nature in the short term and based on forecasted revenue trends. Accordingly, in the event of revenue shortfalls, we are generally unable to mitigate the negative impact on margins in the short term.
Our debt obligations contain restrictions that impact our business and expose us to risks that could adversely affect our liquidity and financial condition.
At March 31, 2019, we had approximately $1.0 billion of aggregate indebtedness, consisting of $947.6 million outstanding under our first lien term loan facility, $88.7 million outstanding under our second lien term loan facility, $0.5 million outstanding under a $15.0 million letter of credit sub-facility and $14.3 million in unamortized debt issuance fees. We also have a $60.0 million revolving credit facility under which we had no outstanding borrowings as of March 31, 2019. Under our first lien term loan facility, we are required to repay approximately $2.4 million of principal at the end of each quarter (commencing March 31, 2019) and are required to pay accrued interest on the last day of each interest accrual period. Under our second lien term loan facility, we are not required to make any periodic repayments of principal, but are required to pay accrued interest upon the last day of each interest accrual period. Interest accrual periods under each loan facility are typically one month in duration. The actual amounts of our debt servicing payments vary based on the amounts of indebtedness outstanding, the applicable interest accrual periods and the applicable interest rates, which vary based on prescribed formulas. Our cash paid for interest was approximately $41.0 million during the year ended March 31, 2019.
The credit and guaranty agreement, which we refer to as our Credit Agreement, governing our term loan facility and our revolving credit facility, which we refer to as our Credit Facility, contains various covenants that are operative so long as our Credit Facility remains outstanding. The covenants, among other things, limit our and certain of our subsidiaries abilities to:
| | incur additional indebtedness or guarantee indebtedness of others; |
| | create additional liens on our assets; |
| | pay dividends and make other distributions on our capital stock, and redeem and repurchase our capital stock; |
| | make investments, including acquisitions; |
| | make capital expenditures; |
| | enter into mergers or consolidations or sell assets; |
| | engage in sale and leaseback transactions; or |
| | enter into transactions with affiliates. |
21
Table of Contents
Our Credit Facility also contains numerous affirmative covenants, including financial covenants. Even if our Credit Facility is terminated, any additional debt that we incur in the future could subject us to similar or additional covenants. For a more detailed description of our indebtedness, see Description of Indebtedness.
If we experience a decline in cash flow due to any of the factors described in this Risk Factors section or otherwise, we could have difficulty paying interest and the principal amount of our outstanding indebtedness and meeting the financial covenants set forth in our Credit Facility. If we are unable to generate sufficient cash flow or otherwise to obtain the funds necessary to make required payments under our Credit Facility, or if we fail to comply with the various requirements of our indebtedness, we could default under our Credit Facility. Our Credit Facility also contains provisions that trigger repayment obligations or an event of default upon a change of control, as well as various representations and warranties which, if breached, could lead to an event of default. Any such default that is not cured or waived could result in an acceleration of indebtedness then outstanding under our Credit Facility, an increase in the applicable interest rates under our Credit Facility, and a requirement that our subsidiaries that have guaranteed our Credit Facility pay the obligations in full, and would permit the lenders to exercise remedies with respect to all of the collateral that is securing our Credit Facility, including substantially all of our and our subsidiary guarantors assets. We cannot be certain that our future operating results will be sufficient to ensure compliance with the covenants in our Credit Agreement or to remedy any defaults under our Credit Agreement. In addition, in the event of any default and related acceleration, we may not have or be able to obtain sufficient funds to make any accelerated payments. Any such default could have a material adverse effect on our liquidity, financial condition and results of operations.
Our substantial level of indebtedness could materially and adversely affect our financial condition.
We now have, and expect to continue to have, significant indebtedness that could result in a material and adverse effect on our business by:
| | increasing our vulnerability to general adverse economic and industry conditions; |
| | requiring us to dedicate a substantial portion of our cash flow from operations to payments on our indebtedness, thereby reducing the availability of our cash flow to fund working capital, capital expenditures, acquisitions, research and development efforts and other general corporate purposes; |
| | limiting our flexibility in planning for, or reacting to, changes in our business and the industry in which we operate; and |
| | exposing us to the risk of increased interest rates as certain of our borrowings are, and may in the future be, at variable interest rates. |
The occurrence of any one of these events could have a material adverse effect on our business, financial condition, results of operations and ability to satisfy our obligations under our Credit Facility.
We may need to refinance all or a portion of our indebtedness, including our Credit Facility, at or before maturity. We may not be able to accomplish any of these alternatives on terms acceptable to us, or at all. In addition, our existing Credit Agreement restricts us, and future credit agreements may restrict us, from adopting any of these alternatives. The failure to generate sufficient cash flow or to achieve any of these alternatives could materially adversely affect our ability to pay the amounts due under our Credit Agreement.
22
Table of Contents
The Compuware Spin-Off and the SIGOS Spin-Off are taxable transactions for us, and we will be subject to tax liabilities in connection with such transactions.
Neither the Compuware Spin-Off nor the SIGOS Spin-Off will qualify as a tax-free spin-off under Section 355 of the Internal Revenue Code, or the Code. Corporate-level U.S. federal (and possibly state and local) taxes of approximately $ , or the Estimated Compuware Spin Tax Liability, will be payable by us in connection with the Compuware Spin-Off. These taxes will generally be based upon the gain computed as the difference between the fair market value of the Compuware assets distributed and the adjusted tax basis in such assets. We will not have sufficient losses available to fully offset the gain we expect to realize as a result of the Compuware Spin-Off. We do not expect to incur any material tax liabilities in connection with the SIGOS Spin-Off because we estimate that the fair market value of the SIGOS assets is materially similar to the adjusted tax basis in such assets.
Pursuant to a structuring agreement, Compuware has agreed to distribute to us an amount equal to the Estimated Compuware Spin Tax Liability substantially concurrently with the Compuware Spin-Off and prior to the closing of this offering, and we have agreed to promptly remit such amount to the applicable taxing authorities. However, the amount of our tax liability relating to the Compuware Spin-Off will not be determined until we complete our applicable tax returns with respect to the taxable period that includes the Compuware Spin-Off. We will be solely responsible for any amount of taxes owed in excess of the Estimated Compuware Spin Tax Liability, which amount could be material, and Compuware will not pay or reimburse us for such amount. Although the Estimated Compuware Spin Tax Liability has been calculated based on a third party valuation of Compuware and we believe is a reasonable estimate of the taxes owed by us with respect to the Compuware Spin-Off, we cannot offer any assurances that the final tax liability will not be different. Any tax liabilities in excess of the Estimated Compuware Spin Tax Liability may adversely affect our results of operations.
In addition, if the Internal Revenue Service or other taxing authorities were to successfully challenge in an audit or other tax dispute the amount of taxes owed in connection with the Compuware Spin-Off or the SIGOS Spin-Off, we could be liable for additional taxes, including interest and penalties. We would be responsible for any such additional amounts, which would not be reimbursed to us by Compuware. While we currently expect to obtain an insurance policy that provides coverage if the Internal Revenue Service or other taxing authorities assert that additional taxes are owed in connection with the Compuware Spin-Off, such policy will be subject to certain limitations and exclusions, and we cannot offer any assurances that such policy will be available or that it will fully cover any additional taxes owed by us. We will not obtain a tax insurance policy relating to the SIGOS Spin-Off. Any tax liabilities determined to be owed by us relating to the Compuware Spin-Off or the SIGOS Spin-Off following an audit or other tax dispute may adversely affect our results of operations.
Failure to maintain our credit ratings could adversely affect our liquidity, capital position, ability to hedge certain financial risks, borrowing costs and access to capital markets.
Our credit risk is evaluated by the major independent rating agencies, and such agencies have in the past and could in the future downgrade our ratings. We cannot assure you that we will be able to maintain our current credit ratings, and any additional actual or anticipated changes or downgrades in our credit ratings, including any announcement that our ratings are under further review for a downgrade, may have a negative impact on our liquidity, capital position, ability to hedge certain financial risks and access to capital markets. In addition, changes by any rating agency to our outlook or credit rating could increase the interest we pay on outstanding or future debt.
23
Table of Contents
Market adoption of software intelligence solutions for application performance monitoring, digital experience monitoring, infrastructure monitoring, and AIOps is relatively new and may not grow as we expect, which may harm our business and prospects.
The utilization of software intelligence solutions, such as Dynatrace®, for digital experience monitoring, infrastructure monitoring, and AIOps is relatively new. We believe our future success will depend in large part on the growth, if any, in the demand for software intelligence solutions, particularly the demand for enterprise-wide solutions. We currently target the markets for application performance monitoring, or APM, infrastructure monitoring, AIOps and digital experience monitoring. It is difficult to predict customer demand, adoption, churn and renewal rates for our solutions, the rate at which existing customers expand their usage of our solutions, the size and growth rate of the market for our solutions. Expansion in our addressable market depends on a number of factors, including the continued and growing reliance of enterprises on software applications to manage and drive critical business functions and customer interactions, increased use of microservices and containers, as well as the continued proliferation of mobile applications, large data sets, cloud computing and the Internet of Things. If our solutions do not achieve widespread adoption or there is a reduction in demand for software intelligence solutions generally, it could result in reduced customer purchases, reduced renewal rates and decreased revenue, any of which will adversely affect our business, operating results and financial condition.
Our business is dependent on overall demand for software intelligence solutions and therefore reduced spending on software intelligence solutions or overall adverse economic conditions may negatively affect our business, operating results and financial condition.
Our business depends on the overall demand for software intelligence solutions, particularly demand from mid- to large-sized enterprises worldwide, and the purchase of our solutions by such organizations is often discretionary. In an economic downturn, our customers may reduce their operating or IT budgets, which could cause them to defer or forego purchases of software intelligence solutions, including ours. Customers may delay or cancel IT projects or seek to lower their costs by renegotiating vendor contracts or renewals. To the extent purchases of software intelligence solutions are perceived by existing customers and potential customers to be discretionary, our revenue may be disproportionately affected by delays or reductions in general IT spending. Weak global economic conditions or a reduction in software intelligence spending, even if general economic conditions remain unaffected, could adversely impact our business, operating results and financial condition in a number of ways, including longer sales cycles, lower prices for our solutions, reduced subscription renewals and lower revenue. In addition, any negative economic effects or instability resulting from changes in the political environment and international relations in the United States or other key markets as well as resulting regulatory or tax policy changes may adversely affect our business and financial results.
As the market for software intelligence solutions is new and continues to develop, trends in spending remain unpredictable and subject to reductions due to the changing technology environment and customer needs as well as uncertainties about the future.
If we cannot successfully execute on our strategy and continue to develop and effectively market solutions that anticipate and respond to the needs of our customers, our business, operating results and financial condition may suffer.
The market for software intelligence solutions is at an early stage of development and is characterized by constant change and innovation, and we expect it to continue to rapidly evolve. Moreover, many of our customers operate in industries characterized by changing technologies and business models, which require them to develop and manage increasingly complex software application and IT infrastructure environments. Our future success, if any, will be based on our ability to consistently provide our customers
24
Table of Contents
with a unified, real-time view into the performance of their software applications and IT infrastructure, provide notification and prioritization of degradations and failures, perform root cause analysis of performance issues, and analyze the quality of their end users experiences and the resulting impact on their businesses and brands. If we do not respond to the rapidly changing needs of our customers by developing and making available new solutions and solution enhancements that can address evolving customer needs on a timely basis, our competitive position and business prospects will be harmed.
In addition, the process of developing new technology is complex and uncertain, and if we fail to accurately predict customers changing needs and emerging technological trends, our business could be harmed. We believe that we must continue to dedicate significant resources to our research and development efforts, including significant resources to developing new solutions and solution enhancements before knowing whether the market will accept them. Our new solutions and solution enhancements could fail to attain sufficient market acceptance for many reasons, including:
| | delays in releasing new solutions or enhancements to the market; |
| | delays or failures to provide updates to customers to maintain compatibility between Dynatrace® and the various applications and platforms being used in the customers application and enterprise cloud environment; |
| | the failure to accurately predict market or customer demands; |
| | defects, errors or failures in the design or performance of our new solutions or solution enhancements; |
| | negative publicity about the performance or effectiveness of our solutions; |
| | the introduction or anticipated introduction of competing products by our competitors; and |
| | the perceived value of our solutions or enhancements relative to their cost. |
To the extent we are not able to continue to execute on our business model to timely and effectively develop and market applications to address these challenges and attain market acceptance, our business, operating results and financial condition will be adversely affected.
Further, we may make changes to our solutions that our customers do not value or find useful. We may also discontinue certain features, begin to charge for certain features that are currently free or increase fees for any of our features or usage of our solutions. If our new solutions or enhancements do not achieve adequate acceptance in the market, our competitive position will be impaired, our revenue may decline or grow more slowly than expected and the negative impact on our operating results may be particularly acute, and we may not receive a return on our investment in the upfront research and development, sales and marketing and other expenses we incur in connection with new solutions or solution enhancements.
If our platform and solutions do not effectively interoperate with our customers existing or future IT infrastructures, installations of our solutions could be delayed or cancelled, which would harm our business.
Our success depends on the interoperability of our platform and solutions with third-party operating systems, applications, data and devices that we have not developed and do not control. Any changes in such operating systems, applications, data or devices that degrade the functionality of our platform or solutions or give preferential treatment to competitive software could adversely affect the adoption and usage of our platform. We may not be successful in adapting our platform or solutions to operate effectively with these applications, data or devices. If it is difficult for our customers to access and use our platform or solutions, or if our platform or solutions cannot connect a broadening range of applications, data and devices, then our customer growth and retention may be harmed, and our business and operating results could be adversely affected.
25
Table of Contents
Enterprise cloud deployments utilize multiple third-party platforms and technologies, and these technologies are updated to new versions at a rapid pace. As a result, we deliver frequent updates to our solutions designed to maintain compatibility and support for our customers changing technology environments and ensure our solutions ability to continue to monitor the customers applications. If our solutions fail to work with any one or more of these technologies or applications, or if our customers fails to install the most recent updates and versions of our solutions that we offer, our solutions will be unable to continuously monitor our customers critical business applications.
Ensuring that our solutions are up-to-date and compatible with the technology and enterprise cloud platforms utilized by our customers is critical to our success. We have formed alliances with many technology and cloud platform providers to provide updates to our solutions to maintain compatibility. We work with technology and cloud platform providers to understand and align updates to their product roadmaps and engage in early access and other programs to ensure compatibility of our solutions with the technology vendors generally available release. If our relations with our technology partners ceases we may be unable to deliver these updates, or if our customers fail to install the most recent updates and versions of our solutions that we offer, then our customers ability to benefit from our solution may decrease significantly and, in some instances, may require the customer to de-install our solution due to the incompatibility of our solution with the customers applications.
Our future revenues and operating results will be harmed if we are unable to acquire new customers, if our customers do not renew their contracts with us, or if we are unable to expand sales to our existing customers or develop new solutions that achieve market acceptance.
To continue to grow our business, it is important that we continue to attract new customers to purchase and use our solutions. Our success in attracting new customers depends on numerous factors, including our ability to:
| | offer a compelling software intelligence platform and solutions; |
| | execute our sales and marketing strategy; |
| | attract, effectively train and retain new sales, marketing, professional services and support personnel in the markets we pursue; |
| | develop or expand relationships with technology partners, systems integrators, resellers, online enterprise marketplaces and other partners; |
| | expand into new geographies and markets; |
| | deploy our platform and solutions for new customers and; |
| | provide quality customer support. |
Our customers have no obligation to renew their maintenance, SaaS and/or term-license agreements, and our customers may decide not to renew these agreements with a similar contract period, at the same prices and terms or with the same or a greater number of licenses. Although our customer retention rate has historically been strong, some of our customers have elected not to renew their agreements with us, and it is difficult to accurately predict long-term customer retention, churn and expansion rates. Our customer retention and expansion rates may decline or fluctuate as a result of a number of factors, including our customers satisfaction with our solutions as they convert from our Classic products to our Dynatrace® platform, our customer support and professional services, our prices and pricing plans, the competitiveness of other software products and services, reductions in our customers spending levels, user adoption of our solutions, deployment success, utilization rates by our customers, new product releases and changes to our product offerings. If our customers do not renew their maintenance, SaaS and/or term-license agreements, or renew on less favorable terms, our business, financial condition and operating results may be adversely affected.
26
Table of Contents
Our ability to increase revenue also depends in part on our ability to increase deployment of our solutions by existing customers. Our ability to increase sales to existing customers depends on several factors, including their experience with implementing and using our platform and the existing solutions they have implemented, their ability to integrate our solutions with existing technologies, and our pricing model. A failure to increase sales to existing customers could adversely affect our business, operating results and financial condition.
Failure to effectively expand our sales and marketing capabilities could harm our ability to increase our customer base and achieve broader market acceptance of our applications.
Our ability to increase our customer base and achieve broader market acceptance of our solutions will depend to a significant extent on the ability of our sales and marketing organizations to work together to drive our sales pipeline and cultivate customer and partner relationships to drive revenue growth. We have invested in and plan to continue expanding our sales and marketing organizations, both domestically and internationally. We also plan to dedicate significant resources to sales and marketing programs, including lead generation activities and brand awareness campaigns, such as our industry events, webinars and user events. If we are unable to hire, develop and retain talented sales personnel or marketing personnel or if our new sales personnel or marketing personnel are unable to achieve desired productivity levels in a reasonable period of time, our ability to increase our customer base and achieve broader market acceptance of our applications could be harmed.
We may experience a loss of customers and annualized recurring revenue if customers do not convert from our Classic products to our Dynatrace® platform.
A significant portion of our annualized recurring revenue, or ARR, has been generated from our Classic products. As of March 31, 2018 and March 31, 2019, ARR from our Classic products comprised 70% and 30% of our Total ARR, respectively. We have stopped offering the Classic products to new customers and any increase in ARR for our Dynatrace® platform may not offset a reduction in ARR from our Classic products. Furthermore, our competitors could introduce new products that are more competitive than our Classic products which could result in a loss of customers who do not convert to Dynatrace®. An inability to retain customers on the Classic products or convert them to Dynatrace® may harm our business, operating results and financial condition in the future.
We face significant competition, which may adversely affect our ability to add new customers, retain existing customers and grow our business.
The markets in which we compete are highly competitive, fragmented, evolving, complex and defined by rapidly changing technology and customer demands, and we expect competition to continue to increase in the future. A number of companies have developed or are developing products and services that currently, or in the future may, compete with some or all of our solutions. This competition could result in increased pricing pressure, reduced profit margins, increased sales and marketing expenses and our failure to increase, or loss of, market share, any of which could adversely affect our business, operating results and financial condition.
We compete either directly or indirectly with application performance monitoring vendors such as Cisco AppDynamics, Broadcom, and New Relic, infrastructure monitoring vendors such as Datadog and Nagios, Digital Experience Management vendors such as Akamai and Catchpoint, point solutions from cloud providers such as Amazon Web Services, or AWS, Azure and Google Cloud Platform, and other business intelligence and monitoring and analytics providers that provide some portion of the services that we provide. Our competitors may have longer-term and more extensive relationships with our existing and potential customers that provide them with an advantage in competing for business with those customers. Further, to the extent that one of our competitors establishes or strengthens a
27
Table of Contents
cooperative relationship with, or acquires one or more software application performance monitoring, data analytics, compliance or network visibility vendors, it could adversely affect our ability to compete.
We may also face competition from companies entering our market, which has a relatively low barrier to entry in some segments, including large technology companies that could expand their platforms or acquire one of our competitors. Many existing and potential competitors enjoy substantial competitive advantages, such as:
| | larger sales and marketing budgets and resources; |
| | access to larger customer bases which often provide incumbency advantages; |
| | broader global distribution and presence; |
| | the ability to bundle competitive offerings with other products and services; |
| | greater brand recognition and longer operating histories; |
| | lower labor and development costs; |
| | greater resources to make acquisitions; |
| | larger and more mature intellectual property portfolios; and |
| | substantially greater financial, technical, management and other resources. |
Additionally, in certain circumstances, and particularly among large enterprise technology companies that have complex and large software application and IT infrastructure environments, customers may elect to build in-house solutions to address their software intelligence needs. Any such in-house solutions could leverage open source software, and therefore be made generally available at little or no cost.
These competitive pressures in our markets or our failure to compete effectively may result in fewer customers, price reductions, fewer orders, reduced revenue and gross profit, and loss of market share. Any failure to meet and address these factors could materially and adversely affect our business, operating results and financial condition.
If the prices we charge for our solutions and services are unacceptable to our customers, our operating results will be harmed.
As the market for our solutions matures, or as new or existing competitors introduce new products or services that compete with ours, we may experience pricing pressure and be unable to renew our agreements with existing customers or attract new customers at prices that are consistent with our current pricing model and operating budget. If this were to occur, it is possible that we would have to change our pricing model or reduce our prices, which could harm our revenue, gross margin and operating results. Pricing decisions may also impact the mix of adoption among our licensing and subscription models, and negatively impact our overall revenue. Moreover, large enterprises, which we expect will account for a large portion of our business in the future, may demand substantial price concessions. If we are, for any reason, required to reduce our prices, our revenue, gross margin, profitability, financial position and cash flow may be adversely affected.
We expect our billings and revenue mix to vary over time, which could harm our gross margin and operating results.
We expect our billings and revenue mix to vary over time due to a number of factors, including the mix of perpetual licenses, SaaS subscriptions, term licenses, the mix of solutions sold and the
28
Table of Contents
contract length of our customer agreements. Due to the differing revenue recognition policies applicable to our term licenses, SaaS subscription, perpetual licenses and professional services, shifts in the mix between subscription, term and perpetual licenses from quarter to quarter could produce substantial variation in revenues recognized even if our billings remain consistent. Further, our gross margins and operating results could be harmed by changes in billings and revenue mix and costs, together with numerous other factors, including: entry into new lower margin markets or growth in lower margin markets; entry into markets with different pricing and cost structures; pricing discounts; and increased price competition. Any one of these factors or the cumulative effects of certain of these factors may result in significant fluctuations in our revenues, billings, gross margin and operating results. This variability and unpredictability could result in our failure to meet internal expectations or those of securities analysts or investors for a particular period. If we fail to meet or exceed such expectations for these or any other reasons, the market price of our common stock could decline.
Because we recognize revenue from our SaaS subscriptions and term licenses over the subscription or license term, downturns or upturns in new sales and renewals may not be immediately reflected in our operating results and may be difficult to discern.
For customers who purchase a SaaS subscription or term license, we generally recognize revenue from customers ratably over the terms of their subscriptions. A portion of the revenue we report in each quarter is derived from the recognition of revenue relating to subscriptions and term licenses entered into during previous quarters. Consequently, a decline in new or renewed subscriptions or term licenses in any single quarter may have a small impact on our revenue for that quarter. However, such a decline will negatively affect our revenue in future quarters. Accordingly, the effect of significant downturns in sales and market acceptance of our solutions, and potential changes in our rate of renewals, may not be fully reflected in our results of operations until future periods. In addition, a significant majority of our costs are expensed as incurred, while revenue is recognized over the life of the agreement with our customer. As a result, increased growth in the number of our customers could continue to result in our recognition of more costs than revenue in the earlier periods of the terms of our agreements.
Our revenue recognition policy and other factors may distort our financial results in any given period and make them difficult to predict.
Under accounting standards update No. 2014-09 (Topic 606), Revenue from Contracts with Customers, or ASC 606, we recognize revenue when our customer obtains control of goods or services in an amount that reflects the consideration that we expect to receive in exchange for those goods or services. Our subscription revenue consists of (i) SaaS agreements, (ii) term-based licenses for the Dynatrace® platform which are recognized ratably over the contract term, (iii) Dynatrace® perpetual license revenue that is recognized ratably or over the term of the expected optional maintenance renewals, which is generally three years, and (iv) maintenance and support agreements. A significant increase or decline in our subscription contracts in any one quarter may not be fully reflected in the results for that quarter, but will affect our revenue in future quarters. Our license revenue consists of Classic perpetual license fees and Classic term license fees, which are generally recognized on delivery. Because license revenue is recognized upfront, a single, large license in a given period may distort our operating results for that period. These factors make it challenging to forecast our revenue for future periods, as both the mix of solutions and services we will sell in a given period, as well as the size of contracts, is difficult to predict.
Furthermore, the presentation of our financial results requires us to make estimates and assumptions that may affect revenue recognition. In some instances, we could reasonably use different estimates and assumptions, and changes in estimates are likely to occur from period to period. See Managements Discussion and Analysis of Financial Condition and Results of OperationsCritical Accounting PoliciesRevenue Recognition.
29
Table of Contents
Given the foregoing factors, our actual results could differ significantly from our estimates, comparing our revenue and operating results on a period-to-period basis may not be meaningful, and our past results may not be indicative of our future performance.
Changes in existing financial accounting standards or practices, or taxation rules or practices, may harm our operating results.
Changes in existing accounting or taxation rules or practices, new accounting pronouncements or taxation rules, or varying interpretations of current accounting pronouncements or taxation practice could harm our operating results or result in changes to the manner in which we conduct our business. Further, such changes could potentially affect our reporting of transactions completed and reported before such changes are effective.
United States Generally Accepted Accounting Principles, or GAAP, are subject to interpretation by the Financial Accounting Standards Board, or FASB, the Securities and Exchange Commission and various bodies formed to promulgate and interpret appropriate accounting principles. A change in these principles or a change in these interpretations could have a significant effect on our reported financial results and could affect the reporting of transactions completed before the announcement of a change.
If we are unable to maintain successful relationships with our partners, or if our partners fail to perform, our ability to market, sell and distribute our applications and services will be limited, and our business, operating results and financial condition could be harmed.
In addition to our sales force, we rely on partners, including our strategic partners to increase our sales and distribution of our software and services. We also have independent software vendor partners whose integrations may increase the breadth of the ecosystem in which our solutions can operate, and the size of the market that our solutions can address. We are dependent on these partner relationships to contribute to our sales growth. We expect that our future growth will be increasingly dependent on the success of our partner relationships, and if those partnerships do not provide such benefits, our ability to grow our business will be harmed. If we are unable to scale our partner relationships effectively, or if our partners are unable to serve our customers effectively, we may need to expand our services organization, which could adversely affect our results of operations.
Our agreements with our partners are generally non-exclusive, meaning our partners may offer products from several different companies to their customers or have their products or technologies also interoperate with products and technologies of other companies, including products that compete with our offerings. Moreover, some of our partners also compete with us. If our partners do not effectively market and sell our offerings, choose to use greater efforts to market and sell their own products or those of our competitors or fail to meet the needs of our customers, our ability to grow our business and sell our offerings will be harmed. Furthermore, our partners may cease marketing our offerings with limited or no notice and with little or no penalty, and new partners could require extensive training and may take several months or more to achieve productivity. The loss of a substantial number of our partners, our possible inability to replace them or the failure to recruit additional partners could harm our results of operations. Our partner structure could also subject us to lawsuits or reputational harm if, for example, a partner misrepresents the functionality of our offerings to customers or violates applicable laws or our corporate policies.
Interruptions with the delivery of our SaaS solutions, or third-party cloud-based systems that we use in our operations, may adversely affect our business, operating results and financial condition.
Our continued growth depends on the ability of our customers to access our platform and solutions, particularly our cloud-based solutions, at any time and within an acceptable amount of time.
30
Table of Contents
In addition, our ability to access certain third-party SaaS solutions is important to our operations and the delivery of our customer support and professional services, as well as our sales operations.
We have experienced, and may in the future experience, service disruptions, outages and other performance problems both in the delivery of our SaaS solutions, and in third-party SaaS solutions we use due to a variety of factors, including infrastructure changes, malicious actors, human or software errors or capacity constraints. We utilize a multi-tenant structure, meaning that, generally, our customers are hosted on a shared platform. As such, any interruption in service would affect a significant number of our customers. In some instances, we or our third-party service providers may not be able to identify the cause or causes of these performance problems within an acceptable period of time. It may become increasingly difficult to maintain and improve the performance of our SaaS solutions as they become more complex. If our SaaS solutions are unavailable or if our customers are unable to access features of our SaaS solutions within a reasonable amount of time or at all, our business would be negatively affected. In addition, if any of the third-party SaaS solutions that we use were to experience a significant or prolonged outage or security breach, our business could be adversely affected.
We currently host our Dynatrace® solutions primarily using AWS, as well as other providers of cloud infrastructure services including Microsoft Azure, Interoute and Alibaba. Our Dynatrace® solutions reside on hardware operated by these providers. Our operations depend on protecting the virtual cloud infrastructure hosted in AWS by maintaining its configuration, architecture, features and interconnection specifications, as well as the information stored in these virtual data centers and which third-party internet service providers transmit. Although we have disaster recovery plans, including the use of multiple AWS locations, any incident affecting AWS infrastructure that may be caused by fire, flood, severe storm, earthquake or other natural disasters, cyber-attacks, terrorist or other attacks, and other similar events beyond our control could negatively affect our platform and our ability to deliver our solutions to our customers. A prolonged AWS service disruption affecting our SaaS platform for any of the foregoing reasons would negatively impact our ability to serve our customers and could damage our reputation with current and potential customers, expose us to liability, cause us to lose customers or otherwise harm our business. We may also incur significant costs for using alternative equipment or taking other actions in preparation for, or in reaction to, events that damage the AWS services we use.
AWS has the right to terminate our agreement upon material uncured breach on 30 days prior written notice. In the event that our AWS service agreements are terminated, or there is a lapse of service, we would experience interruptions in access to our platform as well as significant delays and additional expense in arranging new facilities and services and/or re-architecting our solutions for deployment on a different cloud infrastructure, which would adversely affect our business, operating results and financial condition.
Real or perceived errors, failures, defects or vulnerabilities in our solutions could adversely affect our financial results and growth prospects.
Our solutions and underlying platform are complex, and in the past, we or our customers have discovered software errors, failures, defects and vulnerabilities in our solutions after they have been released, including after new versions or updates are released. Our solutions and our platform are often deployed and used in large-scale computing environments with different operating systems, system management software and equipment and networking configurations, which have in the past, and may in the future, cause errors in, or failures of, our solutions or other aspects of the computing environment into which they are deployed. In addition, deployment of our solutions into complicated, large-scale computing environments have in the past exposed, and may, in the future, expose undetected errors, failures, defects or vulnerabilities in our solutions. Despite testing by us, errors, failures, defects or vulnerabilities may not be found in our solutions until they are released to our
31
Table of Contents
customers or thereafter. Real or perceived errors, failures, defects or vulnerabilities in our solutions could result in, among other things, negative publicity and damage to our reputation, lower renewal rates, loss of or delay in market acceptance of our solutions, loss of competitive position or claims by customers for losses sustained by them or expose us to breach of contract claims, regulatory fines and related liabilities. In such an event, we may be required, or may choose, for customer relations or other reasons, to expend additional resources in order to help correct the problem.
Security breaches, computer malware, computer hacking attacks and other security incidents could harm our business, reputation, brand and operating results.
Security incidents have become more prevalent across industries and may occur on our systems, or on the systems of third parties we use to host our solutions or SaaS solutions that we use in the operation of our business. These security incidents may be caused by or result in but are not limited to security breaches, computer malware or malicious software, ransomware, computer hacking, denial of service attacks, security system control failures in our own systems or from vendors we use, email phishing, software vulnerabilities, social engineering, sabotage and drive-by downloads. In particular, because we utilize a multi-tenant platform, any security breach would affect a significant amount of our customers. Such security incidents, whether intentional or otherwise, may result from actions of hackers, criminals, nation states, vendors, employees, contractors, customers or other threat actors. We have experienced two email phishing attacks that resulted in the compromise of a limited number of email accounts. Although we have taken a number of measures to prevent future phishing attacks, we cannot be certain that our efforts will be effective.
We may in the future experience disruptions, outages and other performance problems on our internal systems due to service attacks, unauthorized access or other security related incidents. Any security breach or loss of system control caused by hacking, which involves efforts to gain unauthorized access to information or systems, or to cause intentional malfunctions or loss, modification or corruption of data, software, hardware or other computer equipment and the inadvertent transmission of computer malware could harm our business, operating results and financial condition, and expose us to claims arising from loss or unauthorized disclosure of confidential or personal information and the related breach of privacy or data security laws. If an actual or perceived security incident occurs, the market perception of the effectiveness of our security controls could be harmed, our brand and reputation could be damaged, we could lose customers, and we could suffer financial exposure due to such events or in connection with remediation efforts, investigation costs, regulatory fines, private lawsuits and changed security control, system architecture and system protection measures.
We may in the future experience disruptions, outages and other performance problems on the systems that we host for our customers due to service attacks, unauthorized access or other security related incidents. Any security breach or loss of system control caused by hacking, which involves efforts to gain unauthorized access to information or systems, or to cause intentional malfunctions or loss, modification or corruption of data, software, hardware or other computer equipment and the inadvertent transmission of computer malware could disrupt the services that we provide to our customers, harm our customers business, operating results and financial condition, and expose us to claims from our customers for the damages that result, which could include, without limitation, claims arising from loss or unauthorized access, acquisition or disclosure of personal information and the related breach of privacy or data security laws. If an actual or perceived security incident occurs, the market perception of the effectiveness of our security controls could be harmed, our brand and reputation could be damaged, we could lose customers, and we could suffer financial exposure due to such events or in connection with remediation efforts, investigation costs, regulatory fines, private lawsuits and changed security control, system architecture and system protection measures.
32
Table of Contents
We believe that our brand is integral to our future success and if we fail to cost-effectively promote or protect our brand, our business and competitive position may be harmed.
We believe that maintaining and enhancing our brand and increasing market awareness of our company and our solutions are critical to achieving broad market acceptance of our existing and future solutions and are important elements in attracting and retaining customers, partners and employees, particularly as we continue to expand internationally. In addition, independent industry analysts, such as Gartner and Forrester, often provide reviews of our solutions, as well as those of our competitors, and perception of our solutions in the marketplace may be significantly influenced by these reviews. We have no control over what these or other industry analysts report, and because industry analysts may influence current and potential customers, our brand could be harmed if they do not provide a positive review of our solutions or view us as a market leader.
The successful promotion of our brand and the markets awareness of our solutions and platform will depend largely upon our ability to continue to offer enterprise-grade software intelligence solutions, our ability to be thought leaders in application intelligence, our marketing efforts and our ability to successfully differentiate our solutions from those of our competitors. We have invested, and expect to continue to invest, substantial resources to promote and maintain our brand and generate sales leads, both domestically and internationally, but there is no guarantee that our brand development strategies will enhance the recognition of our brand or lead to increased sales. If our efforts to promote and maintain our brand are not cost-effective or successful, our operating results and our ability to attract and retain customers, partners and employees may be adversely affected. In addition, even if our brand recognition and customer loyalty increases, this may not result in increased sales of our solutions or higher revenue.
Our sales cycles can be long, unpredictable and vary seasonally, which can cause significant variation in the number and size of transactions that close in a particular quarter.
Our results of operations may fluctuate, in part, because of the resource-intensive nature of our sales efforts, the length and variability of the sales cycle for our platform and the difficulty in making short-term adjustments to our operating expenses. Many of our customers are large enterprises, whose purchasing decisions, budget cycles and constraints and evaluation processes are unpredictable and out of our control. Further, the timing of our sales is difficult to predict. The length of our sales cycle, from initial evaluation to payment for our subscriptions can range from several months to over a year and can vary substantially from customer to customer. Our sales efforts involve significant investment in resources in field sales, partner development, marketing and educating our customers about the use, technical capabilities and benefits of our platform and services. Customers often undertake a prolonged evaluation process, which frequently involves not only our platform but also those of other companies or the consideration of internally developed alternatives including those using open-source software. Some of our customers initially deploy our platform on a limited basis, with no guarantee that these customers will deploy our platform widely enough across their organization to justify our substantial pre-sales investment. As a result, it is difficult to predict exactly when, or even if, we will make a sale to a potential customer or if we can increase sales to our existing customers. Large individual sales have, in some cases, occurred in quarters subsequent to those we anticipated, or have not occurred at all. If our sales cycle lengthens or our substantial upfront investments do not result in sufficient revenue to justify our investments, our operating results could be adversely affected.
We have experienced seasonal and end-of-quarter concentration of our transactions and variations in the number and size of transactions that close in a particular quarter, which impacts our ability to grow revenue over the long term and plan and manage cash flows and other aspects of our business and cost structure. Our transactions vary by quarter, with the third fiscal quarter typically
33
Table of Contents
being our largest. In addition, within each quarter, a significant portion of our transactions occur in the last two weeks of that quarter. If expectations for our business turn out to be inaccurate, our revenue growth may be adversely affected over time and we may not be able to adjust our cost structure on a timely basis and our cash flows may suffer.
Any failure to offer high-quality customer support and professional services may adversely affect our relationships with our customers and our financial results.
We typically bundle customer support with arrangements for our solutions, and offer professional services for implementation and training. In deploying and using our platform and solutions, our customers require the assistance of our services teams to resolve complex technical and operational issues. Increased customer demand for support, without corresponding revenue, could increase costs and adversely affect our operating results. We may also be unable to respond quickly enough to accommodate short-term increases in customer demand for support. If we fail to meet our service level commitments, which relate to uptime, response times and escalation procedures, and time to problem resolution, or if we suffer extended periods of unavailability for our solutions, we may be contractually obligated to provide these customers with service credits or penalties, refunds for prepaid amounts related to unused subscription services, or we could face contract terminations. Our sales are highly dependent on our reputation and on positive recommendations from our existing customers. Any failure to maintain high-quality customer support, or a market perception that we do not maintain high-quality product support, could adversely affect our reputation, and our ability to sell our solutions to existing and new customers.
Our ability to succeed depends on the experience and expertise of our senior management team. If we are unable to retain and motivate our personnel, our business, operating results and prospects may be harmed.
Our ability to succeed depends in significant part on the experience and expertise of our senior management team. The members of our senior management team are employed on an at-will basis, which means that they are not contractually obligated to remain employed with us and could terminate their employment with us at any time. Accordingly, and in spite of our efforts to retain our senior management team, any member of our senior management team could terminate his or her employment with us at any time and go to work for one of our competitors, after the expiration of any applicable non-compete period. The loss of one or more members of our senior management team, particularly if closely grouped, could adversely affect our ability to execute our business plan and thus, our business, operating results and prospects. We do not maintain key man insurance on any of our officers, and we may not be able to find adequate replacements. If we fail to identify, recruit and integrate strategic hires, our business, operating results and financial condition could be adversely affected.
We rely on highly skilled personnel and, if we are unable to attract, retain or motivate substantial numbers of qualified personnel or expand and train our sales force, we may not be able to grow effectively.
Our success largely depends on the talents and efforts of key technical, sales and marketing employees and our future success depends on our continuing ability to identify, hire, develop, motivate and retain highly skilled personnel for all areas of our organization. Competition in our industry is intense and often leads to increased compensation and other personnel costs. In addition, competition for employees with experience in our industry can be intense, particularly in Europe, where our research and development operations are concentrated and where other technology companies compete for management and engineering talent. Our continued ability to compete and grow effectively depends on our ability to attract substantial numbers of qualified new employees and to retain and motivate our existing employees.
34
Table of Contents
We believe that our corporate culture has contributed to our success, and if we cannot successfully maintain our culture as we grow, we could lose the innovation, creativity and teamwork fostered by our culture.
We believe that a critical component to our success has been our corporate culture. We believe our culture has contributed significantly to our ability to innovate and develop new technologies. We have spent substantial time and resources in building our team while maintaining this corporate culture. We have experienced rapid growth in our employee headcount and international presence. The rapid influx of large numbers of people from different business backgrounds in different geographic locations may make it difficult for us to maintain our corporate culture of innovation. If our culture is negatively affected, our ability to support our growth and innovation may diminish.
We are subject to a number of risks associated with global sales and operations.
Revenue from customers located outside of the United States represented 42%, 46%, and 46% of our total revenue for the years ended March 31, 2017, 2018, and 2019, respectively. As a result, our sales and operations are subject to a number of risks and additional costs, including the following:
| | increased expenses associated with international sales and operations, including establishing and maintaining office space and equipment for our international operations; |
| | fluctuations in exchange rates between currencies in the markets where we do business; |
| | risks associated with trade restrictions and additional legal requirements, including the exportation of our technology or source code that is required in some of the countries in which we operate; |
| | greater risk of unexpected changes in regulatory rules, regulations and practices, tariffs and tax laws and treaties; |
| | compliance with United States and foreign import and export control and economic sanctions laws and regulations, including the Export Administration Regulations administered by the United States Department of Commerces Bureau of Industry and Security and the executive orders and laws implemented by the United States Department of the Treasurys Office of Foreign Asset Controls; |
| | compliance with anti-bribery laws, including the United States Foreign Corrupt Practices Act, and the U.K. Anti-Bribery Act; |
| | compliance with privacy, data protection and data security laws of many countries, including the General Data Protection Regulation, or GDPR, adopted by the European Union, or EU, and which became effective in May 2018; |
| | heightened risk of unfair or corrupt business practices in certain geographies, and of improper or fraudulent sales arrangements that may impact financial results and result in restatements of, or irregularities in, financial statements; |
| | limited or uncertain protection of intellectual property rights in some countries and the risks and costs associated with monitoring and enforcing intellectual property rights abroad; |
| | greater difficulty in enforcing contracts and managing collections in certain jurisdictions, as well as longer collection periods; |
| | management communication and integration problems resulting from cultural and geographic dispersion; |
| | social, economic and political instability, terrorist attacks and security concerns in general; and |
| | potentially adverse tax consequences. |
35
Table of Contents
These and other factors could harm our ability to generate future global revenue and, consequently, materially impact our business, results of operations and financial condition.
Economic conditions and regulatory changes leading up to and following the United Kingdoms scheduled exit from the European Union could have a material adverse effect on our business and results of operations.
The United Kingdom, or U.K., government has commenced the legal process of leaving the European Union, typically referred to as Brexit. There remains significant uncertainty about when and how the U.K. will officially exit the European Union, if at all, and the possible effects of Brexit including but not limited to, the imposition of trade barriers and increased costs throughout Europe, changes in European manufacturing and employment markets, and currency fluctuations. While the full effects of Brexit will not be known for some time, Brexit could cause disruptions to, and create uncertainty surrounding, our business and results of operations. The most immediate effect of the expected Brexit has been significant volatility in global equity and debt markets and currency exchange rate fluctuations. Ongoing global market volatility and a deterioration in economic conditions due to uncertainty surrounding Brexit, could significantly disrupt the markets in which we operate and lead our customers to closely monitor their costs and delay capital spending decisions.
Additionally, the expected Brexit has resulted in the immediate strengthening of the U.S. dollar against foreign currencies in which we conduct business. Although this strengthening has been somewhat ameliorated by the British Governments stated desire to accomplish a transitional exit, because we translate revenue denominated in foreign currency into U.S. dollars for our financial statements, during periods of a strengthening U.S. dollar, our reported revenue from foreign operations is reduced. As a result of Brexit and the continued negotiations within the U.K., there may be further periods of volatility in the currencies in which we conduct business.
The effects of Brexit will depend on any agreements the U.K. makes to retain access to EU markets, either during a transitional period or more permanently. The measures could potentially disrupt the markets we serve and may cause us to lose customers and employees. In addition, Brexit could lead to legal uncertainty and potentially divergent national laws and regulations as the U.K. determines which EU laws to replace or replicate.
Any of these effects of Brexit could materially adversely affect our business, results of operations and financial condition.
We may face exposure to foreign currency exchange rate fluctuations.
We have transacted in foreign currencies and expect to transact in foreign currencies in the future. In addition, our international subsidiaries maintain assets and liabilities that are denominated in currencies other than the functional operating currencies of these entities. Accordingly, changes in the value of foreign currencies relative to the U.S. dollar will affect our revenue and operating results due to transactional and translational remeasurement that is reflected in our earnings. As a result of such foreign currency exchange rate fluctuations, it could be more difficult to detect underlying trends in our business and results of operations. In addition, to the extent that fluctuations in currency exchange rates cause our results of operations to differ from our expectations or the expectations of our investors, the trading price of our common stock could be adversely affected. We do not currently maintain a program to hedge transactional exposures in foreign currencies. However, in the future, we may use derivative instruments, such as foreign currency forward and option contracts, to hedge certain exposures to fluctuations in foreign currency exchange rates. The use of such hedging activities may not offset any or more than a portion of the adverse financial effects of unfavorable movements in foreign exchange rates over the limited time the hedges are in place. Moreover, the use of hedging
36
Table of Contents
instruments may introduce additional risks if we are unable to structure effective hedges with such instruments.
Assertions by third parties of infringement or other violations by us of their intellectual property rights, or other lawsuits brought against us, could result in significant costs and substantially harm our business, operating results and financial condition.
Patent and other intellectual property disputes are common in the markets in which we compete. Some companies in the markets in which we compete, including some of our competitors, own large numbers of patents, copyrights, trademarks and trade secrets, which they may use to assert claims of infringement, misappropriation or other violations of intellectual property rights against us, our partners, our technology partners or our customers. As the number of patents and competitors in our market increase, allegations of infringement, misappropriation and other violations of intellectual property rights may also increase. Our broad solution portfolio and the competition in our markets further exacerbate the risk of additional third-party intellectual property claims against us in the future. Any allegation of infringement, misappropriation or other violation of intellectual property rights by a third party, even those without merit, could cause us to incur substantial costs and resources defending against the claim, could distract our management from our business, and could cause uncertainty among our customers or prospective customers, all of which could have an adverse effect on our business, operating results and financial condition. We cannot assure you that we are not infringing or otherwise violating any third-party intellectual property rights.
Furthermore, companies that bring allegations against us may have the capability to dedicate substantially greater resources to enforce their intellectual property rights and to defend against similar allegations that may be brought against them than we do. We have received, and may in the future receive, notices alleging that we have misappropriated, misused or infringed other parties intellectual property rights, including allegations made by our competitors, and, to the extent we gain greater market visibility, we face a higher risk of being the subject of intellectual property infringement assertions. There also is a market for acquiring third-party intellectual property rights and a competitor, or other entity, could acquire third-party intellectual property rights and pursue similar assertions based on the acquired intellectual property. They may also make such assertions against our customers or partners.
An adverse outcome of a dispute may require us to take several adverse steps such as: pay substantial damages, including potentially treble damages, if we are found to have willfully infringed a third partys patents or copyrights; cease making, using, selling, licensing, importing or otherwise commercializing solutions that are alleged to infringe or misappropriate the intellectual property of others; expend additional development resources to attempt to redesign our solutions or otherwise to develop non-infringing technology, which may not be successful; enter into potentially unfavorable royalty or license agreements in order to obtain the right to use necessary technologies or intellectual property rights or have royalty obligations imposed by a court; or indemnify our customers, partners and other third parties. Any damages or royalty obligations we may become subject to, any prohibition against our commercializing our solutions as a result of an adverse outcome could harm our business and operating results.
Additionally, our agreements with customers and partners include indemnification provisions, under which we agree to indemnify them for losses suffered or incurred as a result of allegations of intellectual property infringement and, in some cases, for damages caused by us to property or persons or other third-party allegations. Furthermore, we have agreed in certain instances to defend our partners against third-party claims asserting infringement of certain intellectual property rights, which may include patents, copyrights, trademarks or trade secrets, and to pay judgments entered on such assertions. Large indemnity payments could harm our business, operating results and financial condition.
37
Table of Contents
Failure to protect and enforce our proprietary technology and intellectual property rights could substantially harm our business, operating results and financial condition.
The success of our business depends on our ability to protect and enforce our proprietary rights, including our patents, trademarks, copyrights, trade secrets and other intellectual property rights, throughout the world. We attempt to protect our intellectual property under patent, trademark, copyright and trade secret laws, and through a combination of confidentiality procedures, contractual provisions and other methods, all of which offer only limited protection. However, the steps we take to protect our intellectual property may be inadequate. We will not be able to protect our intellectual property if we are unable to enforce our rights or if we do not detect unauthorized use of our intellectual property. Despite our precautions, it may be possible for unauthorized third parties to copy our technology and use information that we regard as proprietary to create products and services that compete with ours. In the past, we have been made aware of public postings of portions of our source code. It is possible that released source code could reveal some of our trade secrets, and impact our competitive advantage. Some license provisions protecting against unauthorized use, copying, transfer, reverse engineering, and disclosure of our technology may be unenforceable under the laws of certain jurisdictions and foreign countries. Further, the laws of some countries do not protect proprietary rights to the same extent as the laws of the United States. In expanding our international activities, our exposure to unauthorized copying and use of our technology and proprietary information may increase.
As of March 31, 2019, we had 58 issued patents, all of which are in the United States, and 25 pending applications, of which 17 are in the United States. Our issued patents expire at various dates through July 2037. The process of obtaining patent protection is expensive and time-consuming, and we may not be able to prosecute all necessary or desirable patent applications at a reasonable cost or in a timely manner. We may choose not to seek patent protection for certain innovations and may choose not to pursue patent protection in certain jurisdictions. Furthermore, it is possible that our patent applications may not result in issued patents, that the scope of the claims in our issued patents will be insufficient or not have the coverage originally sought, that our issued patents will not provide us with any competitive advantages, and that our issued patents and other intellectual property rights may be challenged by others or invalidated through administrative process or litigation. In addition, issuance of a patent does not guarantee that we have an absolute right to practice our patented technology, or that we have the right to exclude others from practicing our patented technology. As a result, we may not be able to obtain adequate patent protection or to enforce our issued patents effectively.
In addition to patented technology, we rely on our unpatented proprietary technology and trade secrets. Despite our efforts to protect our proprietary technology and trade secrets, unauthorized parties may attempt to misappropriate, reverse engineer or otherwise obtain and use them. The contractual provisions that we enter into with employees, consultants, partners, vendors and customers may not prevent unauthorized use or disclosure of our proprietary technology or trade secrets and may not provide an adequate remedy in the event of unauthorized use or disclosure of our proprietary technology or trade secrets.
Moreover, policing unauthorized use of our technologies, solutions and intellectual property is difficult, expensive and time-consuming, particularly in foreign countries where the laws may not be as protective of intellectual property rights as those in the United States and where mechanisms for enforcement of intellectual property rights may be weak. We may be unable to determine the extent of any unauthorized use or infringement of our solutions, technologies or intellectual property rights.
From time to time, legal action by us may be necessary to enforce our patents and other intellectual property rights, to protect our trade secrets, to determine the validity and scope of the intellectual property rights of others or to defend against allegations of infringement or invalidity. Such litigation could result in substantial costs and diversion of resources and could negatively affect our
38
Table of Contents
business, operating results, financial condition and cash flows. If we are unable to protect our intellectual property rights, our business, operating results and financial condition will be harmed.
Our use of open source technology could impose limitations on our ability to commercialize our solutions and platform and application intelligence software platform.
We use open source software in our solutions and platform and expect to continue to use open source software in the future. Although we monitor our use of open source software to avoid subjecting our solutions and platform to conditions we do not intend, we may face allegations from others alleging ownership of, or seeking to enforce the terms of, an open source license, including by demanding release of the open source software, derivative works, or our proprietary source code that was developed using such software. These allegations could also result in litigation. The terms of many open source licenses have not been interpreted by U.S. courts. As a result, there is a risk that these licenses could be construed in a way that could impose unanticipated conditions or restrictions on our ability to commercialize our solutions. In such an event, we could be required to seek licenses from third parties to continue offering our solutions, to make our proprietary code generally available in source code form, to re-engineer our solutions or to discontinue the sale of our solutions if re-engineering could not be accomplished on a timely basis, any of which could adversely affect our business, operating results and financial condition.
Our participation in open source initiatives may limit our ability to enforce our intellectual property rights in certain circumstances.
As part of our strategy to broaden our target markets and accelerate adoption of our products, we contribute software program code to certain open source projects, managed by organizations such as Microsoft, Google and Cloud Native Computing Foundation. We also undertake our own open source initiatives to promote open innovation and enterprise openness, meaning that we make technologies available under open source licenses with the goal of exchanging insights and experience with other experts in the community, broadening the adoption of our platform by our customers, and providing our partners with the ability to leverage their own technologies through the Dynatrace® platform. In some cases, we accept contributions of code from the community, our customers and partners.
When we contribute to a third-party managed open source project, the copyrights, patent rights and other proprietary rights in and to the technologies, including software program code, owned by us that we contribute to these projects are licensed to the project managers and to all other contributing parties without restriction on further use or distribution. If and to the extent that any of the technologies that we contribute, either alone or in combination with the technologies that may be contributed by others, practice any inventions that are claimed under our patents or patent applications, then we may be unable to enforce those claims or prevent others from practicing those inventions, regardless of whether such other persons also contributed to the open source project (even if we were to conclude that their use infringes our patents with competing offerings), unless any such third party asserts its patent rights against us. This limitation on our ability to assert our patent rights against others could harm our business and ability to compete. In addition, if we were to attempt to enforce our patent rights, we could suffer reputational injury among our customers and the open source community.
Our sales to government entities are subject to a number of challenges and risks.
We sell our solutions to U.S. federal and state and foreign governmental agency customers, often through our resellers, and we may increase sales to government entities in the future. Sales to government entities are subject to a number of challenges and risks. Selling to government entities can be highly competitive, expensive and time consuming, often requiring significant upfront time and
39
Table of Contents
expense without any assurance that these efforts will generate a sale. Contracts and subcontracts with government agency customers are subject to procurement laws and regulations relating to the award, administration, and performance of those contracts. Government demand and payment for our solutions are affected by public sector budgetary cycles and funding authorizations, with funding reductions or delays adversely affecting public sector demand for our solutions. We may be subject to audit or investigations relating to our sales to government entities, and any violations could result in various civil and criminal penalties and administrative sanctions, including termination of contracts, refunds of fees received, forfeiture of profits, suspension of payments, fines, and suspension or debarment from future government business. Government entities may have statutory, contractual or other legal rights to terminate contracts with our distributors and resellers for convenience or due to a default. Any of these risks relating to our sales to governmental entities could adversely impact our future sales and operating results.
We may acquire other businesses, products or technologies in the future which could require significant management attention, disrupt our business, dilute shareholder value and adversely affect our results of operations.
As part of our business growth strategy and in order to remain competitive, we may acquire, or make investments in, complementary companies, products or technologies. For example, in 2017 we acquired Qumram AG, a provider of session replay technology that captures end users digital experiences across browsers, interfaces and devices. We may not be able to find suitable acquisition targets in the future, and we may not be able to complete such acquisitions on favorable terms, if at all. If we do complete acquisitions, we may not ultimately strengthen our competitive position or achieve our goals, and any acquisitions we complete could be viewed negatively by our customers, securities analysts and investors. In addition, if we are unsuccessful at integrating such acquisitions or the technologies associated with such acquisitions, our revenue and results of operations could be adversely affected. In addition, while we will make significant efforts to address any information technology security and privacy compliance issues with respect to any acquisitions, we may still inherit such risks when we integrate the acquired products and systems. Any integration process may require significant time and resources, and we may not be able to manage the process successfully. We may not successfully evaluate or utilize the acquired technology or personnel, or accurately forecast the financial impact of an acquired business, including accounting charges. We may have to pay cash, incur debt or issue equity securities to pay for any such acquisitions, each of which could adversely affect our financial condition or the value of our ordinary shares. The sale of equity or issuance of debt to finance any such acquisitions could result in dilution to our shareholders. The incurrence of indebtedness would result in increased fixed obligations and could also include covenants or other restrictions that would impede our ability to manage our operations.
Our business is subject to a wide range of laws and regulations and our failure to comply with those laws and regulations could harm our business, operating results and financial condition.
Our business is subject to regulation by various federal, state, local and foreign governmental agencies, including agencies responsible for monitoring and enforcing employment and labor laws, workplace safety, product safety, environmental laws, consumer protection laws, privacy and data protection laws, anti-bribery laws, import and export controls, federal securities laws and tax laws and regulations. In certain foreign jurisdictions, these regulatory requirements may be more stringent than those in the United States. These laws and regulations are subject to change over time and we must continue to monitor and dedicate resources to ensure continued compliance. Non-compliance with applicable regulations or requirements could subject us to litigation, investigations, sanctions, mandatory product recalls, enforcement actions, disgorgement of profits, fines, damages, civil and criminal penalties or injunctions. If any governmental sanctions are imposed, or if we do not prevail in any possible civil or criminal litigation, our business, operating results, and financial condition could be
40
Table of Contents
materially adversely affected. In addition, responding to any action will likely result in a significant diversion of managements attention and resources and an increase in professional fees. Enforcement actions and sanctions could harm our business, operating results and financial condition.
Any actual or perceived failure by us to comply with our privacy policy or legal or regulatory requirements in one or multiple jurisdictions could result in proceedings, actions or penalties against us.
We are subject to federal, state, and international laws, regulations and standards relating to the collection, use, disclosure, retention, security, transfer and other processing of personal data. The legal and regulatory framework for privacy, data protection and security issues worldwide is rapidly evolving and as a result implementation standards, potential fines, enforcement practices and litigation risks are likely to remain uncertain for the foreseeable future.
Internationally, virtually every jurisdiction in which we operate has established its own privacy, data protection and/or data security legal framework with which we or our customers must comply, including but not limited to the EU. The EUs data protection landscape is currently unstable, resulting in possible significant operational costs for internal compliance and risk to our business. In addition, the EU has adopted the GDPR, which went into effect on May 25, 2018 and contains numerous requirements and changes from prior EU law, including more robust obligations on data processors and heavier documentation requirements for data protection compliance programs by companies. Specifically, the GDPR introduced numerous privacy-related changes for companies operating in the EU, including heightened notice and consent requirements, greater control for data subjects (e.g., the right to be forgotten), increased data portability for EU consumers, additional data breach notification and data security requirements, requirements for engaging third-party processors, and increased fines. In particular, under the GDPR, fines of up to 20 million euros or up to 4% of the annual global revenue of the noncompliant company, whichever is greater, could be imposed for violations of certain of the GDPRs requirements. The GDPR also confers a private right of action on data subjects and consumer associations to lodge complaints with supervisory authorities, seek judicial remedies and obtain compensation for damages. The GDPR applies to any company established in the European Union as well as any company outside the European Union that processes personal data in connection with the offering of goods or services to individuals in the European Union or the monitoring of their behavior. Moreover, the GDPR requirements apply not only to third-party transactions, but also to transfers of information between us and our subsidiaries, including employee information.
In addition to the GDPR, the European Union also is considering another draft data protection regulation. The proposed regulation, known as the Regulation on Privacy and Electronic Communications, or ePrivacy Regulation, would replace the current ePrivacy Directive. Originally planned to be adopted and implemented at the same time as the GDPR, the ePrivacy Regulation will likely be enacted sometime in the latter part of 2019. While the new regulation contains protections for those using communications services (for example, protections against online tracking technologies), the potential timing of its enactment significantly later than the GDPR means that additional time and effort may need to be spent addressing differences between the ePrivacy Regulation and the GDPR. New rules related to the ePrivacy Regulation are likely to include enhanced consent requirements in order to use communications content and communications metadata, as well as obligations and restrictions on the processing of data from an end-users terminal equipment, which may negatively impact our product offerings and our relationships with our customers.
Preparing for and complying with the GDPR and the ePrivacy Regulation (if and when it becomes effective) has required and will continue to require us to incur substantial operational costs and may require us to change our business practices. Despite our efforts to bring practices into compliance with the GDPR and before the effective date of the ePrivacy Regulation, we may not be successful either
41
Table of Contents
due to internal or external factors such as resource allocation limitations. Non-compliance could result in proceedings against us by governmental entities, customers, data subjects, consumer associations or others. We are not a participant in the EU-U.S. and Swiss-U.S. Privacy Shield Frameworks administered by the U.S. Department of Commerce. We are in the process of submitting our binding corporate rules for approval by CNIL, the France data protection agency, as our lead regulator in Europe, but there is no assurance as to when this process will be complete, that it will be successfully completed or that the laws may not require additional compliance steps to be taken in the future.
In the United States, California enacted the California Consumer Privacy Act, or the CCPA, on June 28, 2018, which takes effect on January 1, 2020. The CCPA gives California residents expanded rights to access and delete their personal information, opt out of certain personal information sharing and receive detailed information about how their personal information is used. The CCPA provides for civil penalties for violations, as well as a private right of action for data breaches that is expected to increase data breach litigation. The CCPA may increase our compliance costs and potential liability. Some observers have noted that the CCPA could mark the beginning of a trend toward more stringent privacy legislation in the U.S., which could increase our potential liability and adversely affect our business.
Privacy and data security concerns, whether valid or not valid, may inhibit market adoption of our products, particularly in certain industries and foreign countries. If we are not able to adjust to changing laws, regulations, and standards related to the Internet, our business may be harmed.
We are subject to governmental export, import and sanctions controls that could impair our ability to compete in international markets due to licensing requirements and subject us to liability if we are not in compliance with applicable laws.
Our solutions are subject to export control and economic sanctions laws and regulations, including the U.S. Export Administration Regulations administered by the U.S. Commerce Departments Bureau of Industry and Security and the economic and trade sanctions regulations administered by the U.S. Treasury Departments Office of Foreign Assets Controls. Exports, re-exports and transfers of our software and services must be made in compliance with these laws and regulations. Obtaining the necessary authorizations, including any required license, for a particular sale may be time-consuming, is not guaranteed and may result in the delay or loss of sales opportunities. Changes in the encryption or other technology incorporated into our solutions or in applicable export or import laws and regulations may delay the introduction and sale of our solutions in international markets, prevent customers from deploying our solutions or, in some cases, prevent the export or import of our solutions to certain countries, regions, governments or persons altogether. Changes in sanctions, export or import laws and regulations, in the enforcement or scope of existing laws and regulations, or in the countries, regions, governments, persons or technologies targeted by such laws and regulations, could also result in decreased use of our solutions or in our ability to sell our solutions in certain countries. Even though we take precautions to prevent our solutions from being provided to restricted countries or persons, our solutions could be provided to those targets by our resellers or customers despite such precautions. The decreased use of our solutions or limitation on our ability to export or sell our solutions could adversely affect our business, while violations of these export and import control and economic sanctions laws and regulations could have negative consequences for us and our personnel, including government investigations, administrative fines, civil and criminal penalties, denial of export privileges, incarceration, and reputational harm.
42
Table of Contents
Due to the global nature of our business, we could be adversely affected by violations of the U.S. Foreign Corrupt Practices Act, the U.K. Bribery Act or similar anti-bribery laws in other jurisdictions in which we operate.
The global nature of our business creates various domestic and local regulatory challenges. The Foreign Corrupt Practices Act, or FCPA, the U.K. Bribery Act and similar anti-bribery laws in other jurisdictions generally prohibit U.S.-based companies and their intermediaries from making improper payments for the purpose of obtaining or retaining business to non-U.S. officials, or in the case of the U.K. Bribery Act, to any person. In addition, U.S.-based companies are required to maintain records that accurately and fairly represent their transactions and have an adequate system of internal accounting controls. We operate in areas that experience corruption by government officials and, in certain circumstances, compliance with anti-bribery laws may conflict with local customs and practices. Changes in applicable laws could result in increased regulatory requirements and compliance costs that could adversely affect our business, financial condition and operating results. Although we take steps to ensure compliance, we cannot guarantee that our employees, resellers, agents, or other intermediaries will not engage in prohibited conduct that could render us responsible under the FCPA, the U.K. Bribery Act, or other similar laws or regulations in the jurisdictions in which we operate. If we are found to be in violation of these anti-bribery laws (either due to acts or inadvertence of our employees, or due to the acts or inadvertence of others), we could suffer criminal or civil penalties or other sanctions, which could have a material adverse effect on our business.
Our international operations subject us to potentially adverse tax consequences.
As a multinational corporation, we are subject to income taxes as well as non-income based taxes, such as payroll, sales, use, value-added, net worth, property and goods and services taxes, in both the United States and various foreign jurisdictions. Our domestic and international tax liabilities are subject to the allocation of revenues and expenses in different jurisdictions and the timing of recognizing revenues and expenses. Additionally, the amount of income taxes paid is subject to our interpretation of applicable tax laws in the jurisdictions in which we file and changes to tax laws. Significant judgment is required in determining our worldwide provision for income taxes and other tax liabilities. From time to time, we are subject to income and non-income tax audits. While we believe we have complied with all applicable income tax laws, there can be no assurance that a governing tax authority will not have a different interpretation of the law and assess us with additional taxes. Should we be assessed with additional taxes, there could be a material adverse effect on our business, operating results and financial condition.
Our future effective tax rate may be affected by such factors as changes in tax laws, regulations or rates, changing interpretation of existing laws or regulations, the impact of accounting for stock-based compensation, the impact of accounting for business combinations, changes in our international organization, and changes in overall levels of income before tax. In addition, in the ordinary course of our global business, there are many intercompany transactions and calculations where the ultimate tax determination is uncertain. Although we believe that our tax estimates are reasonable, we cannot ensure that the final determination of tax audits or tax disputes will not be different from what is reflected in our historical income tax provisions and accruals.
Taxing authorities may successfully assert that we should have collected or in the future should collect sales and use, value added or similar taxes, and we could be subject to liability with respect to past or future sales, which could adversely affect our results of operations.
We do not collect sales and use, value added and similar taxes in all jurisdictions in which we have sales, based on our belief that such taxes are not applicable. Sales and use, value added and similar tax laws and rates vary greatly by jurisdiction. Certain jurisdictions in which we do not collect
43
Table of Contents
such taxes may assert that such taxes are applicable, which could result in tax assessments, penalties and interest, and we may be required to collect such taxes in the future. Such tax assessments, penalties and interest or future requirements may adversely affect our results of operations.
Risks Related to Our Common Stock and This Offering
There has been no prior public trading market for our common stock, and an active trading market may not develop or be sustained following this offering.
We intend to apply for the listing of our common stock on the New York Stock Exchange, or NYSE, under the symbol DT. However, there has been no prior public trading market for our common stock. We cannot assure you that an active trading market for our common stock will develop on such exchange or elsewhere or, if developed, that any market will be sustained. Accordingly, we cannot assure you of the liquidity of any trading market, your ability to sell your shares of our common stock when desired or the prices that you may obtain for your shares of our common stock.
The trading price of our common stock could be volatile, and you could lose all or part of your investment.
Prior to this offering, there has been no public market for shares of our common stock. The initial public offering price of our common stock was determined through negotiation among us and the underwriters. This price does not necessarily reflect the price at which investors in the market will be willing to buy and sell shares of our stock following this offering. In addition, the trading prices of technology stocks have historically experienced high levels of volatility. The trading price of our common stock following this offering may fluctuate substantially. Following the completion of this offering, the market price of our common stock may be higher or lower than the price you pay in the offering, depending on many factors, some of which are beyond our control and may not be related to our operating performance. These fluctuations could cause you to lose all or part of your investment in our common stock. Factors that could cause fluctuations in the trading price of our common stock include the following:
| | announcements of new products or technologies, commercial relationships, acquisitions or other events by us or our competitors; |
| | changes in how customers perceive the benefits of our platform; |
| | shifts in the mix of billings and revenue attributable to perpetual licenses, term licenses and SaaS subscriptions from quarter to quarter; |
| | departures of key personnel; |
| | price and volume fluctuations in the overall stock market from time to time; |
| | fluctuations in the trading volume of our shares or the size of our public float; |
| | sales of large blocks of our common stock, including by the Thoma Bravo Funds; |
| | actual or anticipated changes or fluctuations in our operating results; |
| | whether our operating results meet the expectations of securities analysts or investors; |
| | changes in actual or future expectations of investors or securities analysts; |
| | litigation involving us, our industry or both; |
| | regulatory developments in the United States, foreign countries or both; |
| | general economic conditions and trends; and |
| | major catastrophic events in our domestic and foreign markets. |
44
Table of Contents
In addition, if the market for technology stocks or the stock market in general experiences a loss of investor confidence, the trading price of our common stock could decline for reasons unrelated to our business, operating results or financial condition. The trading price of our common stock might also decline in reaction to events that affect other companies in our industry even if these events do not directly affect us. In the past, following periods of volatility in the trading price of a companys securities, securities class action litigation has often been brought against that company.
If securities analysts were to downgrade our stock, publish negative research or reports or fail to publish reports about our business, our competitive position could suffer, and our stock price and trading volume could decline.
The trading market for our common stock will, to some extent, depend on the research and reports that securities analysts may publish about us, our business, our market or our competitors. We do not have any control over these analysts. We do not currently have and may never obtain research coverage by securities analysts. If no or few securities analysts commence coverage of us, the trading price of our stock would likely decrease. Even if we do obtain analyst coverage, if one or more of the analysts who cover us should downgrade our stock or publish negative research or reports, cease coverage of our company or fail to regularly publish reports about our business, our competitive position could suffer, and our stock price and trading volume could decline.
The requirements of being a public company, including compliance with the reporting requirements of the Exchange Act, and the requirements of the Sarbanes-Oxley Act, may strain our resources, increase our costs and distract management, and we may be unable to comply with these requirements in a timely or cost-effective manner.
As a public company, we will need to comply with new laws, regulations and requirements, certain corporate governance provisions of the Sarbanes-Oxley Act, the Securities Exchange Act of 1934, as amended, related regulations of the SEC and the requirements of the NYSE, with which we are not required to comply as a private company. Complying with these statutes, regulations and requirements will occupy a significant amount of time of our board of directors and management and will significantly increase our costs and expenses. We will need to:
| | institute a more comprehensive compliance function; |
| | comply with rules promulgated by the ; |
| | continue to prepare and distribute periodic public reports in compliance with our obligations under the federal securities laws; |
| | establish new internal policies, such as those relating to insider trading; and |
| | involve and retain to a greater degree outside counsel and accountants in the above activities. |
Furthermore, while we generally must comply with Section 404 of the Sarbanes-Oxley Act for our fiscal year ending March 31, 2021, we are not required to have our independent registered public accounting firm attest to the effectiveness of our internal control over financial reporting until our first annual report subsequent to our ceasing to be an emerging growth company. Accordingly, we may not be required to have our independent registered public accounting firm attest to the effectiveness of our internal control over financial reporting until as late as our annual report for the fiscal year ending March 31, 2024. Once it is required to do so, our independent registered public accounting firm may issue a report that is adverse in the event it is not satisfied with the level at which our internal control over financial reporting are documented, designed, operated or reviewed. Compliance with these requirements may strain our resources, increase our costs and distract management, and we may be unable to comply with these requirements in a timely or cost-effective manner.
45
Table of Contents
In addition, we expect that being a public company subject to these rules and regulations may make it more difficult and more expensive for us to obtain director and officer liability insurance and we may be required to accept reduced policy limits and coverage or incur substantially higher costs to obtain the same or similar coverage. As a result, it may be more difficult for us to attract and retain qualified individuals to serve on our board of directors or as executive officers. We are currently evaluating these rules, and we cannot predict or estimate the amount of additional costs we may incur or the timing of such costs.
Investors in this offering will experience immediate and substantial dilution.
Based on an assumed initial public offering price of $ per share (the midpoint of the estimated price range set forth on the cover of this prospectus), purchasers of our common stock in this offering will experience an immediate and substantial dilution of $ per share in the pro forma as adjusted net tangible book value per share of common stock from the initial public offering price, and our pro forma as adjusted net tangible book value as of , after giving effect to this offering would be $ per share. This dilution is due in large part to earlier investors having paid substantially less than the initial public offering price when they purchased their shares. See the section titled Dilution below.
Sales of substantial amounts of our common stock in the public markets, or the perception that such sales could occur, could reduce the market price of our common stock.
Sales of a substantial number of shares of our common stock in the public market after this offering, or the perception that such sales could occur, could adversely affect the market price of our common stock and may make it more difficult for you to sell your common stock at a time and price that you deem appropriate. Based on the total number of outstanding shares of our common stock as of , upon completion of this offering, we will have approximately shares of common stock outstanding, assuming an initial public offering price of $ per share (the midpoint of the estimated price range set forth on the cover page of this prospectus). All of the shares of common stock sold in this offering will be freely tradable without restrictions or further registration under the Securities Act of 1933, as amended, or the Securities Act, except for any shares held by our affiliates as defined in Rule 144 under the Securities Act.
Subject to certain exceptions described in the section titled Underwriting, we, our directors and executive officers, the Thoma Bravo Funds and substantially all of the other holders of our common stock or stock options outstanding immediately prior to this offering have agreed or will agree to enter into lock-up agreements with the underwriters of this offering pursuant to which we and they have agreed or will agree that, subject to certain exceptions, we and they will not dispose of or hedge any shares or any securities convertible into or exchangeable for shares of our common stock for a period of 180 days after the date of this prospectus. See the sections titled Underwriting and Shares Eligible for Future Sale for more information. Sales of a substantial number of such shares upon expiration of, or the perception that such sales may occur, or early release of the securities subject to, the lock-up agreements, could cause our stock price to fall or make it more difficult for you to sell your common stock at a time and price that you deem appropriate.
Our issuance of additional capital stock in connection with financings, acquisitions, investments, our stock incentive plans or otherwise will dilute all other stockholders.
We may issue additional capital stock in the future that will result in dilution to all other stockholders. We may also raise capital through equity financings in the future. As part of our business strategy, we may acquire or make investments in complementary companies, products or technologies
46
Table of Contents
and issue equity securities to pay for any such acquisition or investment. Any such issuances of additional capital stock may cause stockholders to experience significant dilution of their ownership interests and the per share value of our common stock to decline.
Management will have broad discretion over the use of our proceeds from this offering.
The principal purposes of this offering include increasing our capitalization and financial flexibility, creating a public market for our stock, thereby enabling access to the public equity markets by our employees and stockholders, obtaining additional capital and increasing our visibility in the marketplace. We intend to use our net proceeds from this offering for general corporate purposes, including working capital, operating expenses and capital expenditures, and to repay a portion of the borrowings outstanding under our credit facility. See Use of Proceeds. We cannot specify with certainty the particular uses of the net proceeds to us from this offering. Accordingly, we will have broad discretion in using these proceeds and might not be able to obtain a significant return, if any, on investment of these net proceeds. Investors in this offering will need to rely upon the judgment of our management with respect to the use of our proceeds. If we do not use the net proceeds that we receive in this offering effectively, our business, operating results and financial condition could be harmed.
We expect to be a controlled company within the meaning of the NYSE rules and, as a result, will qualify for and intend to rely on exemptions from certain corporate governance requirements.
Upon completion of this offering, Thoma Bravo, as the ultimate general partner of the Thoma Bravo Funds, will beneficially own a majority of the voting power of all classes of our outstanding voting stock. As a result, we will be a controlled company within the meaning of the NYSE corporate governance standards. Under the NYSE rules, a company of which more than 50% of the voting power is held by another person or group of persons acting together is a controlled company and may elect not to comply with certain NYSE corporate governance requirements, including the requirements that:
| | a majority of the board of directors consist of independent directors as defined under the rules of the NYSE; |
| | the nominating and governance committee be composed entirely of independent directors with a written charter addressing the committees purpose and responsibilities; |
| | the compensation committee be composed entirely of independent directors with a written charter addressing the committees purpose and responsibilities; and |
| | annual performance evaluations of the nominating and governance committee and the compensation committee be performed. |
These requirements will not apply to us as long as we remain a controlled company. Following this offering, we intend to utilize some or all of these exemptions. Additionally, upon the completion of this offering, our executive officers, directors, and the Thoma Bravo Funds will beneficially own approximately % of our issued and outstanding shares of common stock, assuming the sale by us of shares of common stock in this offering. These stockholders may be able to determine all matters requiring stockholder approval. For example, these stockholders may be able to control elections of directors, amendments of our organizational documents, or approval of any merger, sale of assets, or other major corporate transaction. This may prevent or discourage unsolicited acquisition proposals or offers for our common stock that you may feel are in your best interest as one of our stockholders. Accordingly, you may not have the same protections afforded to stockholders of companies that are subject to all of the corporate governance requirements of the NYSE. See the section titled ManagementStatus as a Controlled Company below.
47
Table of Contents
Thoma Bravo has a controlling influence over matters requiring stockholder approval, which may have the effect of delaying or preventing changes of control, or limiting the ability of other stockholders to approve transactions they deem to be in their best interest.
Thoma Bravo, as the ultimate general partner of the Thoma Bravo Funds, beneficially owns in the aggregate % of our stock and, after this offering, will beneficially own in the aggregate % of our issued and outstanding shares of common stock (or, if the underwriters over-allotment option is exercised in full, % of our issued and outstanding shares of common stock). As a result, Thoma Bravo could exert significant influence over our operations and business strategy and would have sufficient voting power to determine the outcome of all matters requiring stockholder approval. These matters may include:
| | the composition of our board of directors, which has the authority to direct our business and to appoint and remove our officers; |
| | approving or rejecting a merger, consolidation or other business combination; |
| | raising future capital; and |
| | amending our charter and bylaws, which govern the rights attached to our common stock. |
For so long as Thoma Bravo beneficially owns 30% or more of our outstanding shares of common stock, Thoma Bravo will have the right to designate a majority of our board of directors. For so long as Thoma Bravo has the right to designate a majority of our board of directors, the directors designated by Thoma Bravo are expected to constitute a majority of each committee of our board of directors, other than the audit committee, and the chairman of each of the committees, other than the audit committee, is expected to be a director designated by Thoma Bravo. At such time as we are not a controlled company under the NYSE corporate governance standards, our committee membership will comply with all applicable requirements of those standards and a majority of our board of directors will be independent directors, as defined under the rules of the NYSE.
This concentration of ownership of our common stock could delay or prevent proxy contests, mergers, tender offers, open-market purchase programs or other purchases of our common stock that might otherwise give you the opportunity to realize a premium over the then-prevailing market price of our common stock. This concentration of ownership may also adversely affect our share price.
Thoma Bravo may pursue corporate opportunities independent of us that could present conflicts with our and our stockholders interests.
Thoma Bravo is in the business of making or advising on investments in companies and holds (and may from time to time in the future acquire) interests in or provides advice to businesses that may directly or indirectly compete with our business or be suppliers or customers of ours. Thoma Bravo may also pursue acquisitions that may be complementary to our business and, as a result, those acquisition opportunities may not be available to us.
Our charter provides that none of our officers or directors who are also an officer, director, employee, partner, managing director, principal, independent contractor or other affiliate of Thoma Bravo will be liable to us or our stockholders for breach of any fiduciary duty by reason of the fact that any such individual pursues or acquires a corporate opportunity for its own account or the account of an affiliate, as applicable, instead of us, directs a corporate opportunity to any other person, instead of us or does not communicate information regarding a corporate opportunity to us.
48
Table of Contents
We do not intend to pay dividends on our common stock and, consequently, your ability to achieve a return on your investment will depend on appreciation in the price of our common stock.
We have never declared or paid any dividends on our common stock. We intend to retain any earnings to finance the operation and expansion of our business, and we do not anticipate paying any cash dividends in the foreseeable future. As a result, you may only receive a return on your investment in our common stock if the market price of our common stock increases.
Our charter and bylaws contain anti-takeover provisions that could delay or discourage takeover attempts that stockholders may consider favorable.
Our charter and bylaws contain provisions that could delay or prevent a change in control of our company. These provisions could also make it difficult for stockholders to elect directors who are not nominated by the current members of our board of directors or take other corporate actions, including effecting changes in our management. These provisions include:
| | a classified board of directors with three-year staggered terms, which could delay the ability of stockholders to change the membership of a majority of our board of directors; |
| | after Thoma Bravo ceases to beneficially own at least 30% of the outstanding shares of our common stock, removal of directors only for cause, and subject to the affirmative vote of the holders of 66 2/3% or more of our outstanding shares of capital stock then entitled to vote at a meeting of our stockholders called for that purpose; |
| | the ability of our board of directors to issue shares of preferred stock and to determine the price and other terms of those shares, including preferences and voting rights, without stockholder approval, which could be used to significantly dilute the ownership of a hostile acquirer; |
| | allowing Thoma Bravo to fill any vacancy on our board of directors for so long as affiliates of Thoma Bravo own 30% or more of our outstanding shares of common stock and thereafter, allowing only our board of directors to fill vacancies on our board of directors, which prevents stockholders from being able to fill vacancies on our board of directors; |
| | after Thoma Bravo ceases to beneficially own at least a majority of the outstanding shares of our common stock, a prohibition on stockholder action by written consent, which forces stockholder action to be taken at an annual or special meeting of our stockholders; |
| | after we cease to be a controlled company, the requirement that a special meeting of stockholders may be called only by our board of directors, the chairperson of our board of directors, our chief executive officer or our president (in the absence of a chief executive officer), which could delay the ability of our stockholders to force consideration of a proposal or to take action, including the removal of directors; |
| | after we cease to be a controlled company, the requirement for the affirmative vote of holders of at least 66 2/3% of the voting power of all of the then outstanding shares of the voting stock, voting together as a single class, to amend the provisions of our charter relating to the management of our business (including our classified board structure) or certain provisions of our bylaws, which may inhibit the ability of an acquirer to effect such amendments to facilitate an unsolicited takeover attempt; |
| | the ability of our board of directors to amend the bylaws, which may allow our board of directors to take additional actions to prevent an unsolicited takeover and inhibit the ability of an acquirer to amend the bylaws to facilitate an unsolicited takeover attempt; |
| | advance notice procedures with which stockholders must comply to nominate candidates to our board of directors or to propose matters to be acted upon at a stockholders meeting, which |
49
Table of Contents
| may discourage or deter a potential acquirer from conducting a solicitation of proxies to elect the acquirers own slate of directors or otherwise attempting to obtain control of us; and |
| | a prohibition of cumulative voting in the election of our board of directors, which would otherwise allow less than a majority of stockholders to elect director candidates. |
Our charter also contains a provision that provides us with protections similar to Section 203 of the Delaware General Corporation Law, and prevents us from engaging in a business combination, such as a merger, with an interested stockholder (i.e., a person or group who acquires at least 15% of our voting stock) for a period of three years from the date such person became an interested stockholder, unless (with certain exceptions) the business combination or the transaction in which the person became an interested stockholder is approved in a prescribed manner. However, our charter also provides that transactions with Thoma Bravo, including the Thoma Bravo Funds, and any persons to whom any Thoma Bravo Fund sells its common stock will be deemed to have been approved by our board of directors.
We may issue preferred stock the terms of which could adversely affect the voting power or value of our common stock.
Following the completion of this offering, our charter will authorize us to issue, without the approval of our stockholders, one or more classes or series of preferred stock having such designations, preferences, limitations and relative rights, including preferences over our common stock respecting dividends and distributions, as our board of directors may determine. The terms of one or more classes or series of preferred stock could adversely impact the voting power or value of our common stock. For example, we might grant holders of preferred stock the right to elect some number of our directors in all events or on the happening of specified events or the right to veto specified transactions. Similarly, the repurchase or redemption rights or liquidation preferences we might assign to holders of preferred stock could affect the residual value of our common stock.
Our bylaws designate the Court of Chancery of the State of Delaware as the exclusive forum for certain litigation that may be initiated by our stockholders, which could limit our stockholders ability to obtain a favorable judicial forum for disputes with us.
Pursuant to our bylaws, which will become effective upon the completion of this offering, unless we consent in writing to the selection of an alternative forum, the Court of Chancery of the State of Delaware is the sole and exclusive forum for state law claims for (1) any derivative action or proceeding brought on our behalf, (2) any action asserting a claim of or based on a breach of a fiduciary duty owed by any of our current or former directors, officers, or other employees to us or our stockholders, (3) any action asserting a claim against us or any of our current or former directors, officers, employees, or stockholders arising pursuant to any provision of the Delaware General Corporation Law or our bylaws, or (4) any action asserting a claim governed by the internal affairs doctrine. In addition, our bylaws provide that any person or entity purchasing or otherwise acquiring any interest in shares of our common stock is deemed to have notice of and consented to the foregoing provisions; provided, however, that stockholders will not be deemed to have waived our compliance with the federal securities laws and the rules and regulations thereunder. This provision will not apply to actions arising under the Securities Act or the Exchange Act. We recognize that the forum selection clause may impose additional litigation costs on stockholders who assert the provision is not enforceable and may impose more general additional litigation costs in pursuing any such claims, particularly if the stockholders do not reside in or near the Commonwealth of Massachusetts. Additionally, the forum selection clause in our bylaws may limit our stockholders ability to obtain a favorable judicial forum for disputes with us. The Court of Chancery of the State of Delaware may also reach different judgments or results than would other courts, including courts where a stockholder
50
Table of Contents
considering an action may be located or would otherwise choose to bring the action, and such judgments may be more or less favorable to us than our stockholders.
For as long as we are an emerging growth company, we will not be required to comply with certain requirements that apply to other public companies.
We are an emerging growth company, as defined in the JOBS Act. For as long as we are an emerging growth company, unlike other public companies, we will not be required to, among other things: (i) provide an auditors attestation report on managements assessment of the effectiveness of our system of internal control over financial reporting pursuant to Section 404(b) of the Sarbanes-Oxley Act; (ii) comply with any new requirements adopted by the Public Company Accounting Oversight Board requiring mandatory audit firm rotation or a supplement to the auditors report in which the auditor would be required to provide additional information about the audit and the financial statements of the issuer; (iii) provide certain disclosures regarding executive compensation required of larger public companies; or (iv) hold nonbinding advisory votes on executive compensation and any golden parachute payments not previously approved. In addition, the JOBS Act provides that an emerging growth company can take advantage of the extended transition period provided in Section 7(a)(2)(B) of the Securities Act for adopting new or revised financial accounting standards. We intend to take advantage of the longer phase-in periods for the adoption of new or revised financial accounting standards permitted under the JOBS Act until we are no longer an emerging growth company. If we were to subsequently elect instead to comply with these public company effective dates, such election would be irrevocable pursuant to the JOBS Act.
We will remain an emerging growth company for up to five full fiscal years, although we will lose that status sooner if we have more than $1.07 billion of revenues in a fiscal year, have more than $700 million in market value of our common stock held by non-affiliates (and have been a public company for at least 12 months and have filed one annual report on Form 10-K), or issue more than $1.0 billion of non-convertible debt over a three-year period.
To the extent that we rely on any of the exemptions available to emerging growth companies, you will receive less information about our executive compensation and internal control over financial reporting than issuers that are not emerging growth companies. We cannot predict if investors will find our common stock less attractive because we will rely on these exemptions. If some investors find our common stock to be less attractive as a result, there may be a less active trading market for our common stock and our stock price may be more volatile.
51
Table of Contents
SPECIAL NOTE REGARDING FORWARD-LOOKING STATEMENTS
This prospectus contains forward-looking statements within the meaning of the federal securities laws, which statements involve substantial risks and uncertainties. Forward-looking statements generally relate to future events or our future financial or operating performance. All statements of historical fact included in this prospectus regarding our strategy, future operations, financial position, estimated revenues and losses, projected costs, prospects, plans and objectives of management are forward-looking statements. In some cases, you can identify forward-looking statements because they contain words such as may, should, expects, plans, anticipates, could, intends, target, projects, contemplates, believes, estimates, predicts, potential or continue or the negative of these words or other similar terms or expressions that concern our expectations, strategy, plans or intentions. When considering forward-looking statements, you should keep in mind the risk factors and other cautionary statements described under the heading Risk Factors included in this prospectus. These forward-looking statements are based on managements current beliefs, based on currently available information, as to the outcome and timing of future events. Forward-looking statements contained in this prospectus include, but are not limited to, statements about:
| | our future financial performance, including our expectations regarding our revenue, annual recurring revenue, gross profit or gross margin, operating expenses, ability to generate cash flow, revenue mix and ability to maintain future profitability; |
| | anticipated trends and growth rates in our business and in the markets in which we operate; |
| | our ability to convert our customers from our Classic products to our Dynatrace® platform; |
| | our ability to maintain and expand our customer base and our partner network; |
| | our ability to sell our applications and expand internationally; |
| | our ability to anticipate market needs and successfully develop new and enhanced solutions to meet those needs; |
| | our ability to hire and retain necessary qualified employees to grow our business and expand our operations; |
| | the evolution of technology affecting our applications, platform and markets; |
| | our ability to adequately protect our intellectual property; |
| | our ability to service our debt obligations; and |
| | our anticipated uses of the net proceeds from this offering. |
We caution you that the foregoing list may not contain all of the forward-looking statements made in this prospectus.
You should not rely upon forward-looking statements as predictions of future events. We have based the forward-looking statements contained in this prospectus primarily on our current expectations and projections about future events and trends that we believe may affect our business, financial condition, results of operations and prospects. The outcome of the events described in these forward-looking statements is subject to risks, uncertainties and other factors described in the section titled Risk Factors and elsewhere in this prospectus. Moreover, we operate in a very competitive and rapidly changing environment. New risks and uncertainties emerge from time to time and it is not possible for us to predict all risks and uncertainties that could have an impact on the forward-looking statements contained in this prospectus. We cannot assure you that the results, events and circumstances reflected in the forward-looking statements will be achieved or occur, and actual results, events or circumstances could differ materially from those described in the forward-looking statements.
52
Table of Contents
The forward-looking statements made in this prospectus relate only to events as of the date on which the statements are made. We undertake no obligation to update any forward-looking statements made in this prospectus to reflect events or circumstances after the date of this prospectus or to reflect new information or the occurrence of unanticipated events, except as required by law. We may not actually achieve the plans, intentions or expectations disclosed in our forward-looking statements and you should not place undue reliance on our forward-looking statements.
53
Table of Contents
MARKET AND INDUSTRY DATA
Unless otherwise indicated, information contained in this prospectus concerning our industry and the market in which we operate, including our general expectations and market position, market opportunity and market size, is based on information from various sources, on assumptions that we have made that are based on those data and other similar sources, and on our knowledge of the markets for our solutions. This information involves a number of assumptions and limitations and you are cautioned not to give undue weight to these estimates. In addition, the industry in which we operate, as well as the projections, assumptions and estimates of our future performance and the future performance of the industry in which we operate, are subject to a high degree of uncertainty and risk due to a variety of factors, including those described in the section titled Risk Factors and elsewhere in this prospectus, that could cause results to differ materially from those expressed in these publications and reports.
Some of the industry and market data contained in this prospectus are based on independent industry publications, including those generated by Gartner or other publicly available information. The Gartner reports described herein, or the Gartner Reports, represent research opinions or viewpoints published, as part of a syndicated subscription service, by Gartner, and are not representations of fact. Each Gartner Report speaks as of its original publication date (and not as of the date of this prospectus) and the opinions expressed in the Gartner Reports are subject to change without notice. Gartner does not endorse any vendor, product or service depicted in its research publications, and does not advise technology users to select only those vendors with the highest ratings or other designation. Gartner research publications consist of the opinions of each of the respective partys research organization and should not be construed as statements of fact. Gartner disclaims all warranties, expressed or implied, with respect to this research, including any warranties of merchantability or fitness for a particular purpose.
The reports from Gartner cited herein are (i) Gartner, Forecast: Enterprise Infrastructure Software Markets, Worldwide, 2017-2023, 1Q19 Update, dated March 2019, (ii) Magic Quadrant for Application Performance Monitoring, dated March 2019, and (iii) Gartner, Best Practices for Running Containers and Kubernetes in Production, dated February 2019.
The report from Forrester Research cited herein is Improving CX Through Business Discipline Drives Growth, dated June 2017.
The report from 451 Research cited herein is 451 Research, Cloud Infrastructure Voice of the Enterprise Data Service, dated November 2018.
The reports from International Data Corporation cited herein are (i) IDC, Worldwide Semiannual Digital Transformation Spending Guide, dated November 2018, and (ii) IDC, FutureScape: Worldwide Cloud 2019 Predictions, Doc #US43001713, dated October 2018.
The study from NewVoiceMedia cited herein is NewVoiceMedia, Serial Switchers Swayed by Sentiment: How bad emotive customer experiences are costing brands billions.
54
Table of Contents
We estimate that the net proceeds from the sale of shares of our common stock that we are selling in this offering will be approximately $ million (or approximately $ million if the underwriters option to purchase additional shares is exercised in full), assuming an initial public offering price of $ per share (the midpoint of the estimated offering price range set forth on the cover page of this prospectus), after deducting estimated underwriting discounts and commissions and estimated offering expenses payable by us.
Each $1.00 increase or decrease in the assumed initial public offering price of $ per share (the midpoint of the estimated offering price range set forth on the cover page of this prospectus) would increase or decrease, as applicable, the net proceeds that we receive from this offering by approximately $ million, assuming that the number of shares of common stock offered by us, as set forth on the cover page of this prospectus, remains the same, and after deducted estimated underwriting discounts and commissions and estimated offering expenses payable by us. Similarly, each increase or decrease of 1.0 million shares in the number of shares of our common stock offered by us, as set forth on the cover page of this prospectus, would increase or decrease the net proceeds that we receive from this offering by approximately $ million, assuming the assumed initial public offering price remains the same.
The principal purposes of this offering are to increase our capitalization and financial flexibility, create a public market for our common stock and enable access to the public equity markets for us and our stockholders.
We intend to use a portion of our net proceeds from this offering to repay $ million of the borrowings outstanding under our Credit Facility, under which affiliates of certain of the underwriters in this offering are lenders. See Underwriting. We may also use the balance of our net proceeds for general corporate purposes, including working capital, operating expenses, capital expenditures, and to acquire complementary businesses, products, services or technologies. However, we do not have agreements or commitments for any acquisitions at this time.
At March 31, 2019, we had approximately $1.0 billion of aggregate indebtedness, consisting of: (i) $947.6 million outstanding under our first lien term loan facility, (ii) $88.7 million outstanding under our second lien term loan facility, (iii) $0.5 million outstanding under a $15.0 million letter of credit sub-facility, and (iv) $14.3 million of unamortized debt issuance fees. We also have a $60.0 million revolving credit facility under which we had no outstanding borrowings as of March 31, 2019. The first lien term loan requires equal quarterly repayments equal to 0.25% of the original principal amount under the first lien term loan facility and revolving credit facility. The second lien term loan facility bears interest at a floating rate which can be, at our option, either (i) a Eurodollar rate for a specified period plus 7.00% or (ii) a base rate plus 6.00%. The base rate for any day is a fluctuating rate per annum equal to the highest of (a) the prime rate as last quoted by The Wall Street Journal, (b) the federal funds effective rate in effect on such day, plus 0.50% per annum and (c) the Eurodollar rate for a one-month interest period plus 1.00%. The base rate applicable to the second lien term loan facility is subject to a floor of 0.0%. Borrowings under the revolving credit facility mature on August 23, 2023. The first lien term loan facility matures on August 23, 2025. The second lien term loan facility matures on August 23, 2026. The indebtedness was incurred for the purpose of paying down related party debt associated with our acquisition by Thoma Bravo. See Description of Indebtedness.
Our management will have broad discretion in the application of the net proceeds of this offering, and investors will be relying on the judgment of our management regarding the application of the net proceeds. Pending the use of proceeds to us from this offering as described above, we intend to invest the net proceeds to us from this offering in short-term and long-term interest-bearing obligations, including government and investment-grade debt securities and money market funds.
55
Table of Contents
We currently intend to retain all available funds and any future earnings for use in the operation of our business and do not expect to pay any dividends on our common stock in the foreseeable future. Any future determination to declare dividends will be made at the discretion of our board of directors, subject to applicable laws, and will depend on a number of factors, including our financial condition, results of operations, capital requirements, contractual restrictions, general business conditions and other factors that our board of directors may deem relevant. In addition, our credit facility places restrictions on the ability of our subsidiaries to pay cash dividends or make distributions to us.
56
Table of Contents
The following table sets forth our cash and cash equivalents and capitalization as of March 31, 2019:
| | on an actual basis; |
| | on a pro forma basis to give effect to the completion of the Spin-Off Transactions, including the elimination of the related party payable, prior to the completion of this offering; and |
| | on a pro forma as adjusted basis, giving effect to the pro forma adjustments set forth above and the sale and issuance by us of shares of our common stock in this offering, assuming an initial public offering price of $ per share (the midpoint of the estimated offering price range set forth on the cover page of this prospectus), after deducting estimated underwriting discounts and commissions and estimated offering expenses payable by us, and the application of the net proceeds from this offering as set forth under the section titled Use of Proceeds. |
The information below is illustrative only and our capitalization following the closing of this offering will be adjusted based on the actual public offering price and other terms of this offering determined at pricing. You should read this table together with our consolidated financial statements and related notes, and the sections titled Selected Consolidated Financial and Other Data, Managements Discussion and Analysis of Financial Condition and Results of Operations and Use of Proceeds that are included elsewhere in this prospectus.
| As of March 31, 2019 | ||||||||||||
| Actual | Pro Forma | Pro Forma as Adjusted |
||||||||||
| (in thousands, except share and per share data) | ||||||||||||
| Cash and cash equivalents |
$ | 51,314 | $ | $ | ||||||||
|
|
|
|
|
|
|
|||||||
| Related party payable |
597,150 | |||||||||||
| Long-term debt, net of current portion |
1,011,793 | |||||||||||
| Members deficit |
||||||||||||
| Preferred stock, $ par value per share; no shares authorized, issued or outstanding, actual; shares authorized, no shares issued or outstanding, pro forma and pro forma as adjusted |
||||||||||||
| Common stock, $ par value per share; no shares authorized, issued or outstanding, actual; shares authorized and shares issued and outstanding, pro forma; shares authorized and shares issued and outstanding pro forma as adjusted |
| |||||||||||
| Additional paid-in capital |
(184,546 | ) | ||||||||||
| Accumulated deficit |
(176,002 | ) | ||||||||||
| Accumulated other comprehensive (loss) |
(29,710 | ) | ||||||||||
|
|
|
|
|
|
|
|||||||
| Total members deficit |
(390,258 | ) | ||||||||||
|
|
|
|
|
|
|
|||||||
| Total capitalization |
$ | 1,218,685 | $ | $ | ||||||||
|
|
|
|
|
|
|
|||||||
Each $1.00 increase (decrease) in the assumed initial public offering price of $ per share (the midpoint of the estimated offering price range set forth on the cover page of this prospectus) would increase (decrease) the pro forma as adjusted amount of each of cash and cash equivalents,
57
Table of Contents
additional paid-in capital, total stockholders equity and total capitalization by $ million, assuming that the number of shares offered by us, as set forth on the cover page of this prospectus, remains the same and after deducting estimated underwriting discounts and commissions and estimated offering expenses payable by us. Each increase (decrease) of 1.0 million shares in the number of shares offered by us, as set forth on the cover page of this prospectus, would increase (decrease) the pro forma as adjusted amount of each of cash and cash equivalents, additional paid-in capital, total stockholders equity and total capitalization by $ million, assuming no change in the assumed initial public offering price per share and after deducting estimated underwriting discounts and commissions and estimated offering expenses payable by us.
The information presented in the table above does not include:
| | shares of our common stock issuable upon the exercise of stock options outstanding as of at a weighted average exercise price of $ per share; |
| | shares of common stock available for future issuance under our equity compensation plans; |
| | shares of our common stock that will become available for future issuance under our 2019 Equity Incentive Plan, which will become effective in connection with the completion of this offering; and |
| | shares of our common stock that will become available for future issuance under our 2019 Employee Stock Purchase Plan, which will become effective in connection with the completion of this offering. |
58
Table of Contents
If you purchase shares of our common stock in this offering, your ownership interest will be diluted to the extent of the difference between the initial public offering price per share of our common stock and the pro forma as adjusted net tangible book value per share immediately after this offering. Dilution in pro forma net tangible book value per share to investors purchasing shares of our common stock in this offering represents the difference between the amount per share paid by investors purchasing shares of our common stock in this offering and the pro forma as adjusted net tangible book value per share of our common stock immediately after completion of this offering.
Net tangible book value per share is determined by dividing our total tangible assets, excluding deferred commissions, less our total liabilities by the number of shares of our common stock outstanding. Our historical net tangible book value as of March 31, 2019 was $(2.0) billion, or $ per share. Our pro forma net tangible book value as of March 31, 2019 was $ , or $ per share, based on the total number of shares of our common stock outstanding as of March 31, 2019, to give effect to the completion of the Spin-Off Transactions prior to the effectiveness of the registration statement of which this prospectus is a part.
After giving effect to the sale by us of shares of our common stock in this offering at the assumed initial public offering price of $ per share (the midpoint of the estimated offering price range set forth on the cover page of this prospectus), and after deducting estimated underwriting discounts and commissions and estimated offering expenses payable by us, our pro forma as adjusted net tangible book value as of March 31, 2019 would have been $ , or $ per share. This represents an immediate increase in pro forma net tangible book value of $ per share to our existing stockholders and an immediate dilution in pro forma as adjusted net tangible book value of $ per share to investors purchasing shares of our common stock in this offering. The following table illustrates this dilution:
| Assumed initial public offering price per share |
$ | |||||||
| Pro forma net tangible book value per share as of March 31, 2019 |
$ | |||||||
| Increase in pro forma net tangible book value per share attributable to investors purchasing shares in this offering |
||||||||
|
|
|
|||||||
| Pro forma as adjusted net tangible book value per share immediately after the completion of this offering |
||||||||
|
|
|
|||||||
| Dilution to investors purchasing shares in this offering |
$ | |||||||
|
|
|
Each $1.00 increase or decrease in the assumed initial public offering price of $ per share (the midpoint of the estimated offering price range set forth on the cover page of this prospectus) would increase or decrease, as applicable, our pro forma as adjusted net tangible book value per share to new investors by $ , and would increase or decrease, as applicable, dilution per share to investors purchasing shares of our common stock in this offering by $ , assuming the number of shares of our common stock offered by us, as set forth on the cover page of this prospectus, remains the same and after deducting estimated underwriting discounts and commissions and estimated offering expenses payable by us. Similarly, each increase or decrease of 1.0 million shares in the number of shares of our common stock offered by us would increase or decrease, as applicable, our pro forma as adjusted net tangible book value by approximately $ per share and increase or decrease, as applicable, the dilution to investors purchasing shares of our common stock in this offering by $ per share, assuming the assumed initial public offering price of $ per share (the midpoint of the estimated offering price range set forth on the cover page of this prospectus) remains the same and after deducting estimated underwriting discounts and commissions and estimated offering expenses payable by us.
59
Table of Contents
If the underwriters option to purchase additional shares is exercised in full, the pro forma as adjusted net tangible book value per share of our common stock immediately after the completion of this offering would be $ per share, and the dilution to investors purchasing shares of our common stock in this offering would be $ per share.
The following table presents, on a pro forma as adjusted basis, as of March 31, 2019, after giving effect to (i) the completion of the Spin-Off Transactions prior to the effectiveness of the registration statement of which this prospectus is a part and (ii) the sale by us of shares of our common stock in this offering at the assumed initial public offering price of $ per share (the midpoint of the estimated offering price range set forth on the cover page of this prospectus) the difference between the existing stockholders and the investors purchasing shares of our common stock in this offering with respect to the number of shares of our common stock purchased from us, the total consideration paid or to be paid to us, and the average price per share paid or to be paid to us, before deducting estimated underwriting discounts and commissions and estimated offering expenses payable by us:
| Shares Purchased | Total Consideration | Average Price Per Share |
||||||||||||||||||
| Number | Percent | Amount | Percent | |||||||||||||||||
| Existing stockholders |
% | $ | % | $ | ||||||||||||||||
| Investors purchasing shares of our common stock in this offering |
||||||||||||||||||||
|
|
|
|
|
|
|
|
|
|
|
|||||||||||
| Total |
100 | % | $ | 100 | % | |||||||||||||||
|
|
|
|
|
|
|
|
|
|
|
|||||||||||
Except as otherwise indicated, the above discussion and tables assume no exercise of the underwriters option to purchase additional shares. If the underwriters option to purchase additional shares is exercised in full, our existing stockholders would own % and the investors purchasing shares of our common stock in this offering would own % of the total number of shares of our common stock outstanding immediately after completion of this offering.
The information presented in the table above does not include:
| | shares of our common stock issuable upon the exercise of stock options outstanding as of at a weighted average exercise price of $ per share; |
| | shares of common stock available for future issuance under our equity compensation plans; |
| | shares of our common stock that will become available for future issuance under our 2019 Equity Incentive Plan, which will become effective in connection with the completion of this offering; and |
| | shares of our common stock that will become available for future issuance under our 2019 Employee Stock Purchase Plan, which will become effective in connection with the completion of this offering. |
To the extent that any outstanding options to purchase shares of our common stock are exercised there will be further dilution to investors participating in this offering.
60
Table of Contents
SELECTED CONSOLIDATED FINANCIAL AND OTHER DATA
We have derived the selected consolidated statement of operations and cash flow data for the years ended March 31, 2017, 2018, and 2019 and the selected consolidated balance sheet data as of March 31, 2018 and 2019 set forth below from our audited consolidated financial statements included elsewhere in this prospectus. Our historical results are not necessarily indicative of the results to be expected in the future.
The following summary consolidated financial and other data should be read in conjunction with the section titled Managements Discussion and Analysis of Financial Condition and Results of Operations and our consolidated financial statements and related notes included elsewhere in this prospectus.
| Year Ended March 31, | ||||||||||||
| 2017 | 2018 | 2019 | ||||||||||
| Consolidated Statements of Operations Data: |
||||||||||||
| Revenue: |
||||||||||||
| Subscriptions |
$ | 232,783 | $ | 257,576 | $ | 349,830 | ||||||
| License |
130,738 | 98,756 | 40,354 | |||||||||
| Services |
42,856 | 41,715 | 40,782 | |||||||||
|
|
|
|
|
|
|
|||||||
| Total revenue |
406,377 | 398,047 | 430,966 | |||||||||
|
|
|
|
|
|
|
|||||||
| Cost of revenues: |
||||||||||||
| Cost of subscriptions |
52,176 | 48,270 | 56,934 | |||||||||
| Cost of services |
30,735 | 30,316 | 31,529 | |||||||||
| Amortization of acquired technology |
19,261 | 17,948 | 18,338 | |||||||||
|
|
|
|
|
|
|
|||||||
| Total cost of revenues(1) |
102,172 | 96,534 | 106,801 | |||||||||
|
|
|
|
|
|
|
|||||||
| Gross Profit |
304,205 | 301,513 | 324,165 | |||||||||
|
|
|
|
|
|
|
|||||||
| Operating expenses: |
||||||||||||
| Research and development(1) |
52,885 | 58,320 | 76,759 | |||||||||
| Sales and marketing(1) |
129,971 | 145,350 | 178,886 | |||||||||
| General and administrative(1) |
49,232 | 64,114 | 91,778 | |||||||||
| Amortization of other intangibles |
51,947 | 50,498 | 47,686 | |||||||||
| Restructuring and other |
7,637 | 4,990 | 1,763 | |||||||||
|
|
|
|
|
|
|
|||||||
| Total operating expenses |
291,672 | 323,272 | 396,872 | |||||||||
|
|
|
|
|
|
|
|||||||
| Income (loss) from operations |
12,533 | (21,759 | ) | (72,707 | ) | |||||||
| Other expense, net |
(28,926 | ) | (30,016 | ) | (67,204 | ) | ||||||
|
|
|
|
|
|
|
|||||||
| (Loss) before taxes |
(16,393 | ) | (51,775 | ) | (139,911 | ) | ||||||
| Income tax benefit |
17,189 | 60,997 | 23,717 | |||||||||
|
|
|
|
|
|
|
|||||||
| Net income (loss) |
$ | 796 | $ | 9,222 | $ | (116,194 | ) | |||||
|
|
|
|
|
|
|
|||||||
61
Table of Contents
| (1) | Includes share-based compensation expense as follows: |
| Year Ended March 31, | ||||||||||||
| 2017 | 2018 | 2019 | ||||||||||
| Cost of revenues |
$ | 28 | $ | 1,720 | $ | 5,777 | ||||||
| Research and development |
71 | 3,858 | 12,566 | |||||||||
| Sales and marketing |
122 | 7,536 | 24,673 | |||||||||
| General and administrative |
128 | 9,180 | 28,135 | |||||||||
|
|
|
|
|
|
|
|||||||
| Total compensation expense |
$ | 349 | $ | 22,294 | $ | 71,151 | ||||||
|
|
|
|
|
|
|
|||||||
| As of March 31, | ||||||||
| 2018 | 2019 | |||||||
| (in thousands) | ||||||||
| Consolidated Balance Sheet Data: |
||||||||
| Cash and cash equivalents |
$ | 77,581 | $ | 51,314 | ||||
| Working capital, excluding deferred revenue(1) |
182,826 | 132,239 | ||||||
| Total assets |
1,899,002 | 1,811,366 | ||||||
| Deferred revenue, current and non-current portion |
246,627 | 365,745 | ||||||
| Long-term debt, net of current portion |
| 1,011,793 | ||||||
| Total liabilities |
2,167,692 | 2,201,624 | ||||||
| Total members deficit |
(268,690 | ) | (390,258 | ) | ||||
| (1) | We define working capital as current assets less current liabilities, excluding related-party payables. |
| Year Ended March 31, | ||||||||||||
| 2017 | 2018 | 2019 | ||||||||||
| (in thousands) | ||||||||||||
| Cash provided by operating activities(1) |
$ | 94,560 | $ | 118,838 | $ | 147,141 | ||||||
| Cash used in investing activities |
(13,876 | ) | (26,531 | ) | (9,250 | ) | ||||||
| Cash used in financing activities |
(63,019 | ) | (75,501 | ) | (161,482 | ) | ||||||
| Effect of exchange rate changes on cash and cash equivalents |
(1,338 | ) | 2,827 | (2,676 | ) | |||||||
|
|
|
|
|
|
|
|||||||
| Net increase (decrease) in cash and cash equivalents |
$ | 16,327 | $ | 19,633 | $ | (26,267 | ) | |||||
|
|
|
|
|
|
|
|||||||
| (1) | Net cash provided by operating activities includes cash payments for interest as follows: |
| Year Ended March 31, | ||||||||||||
| 2017 | 2018 | 2019 | ||||||||||
| (in thousands) | ||||||||||||
| Cash paid for interest |
$ | 163 | $ | 38 | $ | 40,969 | ||||||
Key Metrics
In addition to our financial information presented in accordance with GAAP, we use a number of operating and financial metrics, including the following key metrics, to clarify and enhance our understanding of past performance and future prospects.
62
Table of Contents
Customers, ARR, Dollar-Based Net Expansion Rate and Total ARR
|
|
As of | |||||||||||||||||||||||||||||||
| 6/30/2017 | 9/30/2017 | 12/31/2017 | 3/31/2018 | 6/30/2018 | 9/30/2018 | 12/31/2018 | 3/31/2019 | |||||||||||||||||||||||||
| Number of Dynatrace® Customers |
201 | 276 | 399 | 574 | 733 | 899 | 1,149 | 1,364 | ||||||||||||||||||||||||
| Dynatrace® ARR (in thousands) |
$ | 30,739 | $ | 45,007 | $ | 61,165 | $ | 85,306 | $ | 118,371 | $ | 159,949 | $ | 226,976 | $ | 282,815 | ||||||||||||||||
| Classic ARR (in thousands) |
$ | 201,522 | $ | 202,650 | $ | 201,927 | $ | 195,008 | $ | 187,732 | $ | 166,490 | $ | 145,341 | $ | 120,459 | ||||||||||||||||
| Total ARR (in thousands) |
$ | 232,261 | $ | 247,657 | $ | 263,092 | $ | 280,314 | $ | 306,103 | $ | 326,439 | $ | 372,317 | $ | 403,274 | ||||||||||||||||
| Dynatrace® Dollar-Based Net Expansion Rate |
* | * | * | * | 122 | % | 120 | % | 129 | % | 140 | % | ||||||||||||||||||||
| * | Not meaningful |
For an explanation of our key metrics, see section titled Managements Discussion and Analysis of Financial Condition and Results of OperationsKey Metrics.
63
Table of Contents
In addition to our financial information presented in accordance with GAAP, we use certain non-GAAP financial measures to clarify and enhance our understanding of past performance and future prospects. Generally, a non-GAAP financial measure is a numerical measure of a companys operating performance, financial position or cash flow that includes or excludes amounts that are included or excluded from the most directly comparable measure calculated and presented in accordance with GAAP. As discussed below, we monitor the non-GAAP financial measures described below, and we believe they are helpful to investors.
Our non-GAAP financial measures may not provide information that is directly comparable to that provided by other companies in our industry because they may calculate non-GAAP financial results differently. In addition, there are limitations in using non-GAAP financial measures because they are not prepared in accordance with GAAP and exclude expenses that may have a material impact on our reported financial results. In particular, interest expense, which is excluded from Adjusted EBITDA has been and will continue to be a significant recurring expense in our business for the foreseeable future. The presentation of non-GAAP financial information is not meant to be considered in isolation or as a substitute for the directly comparable financial measures prepared in accordance with GAAP. We urge you to review the reconciliations of our non-GAAP financial measures to the comparable GAAP financial measures included below, and not to rely on any single financial measure to evaluate our business.
Non-GAAP operating income (loss)
To supplement our consolidated financial statements presented in accordance with GAAP, we provide investors with certain non-GAAP financial measures, including non-GAAP operating income (loss). We define non-GAAP operating income (loss) as the respective GAAP balance, adjusted to exclude depreciation and amortization, restructuring, transaction and sponsor related costs, and stock-based compensation expense.
The following tables present our non-GAAP operating income (loss) and reconcile our GAAP net income (loss) to non-GAAP operating income (loss) for the years ended March 31, 2017, 2018 and 2019:
| Year Ended March 31, 2017 | ||||||||||||||||||||||||
| GAAP | Share-based compensation |
Amortization of other intangibles |
Depreciation | Restructuring & Other |
Non-GAAP | |||||||||||||||||||
| Cost of revenues |
$ | 102,172 | $ | (28 | ) | $ | (21,905 | ) | $ | (3,031 | ) | $ | | $ | 77,208 | |||||||||
| Gross profit |
304,205 | 28 | 21,905 | 3,031 | | 329,169 | ||||||||||||||||||
| Gross margin |
74.9 | % | 81.0 | % | ||||||||||||||||||||
| Research and development |
52,885 | (71 | ) | | (1,445 | ) | | 51,369 | ||||||||||||||||
| Sales and marketing |
129,971 | (122 | ) | | (146 | ) | | 129,703 | ||||||||||||||||
| General and administrative |
49,232 | (128 | ) | | (6,445 | ) | (2,835 | ) | 39,824 | |||||||||||||||
| Amortization of other intangibles |
51,947 | | (51,947 | ) | | | | |||||||||||||||||
| Restructuring and other |
7,637 | | | | (7,637 | ) | | |||||||||||||||||
| Operating income (loss) |
12,533 | 349 | 73,852 | 11,067 | 10,472 | 108,273 | ||||||||||||||||||
| Operating margin |
3.1 | % | 26.6 | % | ||||||||||||||||||||
64
Table of Contents
| Year Ended March 31, 2018 | ||||||||||||||||||||||||
| GAAP | Share-based compensation |
Amortization of other intangibles |
Depreciation | Restructuring & Other |
Non-GAAP | |||||||||||||||||||
| Cost of revenues |
$ | 96,534 | $ | (1,720 | ) | $ | (22,957 | ) | $ | (2,451 | ) | $ | | $ | 69,406 | |||||||||
| Gross profit |
301,513 | 1,720 | 22,957 | 2,451 | | 328,641 | ||||||||||||||||||
| Gross margin |
75.7 | % | 82.6 | % | ||||||||||||||||||||
| Research and development |
58,320 | (3,858 | ) | | (186 | ) | | 54,276 | ||||||||||||||||
| Sales and marketing |
145,350 | (7,536 | ) | | (125 | ) | | 137,689 | ||||||||||||||||
| General and administrative |
64,114 | (9,180 | ) | | (6,021 | ) | (5,060 | ) | 43,853 | |||||||||||||||
| Amortization of other intangibles |
50,498 | | (50,498 | ) | | | | |||||||||||||||||
| Restructuring and other |
4,990 | | | | (4,990 | ) | | |||||||||||||||||
| Operating (loss) income |
(21,759 | ) | 22,294 | 73,455 | 8,783 | 10,050 | 92,823 | |||||||||||||||||
| Operating margin |
(5.5 | )% | 23.3 | % | ||||||||||||||||||||
| Year Ended March 31, 2019 | ||||||||||||||||||||||||
| GAAP | Share-based compensation |
Amortization of other intangibles |
Depreciation | Restructuring & Other |
Non-GAAP | |||||||||||||||||||
| Cost of revenues |
$ | 106,801 | $ | (5,777 | ) | $ | (25,106 | ) | $ | (2,257 | ) | $ | | $ | 73,661 | |||||||||
| Gross profit |
324,165 | 5,777 | 25,106 | 2,257 | | 357,305 | ||||||||||||||||||
| Gross margin |
75.2 | % | 82.9 | % | ||||||||||||||||||||
| Research and development |
76,759 | (12,566 | ) | | (153 | ) | | 64,040 | ||||||||||||||||
| Sales and marketing |
178,886 | (24,673 | ) | | (129 | ) | | 154,084 | ||||||||||||||||
| General and administrative |
91,778 | (28,135 | ) | | (4,780 | ) | (12,543 | ) | 46,320 | |||||||||||||||
| Amortization of other intangibles |
47,686 | | (47,686 | ) | | | | |||||||||||||||||
| Restructuring and other |
1,763 | | | | (1,763 | ) | | |||||||||||||||||
| Operating income (loss) |
(72,707 | ) | 71,151 | 72,792 | 7,319 | 14,306 | 92,861 | |||||||||||||||||
| Operating margin |
(16.9 | )% | 21.5 | % | ||||||||||||||||||||
Adjusted EBITDA
We believe that adjusted EBITDA is a measure widely used by securities analysts and investors to evaluate the financial performance of our company and other companies. We also believe that adjusted EBITDA is an important measure for evaluating our performance because it facilitates comparisons of our core operating results from period to period by removing the impact of our capital structure (net interest income or expense from our outstanding debt), asset base (depreciation and amortization), tax consequences, restructuring and other gains and losses, transaction and sponsor related costs, gains and losses on foreign currency and stock-based compensation. In addition, we base certain of our forward-looking estimates and budgets on adjusted EBITDA.
65
Table of Contents
The following table reflects the reconciliation of adjusted EBITDA to net income (loss) calculated in accordance with GAAP:
| Year Ended March 31, | ||||||||||||
| 2017 | 2018 | 2019 | ||||||||||
| (in thousands) | ||||||||||||
| Net income (loss) |
$ | 796 | $ | 9,222 | $ | (116,194 | ) | |||||
| Income tax benefit |
(17,189 | ) | (60,997 | ) | (23,717 | ) | ||||||
| Interest expense, net |
25,481 | 35,220 | 69,845 | |||||||||
| Amortization |
73,852 | 73,455 | 72,792 | |||||||||
| Depreciation |
11,067 | 8,783 | 7,319 | |||||||||
| Restructuring and other |
7,637 | 4,990 | 1,763 | |||||||||
| Transaction and sponsor related costs |
2,835 | 5,060 | 12,543 | |||||||||
| (Gain) loss on currency translation |
3,445 | (5,204 | ) | (2,641 | ) | |||||||
| Share-based compensation |
349 | 22,294 | 71,151 | |||||||||
|
|
|
|
|
|
|
|||||||
| Adjusted EBITDA |
$ | 108,273 | $ | 92,823 | $ | 92,861 | ||||||
|
|
|
|
|
|
|
|||||||
66
Table of Contents
MANAGEMENTS DISCUSSION AND ANALYSIS OF FINANCIAL CONDITION AND RESULTS OF OPERATIONS
The following discussion and analysis of our financial condition and results of operations should be read in conjunction with the section titled Selected Consolidated Financial Data and our consolidated financial statements and related notes appearing elsewhere in this prospectus. The following discussion and analysis contains forward-looking statements that involve risks and uncertainties. When reviewing the discussion below, you should keep in mind the substantial risks and uncertainties that could impact our business. In particular, we encourage you to review the risks and uncertainties described in the section titled Risk Factors included elsewhere in this prospectus. These risks and uncertainties could cause actual results to differ materially from those projected in forward-looking statements contained in this report or implied by past results and trends. Our fiscal year ends on March 31. Our historical results are not necessarily indicative of the results that may be expected for any period in the future, and our interim results are not necessarily indicative of the results we expect for the full fiscal year or any other period.
Overview
We offer the market-leading software intelligence platform, purpose-built for the enterprise cloud. As enterprises embrace the cloud to effect their digital transformation, our all-in-one intelligence platform is designed to address the growing complexity faced by technology and digital business teams. Our platform utilizes artificial intelligence at its core and advanced automation to provide answers, not just data, about the performance of applications, the underlying hybrid cloud infrastructure and the experience of our customers users. We designed our software intelligence platform to allow our customers to modernize and automate IT operations, develop and release high quality software faster, and improve user experiences for better business outcomes. As a result, as of March 31, 2019, our products are trusted by more than 2,300 customers in over 70 countries in diverse industries such as banking, insurance, retail, manufacturing, travel and software. Representative customers include Lloyds TSB, The Western Union Company, American Fidelity Assurance Company, The Kroger Co., Daimler AG, Air Canada, SAP SE and Autodesk, Inc.
Since we began operations, we have been a leader within the application performance monitoring space. In 2014, we leveraged the knowledge and experience of the same engineering team that founded Dynatrace to develop a new platform, the Dynatrace Software Intelligence Platform, from the ground up with a dynamic, AI-powered infrastructure to handle web-scale applications across hybrid cloud platforms.
We market Dynatrace® through a combination of our global direct sales team and a network of partners, including resellers, system integrators, and managed service providers. We target the largest 15,000 global enterprise accounts, which generally have annual revenues in excess of $750 million.
We generate revenue primarily by selling subscriptions, which we define as (i) SaaS agreements, (ii) Dynatrace® term-based licenses, which are recognized ratably over the contract term, (iii) Dynatrace® perpetual licenses , which are recognized ratably over the term of the expected optional maintenance renewals, which is generally three years, and (iv) maintenance and support agreements.
We deploy our platform as a SaaS solution, with the option of retaining the data in the cloud, or at the edge in customer-provisioned infrastructure, which we refer to as Dynatrace® Managed. The Dynatrace® Managed offering allows customers to maintain control of the environment where their data resides, whether in the cloud or on-premise, combining the simplicity of SaaS with the ability to adhere to their own data security and sovereignty requirements. Our Mission Control center automatically upgrades all Dynatrace® instances and offers on-premise cluster customers auto-deployment options that suit their specific enterprise management processes.
67
Table of Contents
Dynatrace® is an all-in-one platform, which is typically purchased by our customers as a full-stack package and extended with our DEM offering. Customers also have the option to purchase infrastructure monitoring only where the full-stack is not required, with the ability to upgrade to the full-stack when necessary. Our Dynatrace® platform has been commercially available since 2016 and has become the primary offering we sell. Dynatrace® customers increased to 1,364 as of March 31, 2019 from 574 as of March 31, 2018, representing year-over-year growth of 138%. As of March 31, 2019, approximately 53% of Dynatrace® customers added to the platform since April 1, 2017 were new customers, and the remaining 47% were existing customers that either added or converted to Dynatrace® over the past two years.
Our Classic products include AppMon, Classic Real User Monitoring, or RUM, Network Application Monitoring, or NAM, and Synthetic Classic. As of April 2018, these products are only available to customers who had previously purchased them. AppMon, Classic RUM, and NAM are deployed using customer-provisioned infrastructure, either on-premise or in the cloud, while Synthetic Classic is a SaaS-based application.
Key Factors Affecting Our Performance
Our historical financial performance has been, and we expect our financial performance in the future to be, driven by our ability to:
| | Extend our technology and market leadership position. We intend to maintain our position as the market-leading software intelligence platform through increased investment in research and development and continued innovation. We expect to focus on expanding the functionality of Dynatrace® and investing in capabilities that address new market opportunities. We believe this strategy will enable new growth opportunities and allow us to continue to deliver differentiated high-value outcomes to our customers. |
| | Grow our customer base. We intend to drive new customer growth by expanding our direct sales force focused on the largest 15,000 global enterprise accounts, which generally have annual revenues in excess of $750 million. The initial average Dynatrace® ARR for new customers added during the twelve months ended March 31, 2019 was approximately $96,000. In addition, we expect to leverage our global partner ecosystem to add new customers in geographies where we have direct coverage and work jointly with our partners. In other geographies, such as Africa, Japan, the Middle East, Russia and South Korea, we utilize a multi-tier master reseller model. |
| | Increase penetration within existing customers. We plan to continue to increase penetration within our existing customers by expanding the breadth of our platform capabilities to provide for continued cross-selling opportunities. In addition, we believe the ease of implementation for Dynatrace® provides us the opportunity to expand adoption within our existing enterprise customers, across new customer applications, and into additional business units or divisions. Once customers are on the Dynatrace® platform, we have seen significant dollar-based net expansion due to the ease of use and power of our new platform. |
| | Enhance our strategic partner ecosystem. Our strategic partners include industry-leading system integrators, software vendors, and cloud and technology providers. We intend to continue to invest in our partner ecosystem, with a particular emphasis on expanding our strategic alliances and cloud-focused partnerships, such as AWS, Azure, Google Cloud Platform, Red Hat OpenShift, and Pivotal Cloud Foundry. |
68
Table of Contents
Key Metrics
In addition to our GAAP financial information, we monitor the following key metrics to help us measure and evaluate the effectiveness of our operations:
| As of | ||||||||||||||||||||||||||||||||
| 6/30/2017 | 9/30/2017 | 12/31/2017 | 3/31/2018 | 6/30/2018 | 9/30/2018 | 12/31/2018 | 3/31/2019 | |||||||||||||||||||||||||
| Number of Dynatrace® Customers |
201 | 276 | 399 | 574 | 733 | 899 | 1,149 | 1,364 | ||||||||||||||||||||||||
| Dynatrace® ARR (in thousands) |
$ | 30,739 | $ | 45,007 | $ | 61,165 | $ | 85,306 | $ | 118,371 | $ | 159,949 | $ | 226,976 | $ | 282,815 | ||||||||||||||||
| Classic ARR (in thousands) |
$ | 201,522 | $ | 202,650 | $ | 201,927 | $ | 195,008 | $ | 187,732 | $ | 166,490 | $ | 145,341 | $ | 120,459 | ||||||||||||||||
| Total ARR (in thousands) |
$ | 232,261 | $ | 247,657 | $ | 263,092 | $ | 280,314 | $ | 306,103 | $ | 326,439 | $ | 372,317 | $ | 403,274 | ||||||||||||||||
| Dynatrace® Dollar-Based Net Expansion Rate |
* | * | * | * | 122 | % | 120 | % | 129 | % | 140 | % | ||||||||||||||||||||
| * | Not meaningful |
Dynatrace® Customers: We define the number of Dynatrace® customers at the end of any reporting period as the number of accounts, as identified by a unique account identifier, that generate at least $10,000 of Dynatrace® ARR as of the reporting date. In infrequent cases, a single large organization may comprise multiple customer accounts when there are distinct divisions, departments or subsidiaries that operate and make purchasing decisions independently from the parent organization. In cases where multiple customer accounts exist under a single organization, each customer account is counted separately based on a mutually exclusive accounting of ARR. As such, even though we target the largest 15,000 global enterprise accounts, there are more than 15,000 addressable Dynatrace® customers. We believe that our ability to grow the number of Dynatrace® customers is an indicator of our ability to drive market adoption of our platform, as well as our ability to grow the business and generate future subscription revenues.
Dynatrace® ARR: We define Dynatrace® annualized recurring revenue, or ARR, as the daily revenue of all term-based Dynatrace® subscription agreements that are actively generating revenue as of the last day of the reporting period multiplied by 365. We exclude from our calculation of ARR any revenues derived from month-to-month agreements and/or product usage overage billings, where customers are billed in arrears based on product usage.
Classic ARR: We define classic annualized recurring revenue as the daily revenue of all classic subscription agreements that are actively generating revenue as of the last day of the reporting period multiplied by 365. We exclude from our calculation of ARR any revenues derived from month-to-month agreements and/or product usage overage billings, where customers are billed in arrears based on product usage. Classic ARR was $120 million as of March 31, 2019. Over the last two years, Classic ARR has decreased by $81 million, or 40%. The $81 million reduction in Classic ARR was offset by a $100 million increase in Dynatrace® ARR resulting from the conversion of Classic products to Dynatrace® products, as well as upsell generated at the time of conversion of accounts that have undergone a conversion from our Classic products to Dynatrace® products. We also believe that in future periods the reduction in Classic ARR from lost customers may exceed the increase in Dynatrace® ARR resulting from the conversion to Dynatrace® products and upsell at the time of conversion. Based on historical trends, we believe that the majority of our Classic ARR as of March 31, 2019 will convert to Dynatrace® ARR over the next two years.
Total ARR: We define Total ARR as the daily revenue of all subscription agreements that are actively generating revenue as of the last day of the reporting period multiplied by 365. We exclude
69
Table of Contents
from our calculation of Total ARR any revenues derived from month-to-month agreements and/or product usage overage billings.
Dynatrace® Dollar-Based Net Expansion Rate: We define the Dynatrace® dollar-based net expansion rate as the Dynatrace® ARR at the end of a reporting period for the cohort of Dynatrace® accounts as of one year prior to the date of calculation, divided by the Dynatrace® ARR one year prior to the date of calculation for that same cohort. This calculation excludes the benefit of Dynatrace® ARR resulting from the conversion of Classic products to the Dynatrace® platform, as well as any upsell generated at the time of conversion. Dynatrace® dollar-based net expansion rate has trended between 120% and 140% as of June 30, 2018, September 30, 2018, December 31, 2018 and March 31, 2019. In the period before June 30, 2018, our Dynatrace® dollar-based net expansion rate was not meaningful given the relatively small amount of Dynatrace® ARR we generated during the prior periods.
Key Components of Results of Operations
Revenues
Net revenues include subscriptions, licenses and services.
Subscriptions. Our subscription revenue consists of (i) SaaS agreements, (ii) Dynatrace® term-based licenses which are recognized ratably over the contract term, (iii) Dynatrace® perpetual licenses that are recognized ratably over the term of the expected optional maintenance renewals, which is generally three years, and (iv) maintenance and support agreements. We typically invoice SaaS subscription fees and term licenses annually in advance and recognize subscription revenue ratably over the term of the applicable agreement, provided that all other revenue recognition criteria have been satisfied. Fees for our Dynatrace® perpetual licenses are generally billed up front. See the section titled Critical Accounting Policies and EstimatesRevenue Recognition for more information. Over time, we expect subscription revenue will increase as a percentage of total revenue as we continue to focus on increasing subscription revenue as a key strategic priority.
License. License revenues reflect the revenues recognized from sales of perpetual and term-based licenses of our Classic products that are sold primarily to existing customers. A majority of our license revenues consists of revenues from perpetual licenses, under which we recognize the license fee portion of the arrangement upfront, assuming all revenue recognition criteria are satisfied. Customers can also purchase term license agreements, under which we recognize the license fee up front. Term licenses are generally billed annually in advance and perpetual licenses are billed up front.
Services. Services revenue consists of revenue from helping our customers deploy our software in highly complex operational environments and train their personnel. We recognize the revenues associated with these professional services on a time and materials basis as we deliver the services or provide the training. We generally recognize the revenues associated with our services in the period the services are performed, provided that collection of the related receivable is reasonably assured.
Cost of Revenues
Cost of subscriptions. Cost of subscription revenues includes all direct costs to deliver and support our subscription products, including salaries, benefits, share-based compensation and related expenses such as employer taxes, allocated overhead for facilities, IT, third-party hosting fees related to our cloud services, and amortization of internally developed capitalized software technology. We recognize these expenses as they are incurred.
70
Table of Contents
Cost of services. Cost of services revenues includes salaries, benefits, share-based compensation and related expenses such as employer taxes for our services organization, allocated overhead for depreciation of equipment, facilities and IT. We recognize these expenses as they are incurred.
Amortization of acquired technology. Amortization of acquired technology includes amortization expense for technology acquired in business combinations and Thoma Bravos acquisition of us in 2014.
Gross Profit and Gross Margin
Gross profit is revenue less cost of revenue, and gross margin is gross profit as a percentage of revenue. Gross profit has been and will continue to be affected by various factors, including the mix of our license, subscription, and services and other revenue, the costs associated with third-party cloud-based hosting services for our cloud-based subscriptions, and the extent to which we expand our customer support and services organizations. We expect that our gross margin will fluctuate from period to period depending on the interplay of these various factors.
Operating Expenses
Personnel costs, which consist of salaries, benefits, bonuses, stock-based compensation and, with regard to sales and marketing expenses, sales commissions, are the most significant component of our operating expenses. We also incur other non-personnel costs such as an allocation of our general overhead expenses.
Research and development. Research and development expenses primarily consists of the cost of programming personnel. We focus our research and development efforts on developing new solutions, core technologies, and to further enhance the functionality, reliability, performance and flexibility of existing solutions. We believe that our software development teams and our core technologies represent a significant competitive advantage for us and we expect that our research and development expenses will continue to increase, as we invest in research and development headcount to further strengthen and enhance our solutions.
Sales and marketing. Sales and marketing expenses primarily consists of personnel and facility-related costs for our sales, marketing, and business development personnel, commissions earned by our sales personnel and the cost of marketing and business development programs. We expect that sales and marketing expenses will continue to increase as we continue to hire additional sales and marketing personnel and invest in marketing programs.
General and administrative. General and administrative expenses primarily consist of the personnel and facility-related costs for our executive, finance, legal, human resources and administrative personnel; and other corporate expenses, including those associated with preparation for the initial public offering. We anticipate continuing to incur additional expenses due to growing our operations and being a public company, including higher legal, corporate insurance and accounting expenses.
Amortization of other intangibles. Amortization of other intangibles primarily consists of amortization of customer relationships, acquired technology, capitalized software and tradenames.
Restructuring and Other. Restructuring and other expenses primarily consists of various restructuring activities we have undertaken to achieve strategic and financial objectives. Restructuring activities include, but are not limited to, product offering cancellation and termination of related employees, office relocation, administrative cost structure realignment and consolidation of resources.
71
Table of Contents
Other Income (Expense), Net
Other income (expense), net consists primarily of interest expense and foreign currency realized and unrealized gains and losses related to the impact of transactions denominated in a foreign currency, including balances between subsidiaries. Interest expense, net of interest income, consists primarily of interest on our term loan facility, amortization of debt issuance costs, loss on the modification and partial extinguishment of debt and prepayment penalties.
Income Tax Benefit (Expense)
Our income tax benefit (expense), deferred tax assets and liabilities, and liabilities for unrecognized tax benefits reflect managements best assessment of estimated current and future taxes to be paid. We are subject to income taxes in both the United States and numerous foreign jurisdictions. Significant judgments and estimates are required in determining the consolidated income tax expense.
Our income tax rate varies from the U.S. federal statutory rate mainly due to (1) differing tax rates and regulations in foreign jurisdictions, (2) differences in accounting and tax treatment of our stock-based compensation, and (3) foreign withholding taxes. We expect this fluctuation in income tax rates, as well as its potential impact on our results of operations, to continue.
72
Table of Contents
Results of Operations
The following tables set forth our results of operations for the periods presented. The period-to-period comparison of financial results is not necessarily indicative of financial results to be achieved in future periods.
Comparison of the Years Ended March 31, 2018 and 2019
The following tables set forth our results of operations for the periods presented. The period-to-period comparison of financial results is not necessarily indicative of financial results to be achieved in future periods.
| Year Ended March 31, | ||||||||||||||||
| 2018 | 2019 | |||||||||||||||
| (in thousands, except percentages) | ||||||||||||||||
| Revenues: |
||||||||||||||||
| Subscriptions |
$ | 257,576 | 65 | % | $ | 349,830 | 81 | % | ||||||||
| License |
98,756 | 25 | % | 40,354 | 9 | % | ||||||||||
| Services |
41,715 | 10 | % | 40,782 | 9 | % | ||||||||||
|
|
|
|
|
|
|
|
|
|||||||||
| Total revenue |
398,047 | 100 | % | 430,966 | 100 | % | ||||||||||
|
|
|
|
|
|
|
|
|
|||||||||
| Cost of revenues: |
||||||||||||||||
| Cost of subscriptions |
48,270 | 12 | % | 56,934 | 13 | % | ||||||||||
| Cost of services |
30,316 | 8 | % | 31,529 | 7 | % | ||||||||||
| Amortization of acquired technology |
17,948 | 5 | % | 18,338 | 4 | % | ||||||||||
|
|
|
|
|
|
|
|
|
|||||||||
| Total cost of revenues(1) |
96,534 | 24 | % | 106,801 | 25 | % | ||||||||||
|
|
|
|
|
|
|
|
|
|||||||||
| Gross profit |
301,513 | 76 | % | 324,165 | 75 | % | ||||||||||
|
|
|
|
|
|
|
|
|
|||||||||
| Operating expenses: |
||||||||||||||||
| Research and development(1) |
58,320 | 15 | % | 76,759 | 18 | % | ||||||||||
| Sales and marketing(1) |
145,350 | 37 | % | 178,886 | 42 | % | ||||||||||
| General and administrative(1) |
64,114 | 16 | % | 91,778 | 21 | % | ||||||||||
| Amortization of other intangibles |
50,498 | 13 | % | 47,686 | 11 | % | ||||||||||
| Restructuring and other |
4,990 | 1,763 | ||||||||||||||
|
|
|
|
|
|||||||||||||
| Total operating expenses |
323,272 | 396,872 | ||||||||||||||
|
|
|
|
|
|||||||||||||
| Loss from operations |
(21,759 | ) | (72,707 | ) | ||||||||||||
| Other expense, net |
(30,016 | ) | (67,204 | ) | ||||||||||||
|
|
|
|
|
|||||||||||||
| Loss before taxes |
(51,775 | ) | (139,911 | ) | ||||||||||||
| Income tax benefit |
60,997 | 23,717 | ||||||||||||||
|
|
|
|
|
|||||||||||||
| Net income (loss) |
$ | 9,222 | $ | (116,194 | ) | |||||||||||
|
|
|
|
|
|||||||||||||
73
Table of Contents
| (1) | Includes share-based compensation expense as follows: |
| Year Ended March 31, |
||||||||
| 2018 | 2019 | |||||||
| (in thousands) | ||||||||
| Cost of revenues |
$ | 1,720 | $ | 5,777 | ||||
| Research and development |
3,858 | 12,566 | ||||||
| Sales and marketing |
7,536 | 24,673 | ||||||
| General and administrative |
9,180 | 28,135 | ||||||
|
|
|
|
|
|||||
| Total share-based compensation |
$ | 22,294 | $ | 71,151 | ||||
|
|
|
|
|
|||||
Revenues
|
Year Ended March 31, |
Change | |||||||||||||||
| 2018 | 2019 | Amount | Percent | |||||||||||||
| (in thousands, except percentages) | ||||||||||||||||
| Subscriptions |
$ | 257,576 | $ | 349,830 | $ | 92,254 | 36 | % | ||||||||
| License |
98,756 | 40,354 | (58,402 | ) | (59 | )% | ||||||||||
| Services |
41,715 | 40,782 | (933 | ) | (2 | )% | ||||||||||
|
|
|
|
|
|
|
|
|
|||||||||
| Total revenues |
$ | 398,047 | $ | 430,966 | $ | 32,919 | 8 | % | ||||||||
|
|
|
|
|
|
|
|
|
|||||||||
Subscriptions
Subscription revenue increased by $92.3 million, or 36%, for the year ended March 31, 2019, as compared to the year ended March 31, 2018, primarily due to the growing adoption of the Dynatrace® platform by new customers combined with existing customers expanding their use of our solutions. Our subscription revenue increased to 81% of total revenue for the year ended March 31, 2019 compared to 65% of total revenue for the year ended March 31, 2018.
License
License revenue decreased by $58.4 million, or 59%, for the year ended March 31, 2019, as compared to the year ended March 31, 2018, primarily due to decline of sales of our Classic products to existing customers as they convert to our Dynatrace® platform. We are no longer selling our Classic products to new customers.
Services
Services revenue decreased by $0.9 million, or 2%, for the year ended March 31, 2019, as compared to the year ended March 31, 2018. The decrease was primarily a result of consulting services related to our Classic products. We recognize the revenues associated with professional services on a time and material basis or as we deliver the services, provide the training or when the service term has expired.
74
Table of Contents
Cost of Revenues
|
Year Ended March 31, |
Change | |||||||||||||||
| 2018 | 2019 | Amount | Percent | |||||||||||||
| (in thousands, except percentages) | ||||||||||||||||
| Cost of subscriptions |
$ | 48,270 | $ | 56,934 | $ | 8,664 | 18 | % | ||||||||
| Cost of services |
30,316 | 31,529 | 1,213 | 4 | % | |||||||||||
| Amortization of acquired technology |
17,948 | 18,338 | 390 | 2 | % | |||||||||||
|
|
|
|
|
|
|
|
|
|||||||||
| Total cost of revenue |
$ | 96,534 | $ | 106,801 | $ | 10,267 | 11 | % | ||||||||
|
|
|
|
|
|
|
|
|
|||||||||
Cost of subscriptions
Cost of subscription revenue increased $8.7 million, or 18%, for the year ended March 31, 2019 compared to the year ended March 31, 2018. The increase is primarily due to higher personnel costs to support the growth of our subscription cloud-based offering as well as higher share-based compensation of $2.9 million.
Cost of services
Cost of services and other revenue increased by $1.2 million, or 4%, for the year ended March 31, 2019, as compared to the year ended March 31, 2018. The increase was the result of higher share-based compensation of $1.1 million and increased personnel costs to support the increase in use of our consulting and training services to support our new customers, which was partially offset by lower third-party consulting costs.
Amortization of acquired technologies
For the years ended March 31, 2018 and 2019, amortization of acquired technologies includes $17.7 million of amortization expense for technology acquired in connection with Thoma Bravos acquisition of us in 2014, with the remaining balance related primarily to the Qumram acquisition in November 2017.
Gross Profit and Gross Margin
|
Year Ended March 31, |
Change | |||||||||||||||
| 2018 | 2019 | Amount | Percent | |||||||||||||
| (in thousands, except percentages) | ||||||||||||||||
| Gross profit: |
||||||||||||||||
| Subscriptions |
$ | 209,306 | $ | 292,896 | $ | 83,590 | 40 | % | ||||||||
| License |
98,756 | 40,354 | (58,402 | ) | (59 | )% | ||||||||||
| Services |
11,399 | 9,253 | (2,146 | ) | (19 | )% | ||||||||||
| Amortization of acquired technology |
(17,948 | ) | (18,338 | ) | (390 | ) | 2 | % | ||||||||
|
|
|
|
|
|
|
|||||||||||
| Total gross profit |
$ | 301,513 | $ | 324,165 | $ | 22,652 | 8 | % | ||||||||
|
|
|
|
|
|
|
|||||||||||
| Gross margin: |
||||||||||||||||
| Subscriptions |
81 | % | 84 | % | ||||||||||||
| License |
100 | % | 100 | % | ||||||||||||
| Services |
27 | % | 23 | % | ||||||||||||
| Amortization of acquired technology |
(100 | )% | (100 | )% | ||||||||||||
|
|
|
|
|
|||||||||||||
| Total gross margin |
76 | % | 75 | % | ||||||||||||
|
|
|
|
|
|||||||||||||
75
Table of Contents
Subscriptions
Subscriptions gross profit increased by $83.6 million, or 40%, during the year ended March 31, 2019 compared to the year ended March 31, 2018. Subscription gross margin increased from 81% to 84%, during the year ended March 31, 2019 compared to the year ended March 31, 2018.
License
License gross profit decreased by $58.4 million, or 59%, during the year ended March 31, 2019 compared to the year ended March 31, 2018. The decrease was the result of a decline in sales of perpetual and term licenses for our Classic products.
Services
Services gross profit decreased by $2.1 million, or 19%, during the year ended March 31, 2019 compared to the year ended March 31, 2018. Services gross margin decreased from 27% to 23%, during the year ended March 31, 2019 compared to the year ended March 31, 2018.
Operating Expenses
| Year Ended March 31, | Change | |||||||||||||||
| 2018 | 2019 | Amount | Percentage | |||||||||||||
| (in thousands, except percentages) | ||||||||||||||||
| Operating expenses: |
||||||||||||||||
| Research and development |
$ | 58,320 | $ | 76,759 | $ | 18,439 | 32 | % | ||||||||
| Sales and marketing |
145,350 | 178,886 | 33,536 | 23 | % | |||||||||||
| General and administrative |
64,114 | 91,778 | 27,664 | 43 | % | |||||||||||
| Amortization of other intangibles |
50,498 | 47,686 | (2,812 | ) | (6 | )% | ||||||||||
| Restructuring and other |
4,990 | 1,763 | (3,227 | ) | (65 | )% | ||||||||||
|
|
|
|
|
|
|
|
|
|||||||||
| Total operating expenses |
$ | 323,272 | $ | 396,872 | $ | 73,600 | (23 | )% | ||||||||
|
|
|
|
|
|
|
|
|
|||||||||
Research and Development
Research and development expenses increased $18.4 million, or 32%, for the year ended March 31, 2019, as compared to the year ended March 31, 2018. The increase is attributable to higher share-based compensation of $8.7 million, a 20% increase in headcount, resulting in increased personnel and other costs to expand our product offerings of $6.9 million, and lower capitalization of internally developed capitalized software technology of $1.8 million.
Sales and Marketing
Sales and marketing expenses increased $33.5 million, or 23%, for the year ended March 31, 2019, as compared to the year ended March 31, 2018, primarily due to higher share-based compensation of $17.1 million. Further contributing to the increase was a 10% increase in headcount, resulting in an increase of $12.3 million in personnel and other costs to expand our sales organization and marketing program investments to increase awareness and to accelerate lead generation activities.
General and Administrative
General and administrative expenses increased $27.7 million, or 43%, for the year ended March 31, 2019, as compared to the year ended March 31, 2018, primarily due to an increase in share-
76
Table of Contents
based compensation of $19.0 million and transaction costs related to this initial public offering of $7.3 million. Sponsor related costs were approximately $4.9 million for each of the years ended March 31, 2018 and 2019.
Amortization of other intangibles
Amortization of other intangibles decreased by $2.8 million, or 6%, for the year ended March 31, 2019, as compared to the year ended March 31, 2018. The decline is primarily the result of lower amortization for certain intangible assets that are amortized on a systematic basis that reflects the pattern in which the economic benefits of the intangible assets are estimated to be realized.
Restructuring and Other
Restructuring expenses decreased by $3.2 million, or 65%, for the year ended March 31, 2019, as compared to the year ended March 31, 2018, due to lower costs incurred for various restructuring activities to achieve our strategic and financial objectives, lower facility exit charges in relation to plans to optimize our U.S. offices, and lower costs related to a restructuring program designed to align employee resources with our product offering and future plans.
Other Expense, Net
Other expense, net increased by $37.2 million, or 124%, for the year ended March 31, 2019, as compared to the year ended March 31, 2018. The increase in other expense was primarily a result of interest expense on our Term Loans entered into in the second quarter of 2019. See section titled Liquidity and Capital Resources.
Income Tax Benefit
Income tax benefit decreased by $37.3 million to $23.7 million for the year ended March 31, 2019, as compared to an income tax benefit of $61.0 million for the year ended March 31, 2018. The decrease was primarily a result of a $50.0 million tax benefit recorded in the year ended March 31, 2018 for the remeasurement of the U.S. deferred tax liabilities to the newly-enacted 21% corporate federal tax rate under the Tax Cuts and Jobs Act.
77
Table of Contents
Comparison of the Years Ended March 31, 2017 and 2018
The following tables set forth our results of operations for the periods presented. The period-to-period comparison of financial results is not necessarily indicative of financial results to be achieved in future periods.
| Year Ended March 31, | ||||||||||||||||
| 2017 | 2018 | |||||||||||||||
| (in thousands, except percentages) | ||||||||||||||||
| Revenues: |
||||||||||||||||
| Subscriptions |
$ | 232,783 | 57 | % | $ | 257,576 | 65 | % | ||||||||
| License |
130,738 | 32 | % | 98,756 | 25 | % | ||||||||||
| Services |
42,856 | 11 | % | 41,715 | 10 | % | ||||||||||
|
|
|
|
|
|
|
|
|
|||||||||
| Total revenue |
406,377 | 100 | % | 398,047 | 100 | % | ||||||||||
|
|
|
|
|
|
|
|
|
|||||||||
| Cost of revenues: |
||||||||||||||||
| Cost of subscriptions |
52,176 | 13 | % | 48,270 | 12 | % | ||||||||||
| Cost of services |
30,735 | 8 | % | 30,316 | 8 | % | ||||||||||
| Amortization of acquired technology |
19,261 | 5 | % | 17,948 | 5 | % | ||||||||||
|
|
|
|
|
|
|
|
|
|||||||||
| Total cost of revenues(1) |
102,172 | 25 | % | 96,534 | 24 | % | ||||||||||
|
|
|
|
|
|
|
|
|
|||||||||
| Gross profit |
304,205 | 75 | % | 301,513 | 76 | % | ||||||||||
|
|
|
|
|
|
|
|
|
|||||||||
| Operating expenses: |
||||||||||||||||
| Research and development(1) |
52,885 | 13 | % | 58,320 | 15 | % | ||||||||||
| Sales and marketing(1) |
129,971 | 32 | % | 145,350 | 37 | % | ||||||||||
| General and administrative(1) |
49,232 | 12 | % | 64,114 | 16 | % | ||||||||||
| Amortization of other intangibles |
51,947 | 13 | % | 50,498 | 13 | % | ||||||||||
| Restructuring and other |
7,637 | 4,990 | ||||||||||||||
|
|
|
|
|
|||||||||||||
| Total operating expenses |
291,672 | 323,272 | ||||||||||||||
|
|
|
|
|
|||||||||||||
| Income (loss) from operations |
12,533 | (21,759 | ) | |||||||||||||
| Other expense, net |
(28,926 | ) | (30,016 | ) | ||||||||||||
|
|
|
|
|
|||||||||||||
| Loss before taxes |
(16,393 | ) | (51,775 | ) | ||||||||||||
| Income tax benefit |
17,189 | 60,997 | ||||||||||||||
|
|
|
|
|
|||||||||||||
| Net income |
$ | 796 | $ | 9,222 | ||||||||||||
|
|
|
|
|
|||||||||||||
| (1) | Includes share-based compensation expense as follows: |
|
Year Ended March 31, |
||||||||
| 2017 | 2018 | |||||||
| (in thousands) | ||||||||
| Cost of revenue |
$ | 28 | $ | 1,720 | ||||
| Research and development |
71 | 3,858 | ||||||
| Sales and marketing |
122 | 7,536 | ||||||
| General and administrative |
128 | 9,180 | ||||||
|
|
|
|
|
|||||
| Total share-based compensation |
$ | 349 | $ | 22,294 | ||||
|
|
|
|
|
|||||
78
Table of Contents
Revenues
| Year Ended March 31, | Change | |||||||||||||||
| 2017 | 2018 | Amount | Percent | |||||||||||||
| (in thousands, except percentages) | ||||||||||||||||
| Subscriptions |
$ | 232,783 | $ | 257,576 | $ | 24,793 | 11 | % | ||||||||
| License |
130,738 | 98,756 | (31,982 | ) | (24 | )% | ||||||||||
| Services |
42,856 | 41,715 | (1,141 | ) | (3 | )% | ||||||||||
|
|
|
|
|
|
|
|
|
|||||||||
| Total revenues |
$ | 406,377 | $ | 398,047 | $ | (8,330 | ) | (2 | )% | |||||||
|
|
|
|
|
|
|
|
|
|||||||||
Subscriptions
Subscription revenue increased by $24.8 million, or 11%, for the year ended March 31, 2018, as compared to the year ended March 31, 2017, primarily due to the growing adoption of the Dynatrace® platform by new customers combined with existing customers expanding their use of the Dynatrace® platform. Our subscription revenue increased to 65% of total revenue for the years ended March 31, 2018 compared to 57% of total revenue for the years ended March 31, 2017.
License
License revenue decreased by $32.0 million, or 24%, for the year ended March 31, 2018, as compared to the year ended March 31, 2017, primarily due to decline of sales of our Classic products to existing customers as they convert to our Dynatrace® platform.
Services
Services revenue decreased by $1.1 million, or 3%, for the year ended March 31, 2018, as compared to the year ended March 31, 2017. The decrease was primarily a result of a decrease in consulting and training services related to our Classic products. We recognize the revenues associated with professional services on a time and material basis or as we deliver the services, provide the training or when the service term has expired.
Cost of Revenues
| Year Ended March 31, | Change | |||||||||||||||
| 2017 | 2018 | Amount | Percent | |||||||||||||
| (in thousands, except percentages) | ||||||||||||||||
| Cost of subscriptions |
$ | 52,176 | $ | 48,270 | $ | (3,906 | ) | (7 | )% | |||||||
| Cost of services |
30,735 | 30,316 | (419 | ) | (1 | )% | ||||||||||
| Amortization of acquired technology |
19,261 | 17,948 | (1,313 | ) | (7 | )% | ||||||||||
|
|
|
|
|
|
|
|
|
|||||||||
| Total cost of revenue |
$ | 102,172 | $ | 96,534 | $ | (5,638 | ) | (6 | )% | |||||||
|
|
|
|
|
|
|
|
|
|||||||||
Cost of subscriptions
Cost of subscription revenue decreased $3.9 million, or 7%, for the year ended March 31, 2018 compared to the year ended March 31, 2017, primarily due to lower facility and personnel costs. These decreases were partially offset by an increase in amortization of internally developed capitalized software technology, increased cloud-based hosting costs, and higher share-based compensation of $1.2 million.
79
Table of Contents
Cost of services
Cost of services decreased by $0.4 million, or 1% for the year ended March 31, 2018, as compared to the year ended March 31, 2017, primarily due to lower volume of our consulting and training services which was partially offset by higher share-based compensation of $0.5 million.
Amortization of acquired technologies
Amortization of acquired technologies includes amortization related to acquired technology and Thoma Bravos acquisition of us in 2014 for the years ended March 31, 2017 and March 31, 2018, respectively.
Gross Profit and Gross Margin
| Year Ended March 31, | Change | |||||||||||||||
| 2017 | 2018 | Amount | Percent | |||||||||||||
| (in thousands, except percentages) | ||||||||||||||||
| Gross profit: |
||||||||||||||||
| Subscriptions |
$ | 180,607 | $ | 209,306 | $ | 28,699 | 16 | % | ||||||||
| License |
130,738 | 98,756 | (31,982 | ) | (24 | )% | ||||||||||
| Services |
12,121 | 11,399 | (722 | ) | (6 | )% | ||||||||||
| Amortization of acquired technology |
(19,261 | ) | (17,948 | ) | 1,313 | (7 | )% | |||||||||
|
|
|
|
|
|
|
|
|
|||||||||
| Total gross profit |
$ | 304,205 | $ | 301,513 | $ | (2,692 | ) | (1 | )% | |||||||
|
|
|
|
|
|
|
|
|
|||||||||
| Gross margin: |
||||||||||||||||
| Subscriptions |
78 | % | 81 | % | ||||||||||||
| License |
100 | % | 100 | % | ||||||||||||
| Services |
28 | % | 27 | % | ||||||||||||
| Amortization of acquired technology |
(100 | )% | (100 | )% | ||||||||||||
|
|
|
|
|
|||||||||||||
| Total gross margin |
75 | % | 76 | % | ||||||||||||
|
|
|
|
|
|||||||||||||
Subscriptions
Subscriptions gross profit increased by $28.7 million, or 16%, during the year ended March 31, 2018 compared to the year ended March 31, 2017. Subscription gross margin increased from 78% to 81% , during the year ended March 31, 2018 compared to the year ended March 31, 2017.
License
License gross profit decreased by $32.0 million, or 24%, during the year ended March 31, 2018 compared to the year ended March 31, 2017 due to decrease in license revenues.
Services
Services gross profit decreased by $0.7 million, or 6%, during the year ended March 31, 2018 compared to the year ended March 31, 2017. Services gross margin decreased from 28% to 27%, during the year ended March 31, 2018 compared to the year ended March 31, 2017.
80
Table of Contents
Operating Expenses
| Year Ended March 31, | Change | |||||||||||||||
| 2017 | 2018 | Amount | Percentage | |||||||||||||
| (in thousands, except percentages) | ||||||||||||||||
| Operating expenses: |
||||||||||||||||
| Research and development |
$ | 52,885 | $ | 58,320 | $ | 5,435 | 10 | % | ||||||||
| Sales and marketing |
129,971 | 145,350 | 15,379 | 12 | % | |||||||||||
| General and administrative |
49,232 | 64,114 | 14,882 | 30 | % | |||||||||||
| Amortization of other intangibles |
51,947 | 50,498 | (1,449 | ) | (3 | )% | ||||||||||
| Restructuring and other |
7,637 | 4,990 | (2,647 | ) | (35 | )% | ||||||||||
|
|
|
|
|
|
|
|
|
|||||||||
| Total operating expenses |
$ | 291,672 | $ | 323,272 | $ | 31,600 | 11 | % | ||||||||
|
|
|
|
|
|
|
|
|
|||||||||
Research and Development
Research and development expenses increased $5.4 million, or 10%, for the year ended March 31, 2018, as compared to the year ended March 31, 2017. The increase is attributable to higher share-based compensation of $3.8 million, lower capitalization of internally developed capitalized software technology of $1.6 million, and a 7% increase in headcount, resulting in increased personnel costs to enhance and expand our product offerings.
Sales and Marketing
Sales and marketing expenses increased $15.4 million, or 12%, for the year ended March 31, 2018, as compared to the year ended March 31, 2017, primarily due to higher share-based compensation of $7.4 million. Further contributing to the increase was a 17% increase in headcount, resulting in an increase in sales personnel costs to support business growth and marketing program investments to expand our customer base and to support increased penetration into our existing customers.
General and Administrative
General and administrative expenses increased $14.9 million, or 30%, for the year ended March 31, 2018, as compared to the year ended March 31, 2017, primarily due to an increase in share-based compensation of $9.1 million. Further contributing to the increase was an increase in personnel costs to support the growth and scale of the business, higher professional fees and other costs incurred primarily related to this initial public offering of $2.9 million.
Amortization of other intangibles
Amortization of other intangibles decreased by $1.5 million, or 3%, for the year ended March 31, 2018, as compared to the year ended March 31, 2017. The decline is primarily the result of lower amortization for certain intangible assets that are amortized on a basis that reflects the pattern in which the economic benefits of the intangible assets are estimated to be realized.
Restructuring and Other
Restructuring expenses decreased by $2.6 million, or 35%, for the year ended March 31, 2018, as compared to the year ended March 31, 2017, partially due to lower facility exit charges in relation to plans to optimize our U.S. offices. The remainder of the decrease is due to lower costs incurred for various other restructuring activities to achieve our strategic and financial objectives.
81
Table of Contents
Other Expense, Net
Other expense, net increased by $1.1 million, or 4%, for the year ended March 31, 2018, as compared to the year ended March 31, 2017. The increase was primarily a result of fluctuations in foreign currency exchange rates on transactions denominated in foreign currencies.
Income Tax Benefit
Income tax benefit increased by $43.8 million to $61.0 million for the year ended March 31, 2018, as compared to an income tax benefit of $17.2 million for the year ended March 31, 2017. The increase was primarily a result of a $50.0 million tax benefit recorded for the year ended March 31, 2018 for the remeasurement of the U.S. deferred tax liabilities to the newly-enacted 21% corporate federal tax rate under the Tax Cuts and Jobs Act.
82
Table of Contents
Quarterly Results of Operations
The following tables set forth our unaudited quarterly consolidated statements of operations data for each of the quarters indicated as well as the percentage that each line item represents of our total revenue for each quarter presented. The information for each quarter has been prepared on a basis consistent with our audited consolidated financial statements included in this prospectus and reflect, in the opinion of management, all adjustments of a normal, recurring nature that are necessary for a fair presentation of the financial information contained in those statements. Our historical results are not necessarily indicative of the results that may be expected in the future. The following quarterly financial data should be read in conjunction with our consolidated financial statements included elsewhere in this prospectus.
| Fiscal Quarter Ended | ||||||||||||||||||||||||||||||||
| 6/30/2017 | 9/30/2017 | 12/31/2017 | 3/31/2018 | 6/30/2018 | 9/30/2018 | 12/31/2018 | 3/31/2019 | |||||||||||||||||||||||||
| (in thousands) | ||||||||||||||||||||||||||||||||
| Revenues: |
||||||||||||||||||||||||||||||||
| Subscriptions |
$ | 59,189 | $ | 62,806 | $ | 66,446 | $ | 69,135 | $ | 77,924 | $ | 82,389 | $ | 91,661 | $ | 97,856 | ||||||||||||||||
| License |
21,269 | 25,762 | 33,110 | 18,615 | 11,079 | 9,662 | 12,064 | 7,549 | ||||||||||||||||||||||||
| Services |
9,927 | 10,023 | 10,290 | 11,475 | 9,218 | 9,836 | 10,965 | 10,763 | ||||||||||||||||||||||||
|
|
|
|
|
|
|
|
|
|
|
|
|
|
|
|
|
|||||||||||||||||
| Total revenue |
90,385 | 98,591 | 109,846 | 99,225 | 98,221 | 101,887 | 114,690 | 116,168 | ||||||||||||||||||||||||
|
|
|
|
|
|
|
|
|
|
|
|
|
|
|
|
|
|||||||||||||||||
| Cost of revenues: |
||||||||||||||||||||||||||||||||
| Cost of subscriptions |
12,017 | 11,881 | 12,134 | 12,238 | 13,132 | 14,256 | 13,534 | 16,012 | ||||||||||||||||||||||||
| Cost of services |
7,245 | 7,452 | 7,335 | 8,284 | 6,895 | 7,522 | 7,731 | 9,381 | ||||||||||||||||||||||||
| Amortization of acquired technology |
4,656 | 4,487 | 4,318 | 4,487 | 4,664 | 4,558 | 4,558 | 4,558 | ||||||||||||||||||||||||
|
|
|
|
|
|
|
|
|
|
|
|
|
|
|
|
|
|||||||||||||||||
| Total cost of revenues(1) |
23,918 | 23,820 | 23,787 | 25,009 | 24,691 | 26,336 | 25,823 | 29,951 | ||||||||||||||||||||||||
|
|
|
|
|
|
|
|
|
|
|
|
|
|
|
|
|
|||||||||||||||||
| Gross profit |
66,467 | 74,771 | 86,059 | 74,216 | 73,530 | 75,551 | 88,867 | 86,217 | ||||||||||||||||||||||||
|
|
|
|
|
|
|
|
|
|
|
|
|
|
|
|
|
|||||||||||||||||
| Operating expenses: |
||||||||||||||||||||||||||||||||
| Research and development(1) |
13,310 | 13,531 | 15,330 | 16,149 | 17,896 | 19,690 | 17,643 | 21,530 | ||||||||||||||||||||||||
| Sales and marketing(1) |
32,548 | 34,503 | 36,643 | 41,656 | 42,509 | 44,883 | 43,275 | 48,219 | ||||||||||||||||||||||||
| General and administrative(1) |
15,701 | 17,888 | 17,247 | 13,278 | 19,881 | 25,211 | 19,672 | 27,014 | ||||||||||||||||||||||||
| Amortization of other intangibles |
12,583 | 12,667 | 12,751 | 12,497 | 12,049 | 11,964 | 11,879 | 11,794 | ||||||||||||||||||||||||
| Restructuring and other |
663 | 2,688 | 333 | 1,306 | 410 | 73 | (24 | ) | 1,304 | |||||||||||||||||||||||
|
|
|
|
|
|
|
|
|
|
|
|
|
|
|
|
|
|||||||||||||||||
| Total operating expenses |
74,805 | 81,277 | 82,304 | 84,886 | 92,745 | 101,821 | 92,445 | 109,861 | ||||||||||||||||||||||||
|
|
|
|
|
|
|
|
|
|
|
|
|
|
|
|
|
|||||||||||||||||
| (Loss) income from operations |
(8,338 | ) | (6,506 | ) | 3,755 | (10,670 | ) | (19,215 | ) | (26,270 | ) | (3,578 | ) | (23,644 | ) | |||||||||||||||||
| Other expense, net |
(7,656 | ) | (8,011 | ) | (7,093 | ) | (7,256 | ) | (7,824 | ) | (17,934 | ) | (21,206 | ) | (20,240 | ) | ||||||||||||||||
|
|
|
|
|
|
|
|
|
|
|
|
|
|
|
|
|
|||||||||||||||||
| Loss before taxes |
(15,994 | ) | (14,517 | ) | (3,338 | ) | (17,926 | ) | (27,039 | ) | (44,204 | ) | (24,784 | ) | (43,884 | ) | ||||||||||||||||
| Income tax benefit (expense) |
5,786 | 2,689 | 48,058 | 4,464 | 3,483 | 4,266 | 2,682 | 13,286 | ||||||||||||||||||||||||
|
|
|
|
|
|
|
|
|
|
|
|
|
|
|
|
|
|||||||||||||||||
| Net (loss) income |
$ | (10,208 | ) | $ | (11,828 | ) | $ | 44,720 | $ | (13,462 | ) | $ | (23,556 | ) | $ | (39,938 | ) | $ | (22,102 | ) | $ | (30,598 | ) | |||||||||
|
|
|
|
|
|
|
|
|
|
|
|
|
|
|
|
|
|||||||||||||||||
83
Table of Contents
| (1) | Includes share-based compensation expense as follows: |
| Fiscal Quarter Ended | ||||||||||||||||||||||||||||||||
| 6/30/2017 | 9/30/2017 | 12/31/2017 | 3/31/2018 | 6/30/2018 | 9/30/2018 | 12/31/2018 | 3/31/2019 | |||||||||||||||||||||||||
| (in thousands) | ||||||||||||||||||||||||||||||||
| Cost of revenue |
$ | 91 | $ | 253 | $ | 790 | $ | 586 | $ | 1,084 | $ | 1,906 | $ | 476 | $ | 2,311 | ||||||||||||||||
| Research and development |
226 | 560 | 1,766 | 1,306 | 2,418 | 4,163 | 1,009 | 4,976 | ||||||||||||||||||||||||
| Sales and marketing |
361 | 1,062 | 3,412 | 2,701 | 4,463 | 7,998 | 2,179 | 10,033 | ||||||||||||||||||||||||
| General and administrative |
546 | 1,166 | 4,548 | 2,920 | 5,233 | 8,963 | 2,393 | 11,546 | ||||||||||||||||||||||||
|
|
|
|
|
|
|
|
|
|
|
|
|
|
|
|
|
|||||||||||||||||
| Total share-based compensation |
$ | 1,224 | $ | 3,041 | $ | 10,516 | $ | 7,513 | $ | 13,198 | $ | 23,030 | $ | 6,057 | $ | 28,866 | ||||||||||||||||
|
|
|
|
|
|
|
|
|
|
|
|
|
|
|
|
|
|||||||||||||||||
The following table shows our revenues and costs as a percentage of total revenue:
| Fiscal Quarter Ended | ||||||||||||||||||||||||||||||||
| 6/30/2017 | 9/30/2017 | 12/31/2017 | 3/31/2018 | 6/30/2018 | 9/30/2018 | 12/31/2018 | 3/31/2019 | |||||||||||||||||||||||||
| (as a % of revenue) | ||||||||||||||||||||||||||||||||
| Revenues: |
||||||||||||||||||||||||||||||||
| Subscriptions |
65.5 | % | 63.7 | % | 60.5 | % | 69.7 | % | 79.3 | % | 80.9 | % | 79.9 | % | 84.2 | % | ||||||||||||||||
| License |
23.5 | 26.1 | 30.1 | 18.8 | 11.3 | 9.5 | 10.5 | 6.5 | ||||||||||||||||||||||||
| Services |
11.0 | 10.2 | 9.4 | 11.6 | 9.4 | 9.7 | 9.6 | 9.3 | ||||||||||||||||||||||||
|
|
|
|
|
|
|
|
|
|
|
|
|
|
|
|
|
|||||||||||||||||
| Total revenue |
100.0 | 100.0 | 100.0 | 100.0 | 100.0 | 100.0 | 100.0 | 100.0 | ||||||||||||||||||||||||
|
|
|
|
|
|
|
|
|
|
|
|
|
|
|
|
|
|||||||||||||||||
| Cost of revenues: |
||||||||||||||||||||||||||||||||
| Cost of subscriptions |
13.3 | 12.1 | 11.0 | 12.3 | 13.4 | 14.0 | 11.8 | 13.8 | ||||||||||||||||||||||||
| Cost of services |
8.0 | 7.6 | 6.7 | 8.3 | 7.0 | 7.4 | 6.7 | 8.1 | ||||||||||||||||||||||||
| Amortization of acquired technology |
5.2 | 4.6 | 3.9 | 4.5 | 4.7 | 4.5 | 4.0 | 3.9 | ||||||||||||||||||||||||
|
|
|
|
|
|
|
|
|
|
|
|
|
|
|
|
|
|||||||||||||||||
| Total cost of revenues(1) |
26.5 | 24.2 | 21.7 | 25.2 | 25.1 | 25.8 | 22.5 | 25.8 | ||||||||||||||||||||||||
|
|
|
|
|
|
|
|
|
|
|
|
|
|
|
|
|
|||||||||||||||||
| Gross profit |
73.5 | 75.8 | 78.3 | 74.8 | 74.9 | 74.2 | 77.5 | 74.2 | ||||||||||||||||||||||||
|
|
|
|
|
|
|
|
|
|
|
|
|
|
|
|
|
|||||||||||||||||
| Space |
||||||||||||||||||||||||||||||||
| Operating expenses: |
||||||||||||||||||||||||||||||||
| Research and development(1) |
14.7 | 13.7 | 14.0 | 16.3 | 18.2 | 19.3 | 15.4 | 18.5 | ||||||||||||||||||||||||
| Sales and marketing(1) |
36.0 | 35.0 | 33.4 | 42.0 | 43.3 | 44.1 | 37.7 | 41.5 | ||||||||||||||||||||||||
| General and administrative(1) |
17.4 | 18.1 | 15.7 | 13.4 | 20.2 | 24.7 | 17.2 | 23.3 | ||||||||||||||||||||||||
| Amortization of other intangibles |
13.9 | 12.8 | 11.6 | 12.6 | 12.3 | 11.7 | 10.4 | 10.2 | ||||||||||||||||||||||||
| Restructuring and other |
0.7 | 2.7 | 0.3 | 1.3 | 0.4 | 0.1 | 0.0 | 1.1 | ||||||||||||||||||||||||
|
|
|
|
|
|
|
|
|
|
|
|
|
|
|
|
|
|||||||||||||||||
| Total operating expenses |
82.8 | 82.4 | 74.9 | 85.5 | 94.4 | 99.9 | 80.6 | 94.6 | ||||||||||||||||||||||||
| (Loss) income from operations |
(9.2 | ) | (6.6 | ) | 3.4 | (10.8 | ) | (19.6 | ) | (25.8 | ) | (3.1 | ) | (20.4 | ) | |||||||||||||||||
| Other expense, net |
(8.5 | ) | (8.1 | ) | (6.5 | ) | (7.3 | ) | (8.0 | ) | (17.6 | ) | (18.5 | ) | (17.4 | ) | ||||||||||||||||
|
|
|
|
|
|
|
|
|
|
|
|
|
|
|
|
|
|||||||||||||||||
| Loss before taxes |
(17.7 | ) | (14.7 | ) | (3.0 | ) | (18.1 | ) | (27.5 | ) | (43.4 | ) | (21.6 | ) | (37.8 | ) | ||||||||||||||||
| Income tax benefit (expense) |
6.4 | 2.7 | 43.8 | 4.5 | 3.5 | 4.2 | 2.3 | 11.4 | ||||||||||||||||||||||||
|
|
|
|
|
|
|
|
|
|
|
|
|
|
|
|
|
|||||||||||||||||
| Net (loss) income |
(11.3 | %) | (12.0 | %) | 40.7 | % | (13.6 | %) | (24.0 | %) | (39.2 | %) | (19.3 | %) | (26.3 | %) | ||||||||||||||||
|
|
|
|
|
|
|
|
|
|
|
|
|
|
|
|
|
|||||||||||||||||
84
Table of Contents
| (1) | Includes share-based compensation expense as follows: |
| Fiscal Quarter Ended | ||||||||||||||||||||||||||||||||
| 6/30/2017 | 9/30/2017 | 12/31/2017 | 3/31/2018 | 6/30/2018 | 9/30/2018 | 12/31/2018 | 3/31/2019 | |||||||||||||||||||||||||
| (as a % of revenue) | ||||||||||||||||||||||||||||||||
| Cost of revenue |
0.1 | % | 0.3 | % | 0.7 | % | 0.6 | % | 1.1 | % | 1.9 | % | 0.4 | % | 2.0 | % | ||||||||||||||||
| Research and development |
0.3 | 0.6 | 1.6 | 1.3 | 2.5 | 4.1 | 0.9 | 4.3 | ||||||||||||||||||||||||
| Sales and marketing |
0.4 | 1.1 | 3.1 | 2.7 | 4.5 | 7.8 | 1.9 | 8.6 | ||||||||||||||||||||||||
| General and administrative |
0.6 | 1.2 | 4.1 | 2.9 | 5.3 | 8.8 | 2.1 | 9.9 | ||||||||||||||||||||||||
|
|
|
|
|
|
|
|
|
|
|
|
|
|
|
|
|
|||||||||||||||||
| Total share-based compensation |
1.4 | % | 3.1 | % | 9.6 | % | 7.6 | % | 13.4 | % | 22.6 | % | 5.3 | % | 24.8 | % | ||||||||||||||||
|
|
|
|
|
|
|
|
|
|
|
|
|
|
|
|
|
|||||||||||||||||
Quarterly Trends in Revenue
Our quarterly subscription revenue increased in each period presented primarily due to an expanding Dynatrace® customer base as well as customers expanding their use of the Dynatrace® platform. Sales of subscriptions to our platform also continue to grow as a result of the expanding breadth and functionality of our platform, increasing brand awareness, and the success of our sales efforts with new and existing customers. We generally recognize subscription revenue over the term of the contract period; therefore, changes in our sales activity in a period may not be apparent as a change to our revenue until future periods.
Our quarterly license revenue has generally declined on a quarterly basis due to the declining sales of our Classic products. We expect to continue to experience a decline in license revenue when comparing similar periods year-over-year as a result of our focus on converting our customer base to the new Dynatrace® platform.
Our quarterly services revenue fluctuates quarter to quarter based on the demand for our consulting and training services.
Quarterly Trends in Operating Expenses
Our operating expenses have generally increased sequentially as a result of our growth and are primarily related to increases in personnel-related costs to support our expanded operations, continued investment in our platform, expanding commercial and marketing investments. and higher share-based compensation expense.
Liquidity and Capital Resources
As of March 31, 2019, we had $51.3 million of cash and cash equivalents and $59.5 million available under our revolving credit facility. We have financed our operations primarily through cash generated from operations. We believe that our existing cash, cash equivalents, and short-term investment balances, together with cash generated from operations, will be sufficient to meet our working capital and capital expenditure requirements for at least the next twelve months.
Our future capital requirements will depend on many factors, including our growth rate, the timing and extent of spending to support research and development efforts, the continued expansion of sales and marketing activities, the introduction of new and enhanced products, seasonality of our billing
85
Table of Contents
activities, timing and extent of spending to support our growth strategy, and the continued market acceptance of our products. In the event that additional financing is required from outside sources, we may not be able to raise such financing on terms acceptable to us or at all. If we are unable to raise additional capital when desired, our business, operating results, and financial condition would be adversely affected.
To date, we have financed operations primarily through license fees, subscription fees, consulting and training fees. Our principal uses of cash are funding operations, capital expenditures, debt payments and interest expense. Over the past three years cash flows from customer collections have increased. However, operating expenses have also increased as we have invested in growing our business. Our operating cash requirements may increase in the future as we continue to invest in the strategic growth of our company.
Our Credit Facilities
In anticipation of separation from Compuware Corporation, on August 23, 2018, we entered into a Senior Secured First Lien Credit Agreement and a Senior Secured Second Lien Credit Agreement, or our Term Loans, consisting of a $950.0 million first lien term loan and a $170.0 million second lien term loan, each agreement made by and among the Company, Dynatrace Intermediate LLC, as Guarantor, Jefferies Finance LLC, as Administrative Agent and Collateral Agent, and certain lending parties. The First Lien Credit Agreement further provided a $60.0 million revolving credit facility which includes a letter of credit sub-facility with an aggregate limit equal to the lessor of $15.0 million and the aggregate unused amount of the revolving credit facility then in effect. The first lien term loan and second lien term loan mature on August 23, 2025 and August 23, 2026, respectively, and the revolving credit facility matures on August 23, 2023.
As of March 31, 2019, the balance outstanding under the Term Loans was $1,036.3 million and is included in current portion of long-term debt and long-term debt on our consolidated balance sheet. We had $59.5 million available under the revolving credit facility and $0.5 million of letters of credit outstanding.
All of our obligations under the Term Loans are guaranteed by our existing and future domestic subsidiaries and, subject to certain exceptions, secured by a security interest in substantially all of our tangible and intangible assets.
We intend to use $ million of our net proceeds from this offering to repay a portion of the borrowings outstanding under our Term Loans (repayment will be subject to a repayment premium of %). See the section titled Use of Proceeds for additional information regarding our intended use of our net proceeds from this offering.
Summary of Cash Flows
| Year Ended March 31, | ||||||||||||
| 2017 | 2018 | 2019 | ||||||||||
| (in thousands) | ||||||||||||
| Cash provided by operating activities(1) |
$ | 94,560 | $ | 118,838 | $ | 147,141 | ||||||
| Cash used in investing activities |
(13,876 | ) | (26,531 | ) | (9,250 | ) | ||||||
| Cash used in financing activities |
(63,019 | ) | (75,501 | ) | (161,482 | ) | ||||||
| Effect of exchange rate changes on cash and cash equivalents |
(1,338 | ) | 2,827 | (2,676 | ) | |||||||
|
|
|
|
|
|
|
|||||||
| Net increase (decrease) in cash and cash equivalents |
$ | 16,327 | $ | 19,633 | $ | (26,267 | ) | |||||
|
|
|
|
|
|
|
|||||||
86
Table of Contents
| (1) | Net cash provided by operating activities includes cash payments for interest as follows: |
| Year Ended March 31, | ||||||||||||
| 2017 | 2018 | 2019 | ||||||||||
| (in thousands) | ||||||||||||
| Cash paid for interest |
$ | 163 | $ | 38 | $ | 40,969 | ||||||
Operating Activities
For the year ended March 31, 2018, cash provided by operating activities was $118.8 million as a result of net income of $9.2 million, adjusted by non-cash charges of $31.7 million and a change of $77.9 million in our operating assets and liabilities. The non-cash charges are primarily comprised of depreciation and amortization of $82.2 million, share-based compensation of $22.3 million, and deferred income taxes of $73.2 million. The change in our net operating assets and liabilities was primarily the result of an increase in deferred revenue of $77.9 million due to the timing of billings and cash received in advance of revenue recognition primarily for subscription and support services, partially offset by an increase in accounts receivable of $14.7 million due to the timing of receipts of payments from customers, and an increase in deferred commissions of $14.1 million.
For the year ended March 31, 2019, cash provided by operating activities was $147.1 million as a result of a net loss of $116.2 million, adjusted by non-cash charges of $118.5 million and a change of $144.8 million in our operating assets and liabilities. The non-cash charges are primarily comprised of depreciation and amortization of $80.1 million, share-based compensation of $71.2 million, and deferred income taxes of $34.2 million. The change in our net operating assets and liabilities was primarily the result of an increase in deferred revenue of $127.0 million due to the timing of billings and cash received in advance of revenue recognition primarily for subscription and support services and a decrease in accounts receivable of $18.0 million due to the timing of receipts of payments from customers, partially offset by an increase in deferred commissions of $20.0 million, and an increase in prepayments and other assets of $12.7 million.
Investing Activities
Cash used in investing activities during the year ended March 31, 2018 was $26.5 million, primarily as a result of acquisitions of $11.3 million, purchases of property and equipment of $11.6 million, and capitalized software additions of $3.6 million.
Cash used in investing activities during the year ended March 31, 2019 was $9.3 million, primarily as a result of the purchase of property and equipment of $7.4 million and capitalized software additions of $1.9 million.
Financing Activities
Cash used in financing activities during the year ended March 31, 2018 was $75.5 million, primarily as a result of payments to related parties of $74.6 million and equity repurchases of $0.9 million.
Cash used in financing activities during the year ended March 31, 2019 was $161.5 million, primarily as a result of payments to related parties of $1,177.0 million, repayments on our Term Loans of $83.9 million, debt issuance costs of $16.3 million and equity repurchases of $0.6 million, partially offset by $1,120.0 million in proceeds from Term Loans.
87
Table of Contents
Contractual Obligations and Commitments
Under various agreements, we are obligated to make future cash payments. These include payments under our long-term debt agreements, rent payments required under operating lease agreements, interest obligations on our Term Loans, and other contractual commitments.
The following table summarizes our payments under contractual obligations as of March 31, 2019:
| Payments Due by Period | ||||||||||||||||||||
| Total | Less than 1 Year |
1 to 3 Years |
3 to 5 Years |
More than 5 Years |
||||||||||||||||
| (in thousands) | ||||||||||||||||||||
| Operating lease obligations |
$ | 75,092 | $ | 13,464 | $ | 22,325 | $ | 17,669 | $ | 21,634 | ||||||||||
| Related party consulting agreement(1) |
2,400 | 2,400 | | | | |||||||||||||||
| Term Loansprincipal(2) |
1,036,314 | 9,500 | 19,000 | 19,000 | 988,814 | |||||||||||||||
| Term Loansinterest(3) |
417,216 | 64,298 | 127,547 | 127,372 | 97,999 | |||||||||||||||
| Revolving credit facility(4) |
| | | | | |||||||||||||||
|
|
|
|
|
|
|
|
|
|
|
|||||||||||
| Total |
$ | 1,531,022 | $ | 89,662 | $ | 168,872 | $ | 164,041 | $ | 1,108,447 | ||||||||||
|
|
|
|
|
|
|
|
|
|
|
|||||||||||
| (1) | Amounts represent our advisory services agreement with Thoma Bravo for which contractual consulting fees of $1.2 million are due per quarter until termination of the advisory services agreement upon the completion of this offering. |
| (2) | The amounts included in the table above represent principal maturities only. We intend to use a portion of our net proceeds from this offering to repay $ million of the borrowings outstanding under our Term Loans. Please see the section titled Use of Proceeds for more information. |
| (3) | Amounts represent estimated future interest payments on borrowings under our Term Loans, which are floating rate instruments and were estimated using the interest rate effective at March 31, 2019 of approximately 5.7% and 9.5% for the first lien term loan and second lien term loan, respectively, multiplied by the principal outstanding of the respective Term Loans on March 31, 2019 of $947.6 million and $88.7 million, respectively. |
| (4) | As of March 31, 2019, we had no outstanding borrowings under our revolving credit facility, $0.5 million of letters of credit outstanding, and $59.5 million was available for borrowing under our revolving credit facility. |
Off-Balance Sheet Arrangements
We do not have any off-balance sheet arrangements.
Quantitative and Qualitative Disclosures About Market Risk
We are exposed to market risk in the ordinary course of our business. Market risk represents the risk of loss that may impact our financial position due to adverse changes in financial market prices and rates. Our market risk exposure is primarily a result of fluctuations in foreign currency exchange rates and interest rates and inflation. We do not hold or issue financial instruments for trading purposes.
Foreign Currency Exchange Risk
Our reporting currency is the U.S. dollar. Due to our international operations, we have foreign currency risks related to operating expense denominated in currencies other than the U.S. dollar,
88
Table of Contents
particularly the euro. As of March 31, 2018, and 2019, our cash and cash equivalents included $34.1 million and $36.3 million, respectively, held in currencies other than the U.S. dollar. Decreases in the relative value of the U.S. dollar to other currencies may negatively affect our operating results as expressed in U.S. dollars. These amounts are included in other expense, net in our consolidated statements of operations.
Our results of operations and cash flows are subject to fluctuations due to changes in foreign currency exchange rates because, although substantially all of our revenue is generated in U.S. dollars, our expenses are generally denominated in the currencies of the jurisdictions in which we conduct our operations, which are primarily in the United States, Europe and Asia.
Our results of operations and cash flows could therefore be adversely affected in the future due to changes in foreign exchange rates. We do not believe that an immediate 10% increase or decrease in the relative value of the U.S. dollar to other currencies would have a material effect on our results of operations or cash flows, and to date, we have not engaged in any hedging strategies with respect to foreign currency transactions. As our international operations grow, we will continue to reassess our approach to manage our risk relating to fluctuations in currency rates, and we may choose to engage in the hedging of foreign currency transactions in the future.
Interest Rate Risk
We had cash and cash equivalents of $77.6 million and $51.3 million as of March 31, 2018, and 2019, respectively, consisting of bank deposits, commercial paper, and money market funds. These interest-earning instruments carry a degree of interest rate risk. To date, fluctuations in our interest income have not been significant. We do not enter into investments for trading or speculative purposes and have not used any derivative financial instruments to manage our interest rate risk exposure. Due to the short-term nature of these investments, we have not been exposed to, nor do we anticipate being exposed to, material risks due to changes in interest rates.
At March 31, 2019, we also had in place a $60.0 million revolving credit facility, with availability of $59.5 million, and approximately $1,036.3 million in Term Loans, both of which bear interest based on the adjusted LIBOR rate, as defined in the agreement, plus an applicable margin. At March 31, 2019, the applicable margin was 3.25% for the first lien term loan and revolving credit facility, respectively, and 7.00% for the second lien term loan. A hypothetical 10% change in interest rates during any of the periods presented would not have had a material impact on our consolidated financial statements.
We have an agreement to maintain cash balances at a financial institution of no less than $2.4 million as collateral for several letters of credit in favor of our landlords.
Inflation Risk
We do not believe that inflation has had a material effect on our business, financial condition or results of operations in 2017, 2018, or 2019 because substantially all of our sales are denominated in U.S. dollars, which have not been subject to material currency inflation, and our operating expenses that are denominated in currencies other than U.S. dollars have not been subject to material currency inflation.
Critical Accounting Policies and Estimates
We prepare our consolidated financial statements in accordance with generally accepted accounting principles in the United States. The preparation of consolidated financial statements also
89
Table of Contents
requires us to make estimates and assumptions that affect the reported amounts of assets, liabilities, revenues, costs and expenses and related disclosures. We base our estimates on historical experience and on various other assumptions that we believe to be reasonable under the circumstances. Actual results could differ significantly from the estimates made by our management. To the extent that there are differences between our estimates and actual results, our future financial statement presentation, financial condition, results of operations and cash flows will be affected.
We believe that the assumptions and estimates associated with revenue recognition, share-based compensation, income taxes, goodwill, and impairment of long-lived assets have the greatest potential impact on our consolidated financial statements. Therefore, we consider these to be our critical accounting policies and estimates. Accordingly, we believe these are the most critical to fully understand and evaluate our financial condition and results of operations.
Revenue Recognition
We recognize revenue from contracts with customers using the five-step method described in Note 2 of the notes to our consolidated financial statements, included elsewhere in this prospectus. At contract inception we evaluate whether two or more contracts should be combined and accounted for as a single contract and whether the combined or single contract includes more than one performance obligation. We combine contracts entered into at or near the same time with the same customer if (i) we determine that the contracts are negotiated as a package with a single commercial objective, (ii) the amount of consideration to be paid in one contract depends on the price or performance of the other contract, or (iii) the services promised in the contracts are a single performance obligation.
Our performance obligations consist of (i) subscription and support services, (ii) licenses for our Classic products, and (iii) professional and other services. Contracts that contain multiple performance obligations require an allocation of the transaction price to each performance obligation based on their relative standalone selling price. We determine standalone selling price, or SSP, for all our performance obligations using observable inputs, such as standalone sales and historical contract pricing. SSP is consistent with our overall pricing objectives, taking into consideration the type of subscription services and professional and other services. SSP also reflects the amount we would charge for that performance obligation if it were sold separately in a standalone sale, and the price we would sell to similar customers in similar circumstances. We have determined that our pricing for software licenses and subscription services is highly variable and we therefore allocate the transaction price to those performance obligations using the residual approach.
In general, we satisfy the majority of our performance obligations over time as we transfer the promised services to our customers. We review the contract terms and conditions to evaluate (i) the timing and amount of revenue recognition, (ii) the related contract balances, and (iii) our remaining performance obligations. We also estimate the number of hours expected to be incurred based on an expected hours approach that considers historical hours incurred for similar projects based on the types and sizes of customers. These evaluations require significant judgment that could affect the timing and amount of revenue recognized.
Share-based Compensation
Compensation expense relating to share-based payments is recognized in earnings using a fair-value measurement method. We use the straight-line attribution method of recognizing compensation expense over the vesting period. The estimated fair value of equity awards is expensed on a straight-line basis over the period from grant date to remaining requisite service period which is generally the vesting period. Equity units classified as liability awards are measured at fair value at the end of each reporting period until vested.
90
Table of Contents
The fair value of each new equity award is estimated on the date of grant using the option-pricing model, or OPM, or a hybrid of the probability-weighted expected return method, or PWERM, and the OPM, which we refer to as the hybrid method. Use of the OPM model and hybrid method requires that we make assumptions as to the volatility of our equity units, the expected term to expiration or a liquidity event, and the risk-free interest rate for a period that approximates the expected term of our equity units. Because we are currently a privately-held company with limited operating history and no company-specific historical and implied volatility information and accordingly, we estimate our expected volatility based on the historical volatility of a group of publicly traded peer companies. We expect to continue to do so until such time as we have adequate historical data regarding the volatility of our traded stock price. We use the simplified method prescribed by SEC Staff Accounting Bulletin No. 107, Share-Based Payment, to calculate the expected term of units granted to employees and directors. We base the expected term of options granted to non-employees on the contractual term of the units. We determine the risk-free interest rate by reference to the U.S. Constant Maturity Treasury yield curve in effect as of the valuation date with the maturity matching the expected term.
The following key assumptions were used to determine the fair value of the equity units as of the valuation date:
| 2017 | 2018 | 2019 | ||||||||||
| Expected volatility |
110 | % | 50 | % | 50% - 60 | % | ||||||
| Expected term (years) |
3.75 | 2.50 | 1.0 - 1.5 | |||||||||
| Risk-free interest rate |
1.67 | % | 2.34 | % | 2.33% - 2.40 | % | ||||||
Prior to our initial public offering, given the absence of a public trading market of our equity units and in accordance with the American Institute of Certified Public Accountants Accounting and Valuation Guide, Valuation of Privately-Held Company Equity Securities Issued as Compensation, or the Practice Aid, our board of directors determined the fair value of our MIUs and AUs exercising reasonable judgment and considering numerous objective and subjective factors.
These factors included:
| | independent third-party valuations of our equity units; |
| | the rights, preferences and privileges of each class of our equity units; |
| | our financial condition, results of operations and capital resources; |
| | the industry outlook; |
| | the valuation of comparable companies; |
| | the lack of marketability of our equity units; |
| | the likelihood of achieving a liquidity event, such as an initial public offering or a sale of our company given prevailing market conditions; |
| | the history and nature of our business, industry trends and competitive environment; and |
| | general economic outlook including economic growth, inflation and unemployment, interest rate environment and global economic trends. |
The enterprise value of our business was primarily estimated using a combination of income and market approaches. The income approach estimates the equity value of the business based on the cash flows that it expects to generate over its remaining life. These future cash flows are discounted to their present values using a rate of return appropriate for the risk of achieving the business projected cash flows. The present value of the estimated cash flows is then added to the present value
91
Table of Contents
equivalent of the residual value of the business at the end of the projected period to calculate the business enterprise value. The market approach considers market values of comparable public companies in a similar line of business that are publicly traded.
The Practice Aid identifies various available methods for allocating enterprise value across classes and series of capital stock to determine the estimated fair value of common stock at each valuation date. In accordance with the Practice Aid, we considered the following methods:
OPM. Under the OPM methodology, we utilized a Contingent Claim Analysis, or CCA, where each class of security is modeled as a call option with the unique claim on the assets of Dynatrace. The characteristics of each class of stock determine the uniqueness of each class of stocks claim on the companys assets, and these characteristics are modeled as distinct call options. Under this method, the equity unit has value only if the funds available for distribution to shareholders exceed the value of the liquidation preferences at the time of a liquidity event. A discount for lack of marketability of the equity unit is then applied to arrive at an indication of value for the equity unit.
The OPM uses the Black-Scholes formula to price the call options. This model defines the fair values of equity units as functions of the current fair value of a company and uses assumptions such as the anticipated timing of a potential liquidity event and the estimated volatility of the equity units.
PWERM. Under the PWERM methodology, the fair value of equity units is estimated based upon an analysis of future values for the company, assuming various outcomes. The equity unit value is based on the probability-weighted present value of expected future investment returns considering each of the possible outcomes available as well as the rights of each class of equity unit. The future value of the equity unit under each outcome is discounted back to the valuation date at an appropriate risk-adjusted discount rate and probability weighted to arrive at an indication of value for the equity unit.
Hybrid Method. The hybrid method is a PWERM where the equity value is calculated using an OPM. In the hybrid method used by us, we considered an initial public offering as the other potential future liquidity event. The relative probability of the initial public offering scenario was determined based on an analysis of market conditions at the time and our expectations as to the timing and likely prospects of the initial public offering at each valuation date. We then discounted that future value back to the valuation date at an appropriate discount rate.
Based on the company being privately held, and other relevant factors, our board of directors determined that the OPM was the most appropriate method for allocating our enterprise value to determine the estimated fair value of our equity awards for the valuations performed for fiscal 2017 and fiscal 2018, which resulted in our board of directors determining that the fair value of our equity awards were $0.04 and $1.64, respectively. Following its determination in fiscal 2019 that we should explore a potential initial public offering, our board of directors determined that the Hybrid Method was the most appropriate method for allocating our enterprise value to determine the estimated fair value of our equity units for the valuation performed for fiscal 2019 which resulted in the fair value of our equity units being $5.45.
For stock awards after the completion of this offering, our board of directors intends to determine the fair value of each share of underlying common stock based on the closing price of our common stock as reported on the date of grant.
Income Taxes
We account for income taxes under the asset and liability method, which requires the recognition of deferred tax assets and liabilities for the expected future tax consequences of events that have been
92
Table of Contents
included in the financial statements. Under this method, deferred tax assets and liabilities are determined based on the differences between the financial statements and tax bases of assets and liabilities and net operating loss and credit carryforwards using enacted tax rates in effect for the year in which the differences are expected to reverse. The effect of a change in tax rates on deferred tax assets and liabilities is recognized in the period that includes the enactment date. We do not permanently reinvest any earnings in our foreign subsidiaries and recognize all deferred tax liabilities that arise from outside basis differences in our investments in subsidiaries.
We record net deferred tax assets to the extent we believe that these assets will more likely than not be realized. These deferred tax assets are subject to periodic assessments as to recoverability, and if it is determined that it is more likely than not that the benefits will not be realized, valuation allowances are recorded which would reduce deferred tax assets. In making such determination, we consider all available positive and negative evidence, including future reversals of existing taxable temporary differences, projected future taxable income, tax planning strategies and recent financial operations.
We account for uncertain tax positions based on those positions taken or expected to be taken in a tax return. We determine if the amount of available support indicates that it is more likely than not that the tax position will be sustained on audit, including resolution of any related appeals or litigation processes. We then measure the tax benefit as the largest amount that is more than 50% likely to be realized upon settlement. We adjust reserves for our uncertain tax positions due to changing facts and circumstances. To the extent that the final outcome of these matters is different than the amounts recorded, such differences will impact our tax provision in our consolidated statements of operations in the period in which such determination is made. Interest and penalties related to uncertain income tax positions are included in the income tax provision.
Goodwill
Goodwill represents the excess of acquisition cost over the fair value of net tangible and identified net assets acquired. Goodwill and intangible assets that have indefinite lives are not amortized, but rather tested for impairment annually, as of January 1, or more often if and when events or circumstances indicate that the carrying value may not be recoverable. In fiscal year 2019, we have elected to early adopt ASU 2017-04, Simplifying the Test for Goodwill Impairment for our annual goodwill impairment test. ASU 2017-04 removes Step 2 of the goodwill impairment test requiring a hypothetical purchase price allocation. Goodwill impairment, if any, is determined by comparing the reporting units fair value to its carrying value. An impairment loss is recognized in an amount equal to the excess of the reporting units carrying value over its fair value, up to the amount of goodwill allocated to the reporting unit. There were no impairments of goodwill during the years ended March 31, 2017, 2018, and 2019.
For the purpose of testing goodwill for impairment, all goodwill acquired in a business combination is assigned to one or more reporting units. A reporting unit represents an operating segment or a component within an operating segment for which discrete financial information is available and is regularly reviewed by segment management for performance assessment and resource allocation. Components of similar economic characteristics are aggregated into one reporting unit for the purpose of goodwill impairment assessment. Reporting units are identified annually and re-assessed periodically for recent acquisitions or any changes in segment reporting structure. We have determined that we operate as one reporting unit.
The fair value of a reporting unit is generally determined using a combination of the income approach and the market approach. For the income approach, fair value is determined based on the present value of estimated future after-tax cash flows, discounted at an appropriate risk-adjusted rate. We use our internal forecasts to estimate future after-tax cash flows and estimate the long-term growth
93
Table of Contents
rates based on our most recent views of the long-term outlook for each reporting unit. Actual results may differ from those assumed in our forecasts. We derive our discount rates using a capital asset pricing model and analyzing published rates for industries relevant to our reporting units to estimate the weighted average cost of capital. We adjust the discount rates for the risks and uncertainty inherent in the respective businesses and in our internally developed forecasts. For the market approach, we use a valuation technique in which values are derived based on valuation multiples of comparable publicly traded companies. We assess each valuation methodology based upon the relevance and availability of the data at the time we perform the valuation and weight the methodologies appropriately.
Impairment of Long-Lived Assets
Long-lived assets, including amortized intangibles, are reviewed for impairment whenever events or changes in circumstances indicate that the carrying amount of an asset may not be recoverable. If circumstances require a long-lived asset be tested for possible impairment, we first compare undiscounted cash flows expected to be generated by an asset to the carrying value of the asset. If the carrying value of the long-lived asset is not recoverable on an undiscounted cash flow basis, impairment is recognized to the extent that the carrying value exceeds its fair value. We estimate fair value using discounted cash flows and other market-related valuation models, including earnings multiples and comparable asset market values. If circumstances change or events occur to indicate that our fair market value has fallen below book value, then we will compare the estimated fair value of long-lived assets (including goodwill) to its book value. If the book value exceeds the estimated fair value, we will recognize the difference as an impairment loss in our consolidated statements of operations. We did not incur any impairment losses during the years ended March 31, 2017, 2018 and 2019.
Recent Accounting Pronouncements
See Note 2, Summary of Significant Accounting Policies of our audited consolidated statements included in this prospectus for a description of recently issued accounting pronouncements.
JOBS Act Accounting Election
We are an emerging growth company, as defined in the JOBS Act. Under the JOBS Act, emerging growth companies can delay adopting new or revised accounting standards issued subsequent to the enactment of the JOBS Act until such time as those standards apply to private companies. We have elected to take advantage of all of the reduced reporting requirements and exemptions, including the longer phase-in periods for the adoption of new or revised financial accounting standards, until we are no longer an emerging growth company. Our election to use the phase-in periods permitted by this election may make it difficult to compare our financial statements to those of non-emerging growth companies and other emerging growth companies that have opted out of the longer phase-in periods under the JOBS Act and who will comply with new or revised financial accounting standards. If we were to subsequently elect to instead comply with these public company effective dates, such election would be irrevocable pursuant to the JOBS Act.
94
Table of Contents
Overview
We offer the market-leading software intelligence platform, purpose-built for the enterprise cloud. As enterprises embrace the cloud to effect their digital transformation, our all-in-one intelligence platform is designed to address the growing complexity faced by technology and digital business teams. Our platform utilizes artificial intelligence at its core and advanced automation to provide answers, not just data, about the performance of applications, the underlying hybrid cloud infrastructure, and the experience of our customers users. We designed our software intelligence platform to allow our customers to modernize and automate IT operations, develop and release high quality software faster, and improve user experiences for better business outcomes. As a result, as of March 31, 2019, our products are trusted by more than 2,300 customers in over 70 countries.
Todays leading companies are striving to deliver innovative, high performance digital services that expand market opportunities, to compete more effectively, and to operate with increased agility. Software is increasingly central to how enterprises seek to accomplish these goals. Applications sit at the core of this software revolution and are central to the digital transformation of these enterprisesfrom the mission critical enterprise applications that power factories, enable trading, manage transportation networks, and run business systems to the applications that consumers use every day to bank, shop, entertain, travel, and more.
Developing and operating software is harder than ever, largely driven by:
| 1) | Cloud Transformation: Enterprises are building and deploying software across multiple public and on-premise platforms, creating significant visibility challenges across all of an enterprises hosted environments. |
| 2) | Application Complexity: Applications are increasingly complex and deployed as microservices-based architectures that are written in multiple different programming languages with hundreds of loosely coupled service connections. The scale of this complexity is heightened by the advent of the Internet of Things, which increases the number of potential sources of application failure. |
| 3) | DevOps: Ensuring that software updates work without issues has grown more challenging due to the increased frequency of software releases, reduced testing time, and the use of independent development teams. |
| 4) | User Experience: User expectations for software performance have rapidly increased and enterprises are focused on advancing branded experiences to maximize revenue, differentiate offerings, and retain competitive positions. |
Traditional approaches for developing, operating, and monitoring software were not designed for the enterprise cloud environment. Traditional monitoring solutions were developed in an era in which applications were monolithic, updated infrequently, and run in static data center environments. These monitoring solutions, including application performance monitoring, or APM, infrastructure monitoring, incident and alert management, and user experience monitoring, are difficult to deploy, narrow in scope, and were designed to operate in a simpler, siloed environment. Each tool in this approach only collects data about individual components of the computing stack, such as applications, infrastructures, logs, networks, or user experiences. In order to get an end-to-end view using these traditional approaches, IT teams are required to aggregate and correlate data from these disparate monitoring solutions in an attempt to identify actionable answers, including where bottlenecks occur, how best to optimize for performance and scalability, if an issue is impacting service, and if so, where to find the problem and what to do about it.
95
Table of Contents
With the advent of the enterprise cloud, the challenges and limitations of traditional solutions have been exacerbated. What was once a well understood layering of applications running on operating systems on physical servers connected to physical networks has rapidly become virtualized into software at all levels. Environments have become dynamic. Applications are no longer monolithic and are fragmented into dozens to potentially thousands of microservices, written in multiple software languages. These enterprise cloud environments sprawl from traditional backend applications run on relational databases and mainframes to modern IaaS platforms run on Amazon Web Services, or AWS, Microsoft Azure, or Azure, and Google Cloud Platform. All these factors result in an environment that is web-scale, extremely complex, and dynamic at all layers of the new computing stack.
We believe the scale, complexity, and dynamic nature of this emerging enterprise cloud environment, including the applications that run on it, require a comprehensive monitoring strategy that we refer to as software intelligence. Starting in 2014, we leveraged the knowledge and experience of the same engineering team that founded Dynatrace to develop a solution to address the disruptive shift to the enterprise cloud. These efforts resulted in the creation of a new platform, the Dynatrace Software Intelligence Platform, or Dynatrace®. Dynatrace® leverages an automatic instrumentation technology that we call OneAgent®, a real-time dependency mapping system we call SmartScape®, our transaction-centric code analysis technology that we call PurePath®, and an open artificial intelligence, or AI, engine that we call Davis for instant answers to degradations in service, anomalies in behavior, and user impact. Dynatrace® simplifies the complexity of the enterprise cloud for cloud architects, application teams and operations teams, while providing actionable insights that accelerate cloud migrations, cloud adoption, and DevOps success.
Unlike traditional multi-tool approaches, Dynatrace® has been integrated with key components of the enterprise cloud ecosystem to support dynamic cloud orchestration, including for AWS, Azure, Google Cloud Platform, Pivotal Cloud Foundry, Red Hat OpenShift, and Kubernetes. In these environments, Dynatrace® automatically launches and monitors the full cloud stack and all the applications and containers running anywhere in the stack, including applications and workloads that may traverse multiple cloud and hybrid environments. We believe that our ability to integrate Dynatrace® with cloud platforms simplifies development and operational efforts, increases visibility, and improves situational awareness for our customers.
We designed Dynatrace® to maximize flexibility and control of the rich monitoring data captured and analyzed by our platform. We believe that it provides the simplicity of software-as-a-service, or SaaS, with the customer option of either maintaining data in the cloud, or at the edge in customer-provisioned infrastructure, which we refer to as Dynatrace® Managed. In this managed offering, we provide updates and enhancements automatically on a monthly basis while allowing customers the flexibility and control to adhere to their own data security and sovereignty requirements.
We market Dynatrace® through a combination of our global direct sales team and a network of partners, including resellers, system integrators, and managed service providers. We target the largest 15,000 global enterprise accounts, which generally have annual revenues in excess of $750 million.
The Dynatrace® Software Intelligence Platform has been commercially available since 2016 and has become our primary offering. The number of Dynatrace® customers increased to 1,364 as of March 31, 2019 from 574 as of March 31, 2018, representing year-over-year growth of 138%. As of March 31, 2019, approximately 53% of our Dynatrace® customers added to the platform since April 1, 2017 were new customers, and the remaining 47% were existing customers that either added or converted to Dynatrace® since we launched Dynatrace®. Our Dynatrace® dollar-based net expansion rate was 140% as of March 31, 2019. See the section titled Managements Discussion and Analysis of Financial Condition and Results of OperationsKey Metrics.
96
Table of Contents
Our subscription revenue for the years ended March 31, 2017, 2018, and 2019 was $232.8 million, $257.6 million, and $349.8 million, respectively, representing 57%, 65%, and 81%, respectively, of total revenue and year-over-year growth of 11% and 36%. Our total revenue for the years ended March 31, 2017, 2018, and 2019 was $406.4 million, $398.0 million, and $431.0 million, respectively, representing a year-over-year decline of 2% and a year-over-year increase of 8%.
We had net income (loss) of $0.8 million, $9.2 million, and $(116.2) million for the years ended March 31, 2017, 2018, and 2019, respectively. Our adjusted EBITDA for the years ended March 31, 2017, 2018, and 2019 was $108.3 million, $92.8 million, and $92.9 million, respectively, representing 26.6%, 23.3%, and 21.5%, respectively, of total revenue. See section titled Non-GAAP Financial Measures for information regarding our use of adjusted EBITDA and the reconciliation of this measure to net income determined in accordance with generally accepted accounting principles in the United States, or GAAP.
Industry Background
Key trends impacting the way enterprises develop, manage, and optimize their software environment include:
Software Applications Have Become Central to Digital Transformation for Businesses Across All Sectors
Whether it is retailers driving higher customer engagement through mobile apps, industrial companies reducing production downtime with predictive maintenance applications, or automobile manufacturers designing self-driving cars, software has become central to how enterprises deliver a differentiated user experience. At the same time, software is increasingly being embedded throughout the enterprise, managing business critical systems, such as payments processing, inventory and supply chain management, logistics, and many other front- and back-office operations.
A study by International Data Corporation, or IDC, suggests that by 2022 spending on digital transformation technology globally will reach $1.97 trillion, representing a compound annual growth rate of 16.7% over a five-year period. Digital transformation requires significant modernization of legacy environments, shifting from high cost, labor intensive, and inflexible technology systems to a modern cloud-native architecture. Maintaining visibility across a broad hybrid cloud environment represents a significant challenge, which we believe is a primary reason why digital transformations are slow, often disrupted by performance issues, and can fail to achieve intended objectives.
Enterprises now focus more of their budget on software innovation and less on operating and maintaining systems in order to remain competitive. As a result, enterprises are investing in new platforms that are built to automate the development, deployment, and operation of modern software applications and accelerate the transition to the enterprise cloud.
Changing Customer Expectations are Requiring Enterprises to Prioritize the User Experience
Enterprises are increasingly seeking to differentiate their products and services based on user experiences, with digital interaction becoming the primary channel of communication between enterprises and their customers, partners, and employees. According to a Forrester report, customers who have a better experience are more likely to stay with a brand, buy additional products and services from the brand, and recommend it to friends. The result is more retained revenue from reduced customer churn, more revenue per customer, and more new customers. Conversely, according to a
97
Table of Contents
study by NewVoiceMedia, U.S. companies lose $75 billion per year due to poor customer experiences, a $13 billion increase from 2016. Faced with poor customer service, 39% of respondents indicated that they would never use the offending company again.
User experience is closely tied to the performance of software applications. As a result, optimal application performance and exceptional user experiences are important to the entire enterprise, not just to the IT staff that maintain these applications. We believe that the need for an exceptional user experience to engage and retain customers will continue to drive demand for instrumentation that helps enterprises to provide high quality, user-focused outcomes.
Benefits of the Enterprise Cloud Make it Essential for Digital Transformation
Enterprises are increasingly adopting cloud technologies to increase agility and accelerate innovation. According to IDC, by 2020, over 90% of enterprises will use multiple cloud services and platformsa transition supported by investments to manage resources across platforms. According to 451 Research, the share of enterprises deploying the majority of their workloads in cloud infrastructure environments will increase from 54% in 2018 to 79% by 2020. The key advantages of an enterprise cloud include:
| | Ability to build better applications at a faster rate. Cloud-based application development technologies such as container and microservices architectures, enable enterprises to focus developer resources more on creating and improving value-add application features and less on managing underlying operating systems and infrastructure. Gartner states that by 2022, more than 75% of global organizations will be running containerized applications in production, which is a significant increase from fewer than 30% today. In addition to new cloud-based development technologies, enterprises are adopting new processes such as DevOps and Artificial Intelligence for IT Operations, or AIOps, that help accelerate the software delivery cycle. |
| | Operational efficiency. Enterprises are moving to the cloud to be more agile and to reduce spending on expensive and static systems, as well as the IT staff needed to maintain them. Furthermore, cloud services can be purchased dynamically as demand ebbs and flows over time, affording greater flexibility, financial efficiencies, and scale than traditional systems. |
Shift to Enterprise Cloud Introduces Fundamentally New Software Delivery Challenges
While the cloud offers enterprises some clear advantages over traditional systems, moving to the cloud also creates fundamental new challenges, such as:
| | Greater complexity. Hybrid cloud strategies require that IT teams manage applications and ensure interoperability of operations between private and multiple public clouds, such as AWS, Azure, Google Cloud Platform, or SAP. In addition, these applications are containerized and increasingly fragmented into microservices that are hosted across multiple cloud platforms, creating interdependencies across heterogeneous environments that increase the risk of incompatibility issues and the number of potential failure points if the applications are not deployed and maintained correctly. |
| | Highly dynamic environments. Cloud infrastructure and applications are built to scale up or down in real-time depending upon usage and traffic. The automation required to monitor these highly dynamic environments is beyond what is required for monolithic, on-premise applications. |
| | Massive scale. As software becomes more critical to business success, the number and size of applications will continue to grow and encompass more features and greater functionality. At the same time, web-scale architectures are enabling enterprises to build |
98
Table of Contents
| applications that are deployed across thousands of hosts and serve millions of users simultaneously. The breadth of functionality and scale of deployments of enterprise cloud applications regularly exceed even the largest applications built in the pre-cloud era. |
| | More frequent changes to software. The adoption of DevOps practices and cloud architectures have increased the speed at which software updates can be developed and deployed. With the application development lifecycle accelerating, enterprises must adapt their software operations environment and culture to ensure that performance and business outcomes are not adversely affected by frequent changes. |
Traditional Monitoring Approaches Were Not Built for the Modern Enterprise Cloud
Traditional application monitoring approaches were built before the enterprise cloud was the driving force in digital transformation, and suffer from significant shortcomings when applied in cloud-based environments. Challenges of traditional monitoring solutions for the enterprise cloud include:
| | Manual configuration processes that do not scale. Traditional monitoring tools require unique agents for each component of an application and rely on IT personnel to manually pre-configure each agent. The complexity and dynamic nature of enterprise cloud applications, which can include thousands of containers and microservices, makes this multi-agent approach costly, slow, and impractical to install and maintain, especially as these applications are rapidly modified and updated. |
| | Not designed to capture data across the full application stack. Traditional APM solutions were created to view a limited portion of the full software stack and provide visibility only into individual applications, without providing visibility into how the applications are interconnected. In order to get a complete view of all applications, from the underlying infrastructure to the user experience, IT personnel are required to manually implement and manage many disparate tools. We believe this approach has resulted in enterprises overinvesting in operations and underinvesting in development, which slows innovation. |
| | Only able to provide data, not answers. Traditional monitoring tools provide data only about narrow components of the technology stack. As a result, IT teams must manually integrate and correlate the data from disparate systems and apply their own assumptions to identify the underlying cause of performance issues. This process is slow, prone to errors, and is made especially challenging by the complexity of enterprise cloud applications. |
| | Collect limited snapshots of data that do not provide real-time visibility. Traditional APM tools were not designed for the far larger and more complex data sets produced by enterprise cloud applications and can only capture snapshots of application performance or user data. This approach requires these tools to rely on partial data sets, reducing their effectiveness in performing precise root-cause determination, adding risk, and delaying innovation. In addition, traditional monitoring tools do not provide visibility into containers and microservices, which leads to blind spots in software performance monitoring when used in closed-based environments. |
| | Lack of flexible deployment options. Traditional monitoring solutions are either deployed as SaaS-only or on-premise-only. SaaS-only solutions often fail to meet the strict governance, security, and scale requirements of large enterprises, and were not built to monitor on-premise applications, making them incompatible with the needs of customers who manage hybrid-hosted applications. Conversely, traditional on-premise solutions were not built to manage cloud applications and are typically upgraded less frequently and thus innovate more slowly than cloud-based applications. |
99
Table of Contents
Our Solution
We offer the market-leading software intelligence platform, purpose-built for the enterprise cloud. We built our Dynatrace Software Intelligence Platform from the ground up to meet the challenges of running an enterprise cloud. Our AI-powered, full-stack, and completely automated platform provides deep insight into dynamic, web-scale, hybrid cloud ecosystems. Dynatrace® is able to provide real-time actionable insights about the performance of our customers entire software ecosystem by integrating high fidelity, web-scale data mapping its dependencies in real-time, and analyzing them with an open, deterministic AI engine. Dynatrace® is brought to market through our global direct sales force and a network of partners. The combination of our market-leading platform and go-to-market strategy has allowed us to achieve the scale, growth, and margins that we believe will provide us the capital to continue investing in driving further product differentiation.
Our platform provides the following key benefits:
| | Single agent, fully automated configuration. Dynatrace® is installed as a single agent, which we refer to as OneAgent®, that automatically configures itself, discovering all components of the full-stack to enable high fidelity and web-scale data capture. OneAgent® dynamically profiles the performance of all components of the full-stack with code-level precision, even as applications and environments change. |
| | Full-stack, all-in-one approach with deep cloud integrations. Dynatrace® combines APM with Cloud Infrastructure Monitoring, AIOps, and Digital Experience Management, or DEM, in a single full-stack approach. We believe that this all-in-one approach reduces the need for a variety of disparate tools and enables our customers to improve productivity and decision making while reducing operating costs. Dynatrace® provides out-of-the-box configuration for the leading cloud platforms, such as AWS, Azure, Google Cloud Platform, Red Hat OpenShift, Pivotal Cloud Foundry, and SAP Cloud Platform, as well as coverage for traditional on-premise mainframe and monolithic applications in a single, easy-to-use, intelligent platform. |
| | AI-powered, answer-centric insights. DavisTM, our deterministic AI engine, dynamically baselines the performance of all components in the full-stack, continually learning normal performance thresholds in order to provide precise answers when performance deviates from expected or desired conditions. Unlike correlation engines that overwhelm IT professionals with dozens of alerts from many different tools, Dynatrace® provides a single problem resolution and precise root cause determination. We believe that the accuracy and precision of the answers delivered by our AI engine enable our customers to program automated remediation actions, taking a significant step towards our vision of autonomous cloud operations and accelerating the DevOps transformation. |
| | Web-scale and enterprise grade. Dynatrace® utilizes big data architecture and enterprise-proven cloud technologies that are engineered for web-scale environments. With role-based access and advanced security functionality, Dynatrace® was purpose-built for enterprise wide adoption. |
| | Flexible deployment options. We deploy our platform as a SaaS solution, with the option of retaining the data in the cloud, or at the edge in customer-provisioned infrastructure, which we refer to as Dynatrace® Managed. The Dynatrace® Managed offering allows customers to maintain control of the environment where their data resides, whether in the cloud or on-premise, combining the simplicity of SaaS with the ability to adhere to their own data security and sovereignty requirements. Our Mission Control center automatically upgrades all Dynatrace® instances and offers on-premise cluster customers auto-deployment options that suit their specific enterprise management processes. |
100
Table of Contents
Our Opportunity
We believe that our full-stack, all-in-one, software intelligence platform, Dynatrace®, has the ability to expand our potential market opportunity by allowing us to offer our solutions into adjacent markets beyond APM, replacing traditional monitoring tools, and potentially disrupting various well-established IT spending categories, such as infrastructure monitoring, alert and incident management, and network monitoring, as enterprise cloud computing replaces traditional data centers. According to Gartner, the global IT operations software market in 2019 is estimated to be $29 billion and is expected to grow at a compound annual growth rate of 6.7% to $37.5 billion in 2023.
We believe a significant portion of our market opportunity remains unpenetrated today. According to Gartner, enterprises will quadruple their APM use due to increasingly digitized business processes from 2018 through 2021, to reach 20% of all business applications. As this trend continues, we believe there is an opportunity to increase our annual recurring revenue as enterprise customers expand the number of applications instrumented.
We estimate that the annual potential market opportunity for our Dynatrace® solution is currently approximately $18 billion. We calculated this figure using the largest 15,000 global enterprises with greater than $750 million in annual revenue, as identified by S&P Capital IQ in February 2019. We then banded these companies by revenue scale, and multiplied the total number of companies in each band by our calculated annualized booking per customer for companies in each respective band. The calculated annualized bookings per customer applied for each band is calculated using internal company data of actual customer spend. For each respective band, we calculate the average annualized bookings per customer of the top 10% of customers in the band, which we believe to be representative of having achieved broader implementation of our solutions within their enterprises. We believe our potential market opportunity could expand further as enterprises increasingly instrument, monitor, and optimize more of their applications and underlying infrastructure.
Our Growth Strategy
| | Extend our technology and market leadership position. We intend to maintain our position as the market-leading software intelligence platform through increased investment in research and development and continued innovation. We expect to focus on expanding the functionality of Dynatrace® and investing in capabilities that address new market opportunities. We believe this strategy will enable new growth opportunities and allow us to continue to deliver differentiated high-value outcomes to our customers. |
| | Grow our customer base. We intend to drive new customer growth by expanding our direct sales force focused on the largest 15,000 global enterprise accounts, which generally have annual revenues in excess of $750 million. Approximately 53% of our Dynatrace® customers as of March 31, 2019, are new customers added since we launched Dynatrace® in 2016 and the initial average Dynatrace® ARR for these new customers was approximately $100,000. In addition, we expect to leverage our global partner ecosystem to add new customers in geographies where we have direct coverage and work jointly with our partners. In other geographies, we utilize a multi-tier master reseller model, such as in Africa, Japan, the Middle East, Russia, and South Korea. |
| | Increase penetration within existing customers. We plan to continue to increase the penetration within our existing customers by expanding the breadth of our platform capabilities to provide for continued cross-selling opportunities. In addition, we believe the ease of implementation for Dynatrace® provides us the opportunity to expand adoption within our existing enterprise customers, across new customer applications, and into additional business units or divisions. Once customers are on the Dynatrace® platform, we have seen significant dollar-based net expansion due to the ease of use and power of our new platform. |
101
Table of Contents
| | Enhance our strategic partner ecosystem. Our strategic partners include industry-leading system integrators, software vendors, and cloud and technology providers. We intend to continue to invest in our partner ecosystem, with a particular emphasis on expanding our strategic alliances and cloud-focused partnerships, such as AWS, Azure, Google Cloud Platform, Red Hat OpenShift, and Pivotal Cloud Foundry. |
The Dynatrace Software Intelligence Platform
Dynatrace® is a software intelligence platform purpose-built for the enterprise cloud. Dynatrace® provides APM, infrastructure monitoring, AIOps, and DEM, in an easy-to-use, highly automated all-in-one solution. We engineered Dynatrace® to simplify the operation of complex hybrid cloud environments and capture a wide variety of high-fidelity application and telemetry data at scale, then dynamically map all components and their dependencies for real-time, continuous context to provide answers to issues, bottlenecks, degradations and more using our proprietary AI engine. We believe this enhanced visibility and automation across the full enterprise cloud ecosystem enables our customers to modernize and automate IT operations more easily, develop and release higher quality software faster, and deliver superior user experiences consistently.
Our proprietary, single-agent technology, OneAgent® simplifies getting started with Dynatrace®. Upon installation, OneAgent® autonomously and instantly discovers all of the components and dependencies running on and across hosts in the enterprise cloud environment. We believe that OneAgent® offers significant time savings to our customers by providing them with the ability to automate deployment, configuration, and upgrades, which allows customers to quickly and efficiently monitor more applications.
Our SmartScape® technology dynamically maps a complete topology of the full-stack of modern software components and continuously updates in real-time to provide a comprehensive view of what applications are running, where they are running, how they are connected, and how they are performing.
With automatic baselining, our Davis AI continually learns what normal performance is, processing billions of dependencies in milliseconds, to serve up answers that are beyond human capabilities. This allows our proprietary, deterministic Davis AI engine to provide precise root cause problem identification, enabling faster decision making, greater optimization of IT resources, and better business outcomes.
We engineered Dynatrace® for web-scale, hybrid cloud environments with enterprise-grade governance and security and the ability to provide custom and secure role-based application and topology viewing access. We designed Dynatrace® to be highly scalable in order to capture and analyze big data sets produced by enterprise cloud environments in real-time. We believe that collecting high-fidelity data in one common architecture improves the intelligence of our AI engine and provides more precise answers about software performance and user activity across the full-stack. Using an application program interface, or API, we can extend Dynatrace® into common IT operations toolsets like ServiceNow and Atlassians software portfolio, enriching information users receive, increasing automation of business processes, and providing incremental context to improve decision making.
102
Table of Contents
Dynatrace Deterministic AI Delivers Answers, Not Just Data
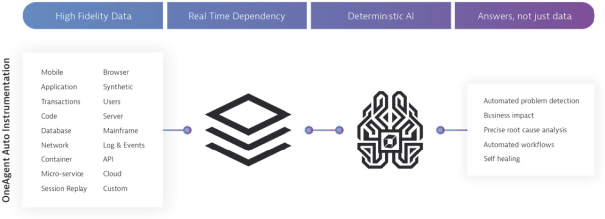
Dynatrace® is a full-stack, all-in-one platform, which includes APM, DEM, AIOps, and Cloud Infrastructure Management. Customers typically start with APM and expand to include DEM for experience management and Cloud Infrastructure Management when full APM is not required. Davis, our AI engine, is part of every Dynatrace® license since it is a core component of our software intelligence approach.
103
Table of Contents
We deploy our platform as a SaaS solution, with data hosted in the cloud or at the edge on customer-provisioned infrastructure. This latter option we refer to as managed, as we provide updates and enhancements automatically on a monthly basis while allowing customers the flexibility and control to adhere to their own data security and sovereignty requirements.
Dynatrace Software Intelligence for The Enterprise Cloud
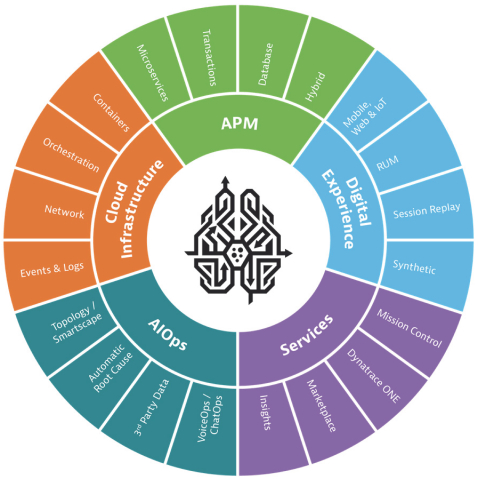
Application Performance Monitoring
Our approach to APM changes the way in which our customers monitor applications and manage transactions across highly complex enterprise cloud environments. Because cloud applications are dynamic, we engineered our instrumentation to be automatic. Because cloud applications run on shared infrastructure, leveraging shared services, we monitor the full-stack to provide visibility into both transactions (via PurePath®) and dependencies (via SmartScape®). Because the enterprise cloud is often hybrid, we gather metrics and telemetry beyond transaction data, including log and event data. And because the enterprise cloud is highly complex, we analyze all data and dependency context via our AI engine. This combination of capabilities allows our customers to manage web-scale cloud environments easily, with continuous visibility and insights into cloud operations, DevOps continuous integration and delivery pipelines, and business outcomes. Application coverage includes, though not limited to, traditional web and mobile environments such as Java, .NET, and PHP, modern environments such as Node.js and GoLang, database environments both SQL and NoSQL and mainframe environments such as Customer Information Control System and Information Management System.
104
Table of Contents
Cloud Infrastructure Monitoring
Dynatrace® includes Cloud Infrastructure Monitoring to provide full visibility into the infrastructure layer across public, private, and hybrid cloud environments. We offer extensive coverage, including integrations with cloud platforms, such as AWS, Azure, Google Cloud Platform, Pivotal, Red Hat OpenShift and Kubernetes, by utilizing our OneAgent instrumentation and powerful API ingestion capabilities to provide a single source of analysis across environments.
We natively and automatically monitor containers and the microservices running inside of them, without the need to manually instrument each container. Our analysis includes full visibility into server metrics, including CPU, memory, network performance, and processes running on these hosts, including virtualized components. We also capture all relevant log files and put them in context of a transaction or a problem analysis to allow for richer detail and faster decision making.
Cloud Infrastructure Monitoring from Dynatrace® is part of our full-stack agent deployment or can be licensed in an infrastructure-only mode for host environments that do not require application analysis.
AIOps
Dynatrace® uses deterministic AI and full-stack intelligence to simplify IT operations, accelerate DevOps success, and improve business outcomes. Dynatrace® AI reduces the alert noise that is often associated with correlation engines used in enterprise environments by providing precise root-cause analysis to enable proactive troubleshooting and rapid remediation. Dynatrace® continuously auto-detects the entire technology stack as well as third-party APIs to create a visual map of all elements of the environment and their dependencies, including applications, services, processes, hosts, networks, and infrastructure. This allows the platform to learn a baseline of normal performance and interdependencies. When anomalies are automatically detected, the AI engine determines the precise root cause of the anomaly and prioritizes its importance based on user and service impact. By using an open API, the Dynatrace® AI engine can ingest and analyze third party data, such as firewall, load balancer, certificate server and more, to extend coverage and tailor to the specific environments of each customer.
We integrate our software intelligence with service management platforms to provide enriched data and improved workflows. This includes integrations with third parties such as ServiceNow and Atlassian, providing real-time updates to more accurately route problem tickets to the most appropriate IT teams and enriching the information available to them.
DavisTM, our AI engine is part of every Dynatrace® license since it is a core component of our software intelligence approach. Customers who wish to enrich our AI engine with 3rd party data can license for incremental data ingestion.
Digital Experience Management
Dynatrace® provides intelligence into the digital experience of end users and how the software can be optimized to enhance user experience and maximize conversions. Our coverage has the ability to span across multiple applications to provide a single view of a customer journey across mobile, web, kiosk, SaaS applications, and IoT devices. Dynatrace® integrates three user experience capabilities into one Digital Experience Management, or DEM, solutionReal User Monitoring, or RUM, Synthetic Monitoring and Session Replay. We believe this integration simplifies set-up, configuration, education and on-going support while accelerating adoption and increasing value for our customers.
Dynatrace® RUM automatically captures every click, tap, and swipe of the user, regardless of device, across targeted applications. This capability is designed to enable our customers to quickly
105
Table of Contents
determine the impact that performance has on their conversion rates and revenue. We monitor at a user journey level to preserve a users context for analysis, reporting, customer care and cross-channel tracking (e.g. a journey that traverses a mobile device and PC, or IoT devices and mobile device).
Dynatrace® Synthetic monitoring provides a proactive view into application and API performance and availability without the need for a live user of the application and can do so from multiple locations around the world. In addition, a customer can choose to extend test locations as well as test additional applications via private on-premise nodes. Simulated user visits are scripted by clicking through an application as a user would, and then provisioned and monitored by our SaaS DEM portal. Our customers use synthetic monitoring for proactive alerting and service level agreement management for both internally built cloud applications as well as for monitoring third-party applications such as Salesforce, NetSuite, ServiceNow, and more.
Dynatrace® Session Replay provides digital business teams, customer care teams and DevOps teams a visual recording of a real users journey, including what they saw, what they clicked-on, how they traversed the application, and how they converted or where they abandoned. This expands Dynatrace®s capabilities beyond user experience monitoring and into user behavior monitoring and analysis.
All Dynatrace® DEM capabilities use a common user interface, common dashboard and reporting system, and a common licensing scheme that we call DEM units. Customers license DEM separately and the license supports all three capabilities.
Our Classic Products
Prior to launching Dynatrace® in 2016, our solutions consisted of the following suite of APM products, or the Classic products, which as of April 2018 are only available to customers who had previously purchased these products. We have largely incorporated the use cases for these products into our new Dynatrace® platform.
AppMon
AppMon continuously discovers and monitors all processing in application environments using our patented PurePath® technology. Unlike competitive alternatives which take only periodic snapshots of application component health, PurePath® continuously provides an end-to-end trace of every transaction in a monitored application enabling root cause determination when issues occur. AppMon works across a wide variety of traditional application environments including mobile apps, web apps, web browsers, web servers, Java, .NET, Node.js, PHP, databases, middleware, and mainframe. Typically, AppMon is deployed on-premise using customer-provisioned infrastructure.
Classic Real User Monitoring
Classic RUM (also called End User Experience Monitoring) tracks each users experience from an edge device, such as a smart phone, tablet, PC or kiosk, through cloud services to and including a customers web tier. Classic RUM can monitor every click, tap, or swipe that a user makes and the application services these call, providing insight into how an application can or should be improved to enhance user experience and maximize conversions. Combined with AppMon, and leveraging PurePath® technology, Classic RUM customers is designed to enable customers to understand the impact that performance has on their revenue, with business transactions mapped to response times, errors, and abandonment, providing the link between IT operations and business outcomes. Like AppMon, Classic RUM is typically deployed using customer-provisioned infrastructure.
106
Table of Contents
Synthetic Classic
Synthetic Classic provides a simulated customer experience and is used to monitor application and API availability and performance. Synthetic Classic proactively simulates user visits without the need for a live user of the application, providing global visibility into web applications by driving real web browser sessions. Simulated user visits are easily built and maintained via a simple point-and-click scripting environment, and performance dashboards, reports and alerting rules can be easily configured via our SaaS portal. Synthetic Classic is a SaaS-based application provisioned by Dynatrace®.
Network Application Monitoring
Network Application Monitoring, or NAM (also called DC RUM), provides visibility into traditional enterprise applications, network services, user experience, and application delivery across complex wide-area networks using a passive wire-data approach. NAM extends visibility into applications and key network infrastructure, such as SAP, Citrix, Oracle Applications, and more, complementing host-based monitoring. NAM is deployed using customer-provisioned infrastructure.
Research and Development
Our research and development organization is responsible for the design, development, testing, and operation of all aspects of our software intelligence offerings, addressing new use cases, adding new innovative capabilities, extending the scale and scope of our technology, and embracing modern cloud and AI technologies while maintaining high quality.
We utilize an agile development process with 100% test automation to deliver approximately 25 major software releases per year and hundreds of minor releases, fixes and currency updates. We believe monitoring the full-stack of software required by modern enterprise clouds requires a highly efficient and agile process to enable high-performing software across the diverse, dynamic cloud ecosystems of our customers.
Our primary lab locations are located in Linz, Austria; Gdansk, Poland; and Barcelona, Spain, and we also extend to additional cities in Austria and North America. We believe that our worldwide engineering and extensive European lab network is an advantage in driving lower costs, higher quality software and more stable workforce.
Our research and development expenses were $52.9 million, $58.3 million, and $76.8 million for the years ended March 31, 2017, 2018, and 2019, respectively.
Customers
As of March 31, 2019, we had more than 2,300 customers in over 70 countries. No organization or customer accounted for more than 10% of our revenue for the years ended March 31, 2018 and 2019.
Sales and Marketing
We take Dynatrace® to market through a combination of our global direct sales team and a network of partners, including resellers, system integrators and managed service providers. We target
107
Table of Contents
the largest 15,000 global enterprise accounts, which generally have annual revenues in excess of $750 million, which we believe see more value from our integrated full-stack platform
Our sales and marketing organizations seek to promote the Dynatrace brand, our platform capabilities, and develop partnerships to drive revenue growth. We utilize a variety of go-to market strategies, including search engine optimization, online advertising, free software trials, events, online webinars, and broad content marketing strategies. We nurture our existing customer base through ongoing education, training, and upsell and cross-sell opportunities. We do this primarily through our digital online channels, such as the Dynatrace Community and Dynatrace University, as well as our customer event series Perform which caters to more than 7,500 people across 30 events globally.
Our sales and marketing expenses were $130.0 million, $145.4 million, and $178.9 million for the years ended March 31, 2017, 2018, and 2019, respectively.
Partners
We develop and maintain partnerships that help us market and deliver our products to our customers around the world. Our mission is to bring together industry experts and hands-on practitioners to create a world class partner network. In addition, our partner network extends the sales reach of the Dynatrace® platform providing new sales opportunities, renewals of existing subscriptions, as well as upsell and cross sell opportunities. Our partner network includes the following:
| | Cloud providers. We work with many of the major cloud providers to increase awareness of our products and make it easy for customers to access our software. Our software is developed to run in and integrate with leading cloud providers, such as, AWS, Azure, and Google Cloud Platform. Our customers are also able to procure our software through leading marketplaces such as AWS, Azure, SAP, and IBM. |
| | Resellers. Our resellers market and sell our products throughout the world, and provide a go-to-market channel in regions where we do not have a direct presence, such as Africa, Japan, the Middle East, Russia, and South Korea. |
| | Technology alliance partners. We partner with leading innovative technology organizations such as Red Hat, Pivotal, VMWare, and Atlassian to develop integrations, best practices, and extended capabilities that help our customers and solution partners achieve faster time to market and enhanced value in modern enterprise cloud environments. |
| | System integrators. We have a network of systems integrators, both global and regional, that help joint customers integrate our products into their enterprise cloud ecosystems. These partners extend our scale and reach and collaborate with our direct sales teams, bringing domain expertise in technologies and industries along with additional offerings powered by Dynatrace®. |
Professional Services
Our global team of highly skilled consultants, architects and certified partners deliver strategic guidance and leadership designed to drive innovation for our customers. Whether working directly onsite or remotely by virtual engagement, Dynatrace offers and delivers a modernized portfolio of consulting and architectural services designed for every stage of our customers cloud transformation journey. Our expertise includes cloud ecosystem integration, incident and alert management integration, DevOps CI/CD integration, user experience and business intelligence insights and more.
Dynatrace University is our global on-line, self-service education program that provides a number of learning options for customers and partners to develop their skills around monitoring, managing,
108
Table of Contents
integrating, and analyzing their enterprise cloud environment and application workloads with Dynatrace.
Support and SaaS Operations
Dynatrace ONE is our innovative onboarding and support service focused on simplifying and streamlining the experience our customers have with the company and our products. This service is delivered by a global team of product specialists, customer success managers, and support engineers. Dynatrace ONE uses in-product chat as the primary vehicle for customer interaction to drive adoption and growth, as well as to handle issues and user questions. We maintain a SaaS-like connection to tenants and clusters, both in the cloud and managed on customer provisioned infrastructure, via our Mission Control system, which allows us to streamline communication and accelerate resolution of issues. Dynatrace ONE is offered to all Dynatrace customers free of charge and includes automatic product updates and upgrades, online access to documentation, knowledge base, and discussion forums as well as access to Dynatrace University. Dynatrace ONE is comprised of technical personnel distributed across three territories and provides global coverage during normal business hours, and across multiple languages.
Dynatrace ONE Premium is an extra level of support services for customers who want to accelerate their adoption of our platform, increase their access to support, and extend their hours of expert coverage. Dynatrace ONE Premium offers dedicated expertise for customers with designated Product Specialists and Customer Success Managers familiar with the customers environment, goals, and challenges in order to provide a customized success plan.
We proactively monitor our customers Dynatrace® installations around the world, whether tenants are shared in the cloud or managed on customer-provisioned infrastructure. We operate our SaaS offerings in geographic locations across North America, Europe and Asia within AWS, combined with worldwide coverage of synthetic nodes in approximately 50 different datacenters including AWS, Microsoft Azure, and Alibaba Cloud Services. Our Dynatrace Security Team develops new process and technology controls, while we also employ third party firms for penetration tests, security audits, and security testing.
Intellectual Property
We rely on a combination of patent, copyright, trademark, trade dress, and trade secret laws, as well as confidentiality procedures and contractual restrictions, to establish and protect our proprietary rights. These laws, procedures, and restrictions provide only limited protection. As of March 31, 2019, we had 58 issued patents, all of which are in the United States, and 25 pending applications, of which 17 are in the United States. Our issued patents expire at various dates through July 2037. We cannot be assured that any of our patent applications will result in the issuance of a patent or whether the examination process will require us to narrow the scope of the claims sought. Any future patents issued to us may be challenged, invalidated or circumvented. Any patents that may issue in the future with respect to pending or future patent applications may not provide sufficiently broad protection or may not prove to be enforceable in actions against alleged infringers.
We have registered Dynatrace and the Dynatrace logo as trademarks in the United States and other jurisdictions for our name and our product as well as certain other words and phrases that we use in our business, including PurePath and SmartScape. We have registered numerous Internet domain names related to our business. We also license software from third parties for integration into our applications and utilize open source software.
109
Table of Contents
We enter into agreements with our employees, contractors, customers, partners, and other parties with which we do business to limit access to and disclosure of our proprietary information. We cannot be certain that the steps we have taken will prevent unauthorized use or reverse engineering of our technology. Moreover, others may independently develop technologies that are competitive with ours or that infringe our intellectual property. The enforcement of our intellectual property rights also depends on any legal actions against these infringers being successful, but these actions may not be successful, even when our rights have been infringed.
Furthermore, effective patent, trademark, trade dress, copyright, and trade secret protection may not be available in every country in which our products are available over the Internet. In addition, the legal standards relating to the validity, enforceability and scope of protection of intellectual property rights are uncertain and still evolving.
Competition
The market for software application monitoring and analytics solutions is evolving, complex and defined by changing technology and customer needs. We expect competition to intensify in the future as competitors bundle new and more competitive offerings with their existing products and services, and as products and product enhancements are introduced into our markets. As we have expanded our capabilities beyond traditional APM, we increasingly compete with a wider range of vendors. We expect competition to continually evolve as enterprises shift to the enterprise cloud environment and as more mature vendors look to provide a holistic approach to monitoring.
We compete either directly or indirectly with:
| | APM vendors, such as Cisco AppDynamics, Broadcom, and New Relic; |
| | infrastructure monitoring vendors, such as BMC, Datadog, and Nagios; |
| | DEM vendors, such as Akamai and Catchpoint; |
| | point solutions from public cloud providers; and |
| | IT operations management, AIOps, and business intelligence providers that provide some portion of the capabilities that we provide. |
In addition to the above companies, we also face potential competition from vendors in adjacent markets that may offer capabilities that overlap with ours. We may also face competition from companies entering our market, including large technology companies which could expand their platforms or acquire one of our competitors.
The principal competitive factors in our markets are:
| | artificial intelligence capabilities; |
| | automation; |
| | product features, functionality, and reliability; |
| | ease and cost of deployment, use and maintenance; |
| | deployment options and flexibility; |
| | customer, technology, and platform support; |
| | ability to easily integrate with customers software application and IT infrastructure environments; |
| | the quality of data collection and correlation; |
110
Table of Contents
| | interoperability and ease of integration; and |
| | brand recognition. |
While we believe that we compete favorably on the basis of the foregoing factors, we may be at a competitive disadvantage to certain of our current and future competitors as they may be able to devote greater resources to the development and improvement of their products and services than we can and, as a result, may be able to respond more quickly to technological changes and customers changing needs. Moreover, because our market is changing rapidly, it is possible that new entrants, especially those with substantial resources, more efficient operating models, more rapid product development cycles or lower marketing costs, could introduce new products and services that disrupt the manner in which our all-in-one, highly automated approach addresses the needs of our customers and potential customers.
Employees
As of March 31, 2019, we had 1,910 full-time employees, including 607 in sales and marketing, 618 in research and development, 191 in administrative functions, 229 in services, and 265 in customer support. Among our full-time employees as of March 31, 2019, 770 were in North America, 907 were in EMEA, 172 were in Asia Pacific, and 61 were in Latin America.
Facilities
Our corporate headquarters is located in Waltham, Massachusetts and consists of approximately 40,000 square feet of space under a lease that expires in September 2027. In addition to our headquarters, we lease approximately 35,000 square feet of space in Detroit, Michigan under a lease that expires in January 2021. Our primary research and development facilities are located in Linz, Austria, Gdansk, Poland, and Barcelona, Spain, and consist of approximately 30,000, 35,000, and 12,000 square feet, respectively. We maintain additional offices in the United States and in various international locations, including San Mateo, California, Maidenhead, United Kingdom, and Sydney, Australia. We believe that our facilities are adequate to meet our needs for the immediate future and that we will be able to secure additional space to accommodate expansion of our operations.
Legal
We are not currently a party to any litigation or claims that, if determined adversely to us, would have a material adverse effect on our business, operating results, financial condition, or cash flows. We are, from time to time, party to litigation and subject to claims in the ordinary course of business. Regardless of the outcome, litigation can have an adverse impact on us because of defense and settlement costs, diversion of management resources, and other factors.
111
Table of Contents
Executive Officers and Directors
The following table provides information, as of March 31, 2019, regarding the individuals who will serve as our executive officers and directors immediately following the completion of this offering:
| Name |
Age |
Position |
||
| Executive Officers: |
||||
| John Van Siclen |
62 | Chief Executive Officer and Director | ||
| Kevin Burns |
48 | Chief Financial Officer, Treasurer and Secretary | ||
| Stephen J. Pace |
59 | Senior Vice President, Worldwide Sales | ||
| Bernd Greifeneder |
47 | Senior Vice President, Chief Technology Officer | ||
| Non-Employee Directors: |
||||
| Seth Boro |
43 | Director | ||
| Kenneth Chip Virnig |
35 | Director | ||
| James K. Lines |
62 | Director | ||
| Paul Zuber |
59 | Director | ||
Executive Officers
John Van Siclen has served as our Chief Executive Officer since 2008 and on our board of directors since December 2014. He has over 35 years of experience developing and leading technology companies in a variety of markets including networking, database, content management and broadband. In 2012, Mr. Van Siclen was recognized by CRN magazine as a Top 25 Disrupter, and in 2018 he was recognized by Comparably as one of the top CEOs in America (#17) for companies over 500 employees. Prior to Dynatrace, Mr. Van Siclen was Chief Executive Officer of Adesso Systems, Inc. from July 2006 until December 2007. Mr. Van Siclen also held several executive positions at Interwoven Inc. from January 2000 until June 2003 last serving as its Chief Executive Officer from January 2002 through June 2003. Mr. Van Siclen holds a B.A. in History from Princeton University. Our board of directors believes that based on Mr. Van Siclens knowledge of our company and our business, and his service as our Chief Executive Officer, Mr. Van Siclen is qualified to serve on our board of directors.
Kevin Burns has served as our Chief Financial Officer, Treasurer and Secretary since September 2016. Mr. Burns was also the Treasurer and Secretary of SIGOS LLC, an affiliate of Dynatrace, until July 2018. Prior to his role at Dynatrace, Mr. Burns was the President, Chief Financial Officer and Chief Operating Officer of iCAD Inc. (Nasdaq: ICAD) from April 2011 until September 2016. From April 2008 until May 2010, Mr. Burns was Senior Vice President, Chief Financial Officer of AMICAS, Inc. (Nasdaq: AMCS), and he was the Vice President of Finance and Corporate Development from November 2004 until March 2008. Mr. Burns holds a B.S. from Babson College and an M.B.A. from Babson Colleges Franklin W. Olin Graduate School of Business.
Stephen J. Pace has served as our Senior Vice President, Global Sales since March 2016. Prior to this, Mr. Pace was the Senior Vice President, Global Sales for Raytheon Cyber Products, Inc., a subsidiary of Raytheon Company (NYSE: RTN), from January 2014 until February 2016. Prior to his role at Raytheon, Mr. Pace was Executive Vice President of Global Sales and Advisory Board Member at Rapid Focus Security, Inc. (d/b/a Pwnie Express), from January 2013 until January 2014 and currently he remains an advisor to the company. He has also held various North American and Global Sales and Marketing roles with Seagate Software (acquired by Veritas), GeoTrust (acquired by Verisign), NaviSite (acquired by Time Warner), and IBM. Mr. Pace holds a B.S. in Electrical
112
Table of Contents
Engineering, with honors, from Pennsylvania State University and has been an Advisory Board member since 2008 in the College of Information Science and Technology at Pennsylvania State University.
Bernd Greifeneder has served as our Senior Vice President, Chief Technology Officer since December 2014. Mr. Greifeneder co-founded dynaTrace Software GmbH in 2005, where he was the Chief Executive Officer until 2008, and the Chief Technology Officer until December 2014. Prior to this, Mr. Greifeneder held a variety of roles at Segue Software Inc. from January 1998 to February 2005, including Project Lead, Chief Technology Officer of Global Technologies and Chief Software Architect. Mr. Greifeneder holds a B.S. in Computer Science and an M.S. in Computer Science from Johannes Kepler Universität Linz, Austria.
Non-Employee Directors
Seth Boro has served on our board of directors and a member of its compensation committee since January 2015. Mr. Boro has served as a Managing Partner at Thoma Bravo since 2013. He joined Thoma Bravo in 2005 and became a Partner in 2010, serving in that capacity until becoming a Managing Partner in 2013. Mr. Boro was previously an associate with the private equity firm Summit Partners from July 2000 to May 2003 and an analyst with Credit Suisse from July 1999 to July 2000. Mr. Boro currently serves on the board of directors of SolarWinds Corporation (NYSE: SWI) and previously served on the board of directors of SailPoint Technologies Holdings, Inc. (NYSE: SAIL) until November 2018. He currently serves as a director of several software and technology service companies in which certain private equity funds advised by Thoma Bravo hold an investment, including Compuware and SIGOS, affiliates of Dynatrace, ConnectWise, Inc., Hyland Software, Inc., Empirix, Inc., Imperva, Inc., Riverbed Technology, Inc., DigiCert, Inc., Qlik Technologies, Inc., McAfee, LLC, Kofax, Ltd., Veracode, Inc., Barracuda Networks, Inc. and LogRhythm, Inc. Mr. Boro also previously served on the board of directors of other cyber security companies, including Blue Coat Systems, Inc., Entrust, Inc., SonicWALL, Inc., and Tripwire, Inc. Mr. Boro received his M.B.A. from the Stanford Graduate School of Business and is a graduate of Queens University School of Business (Canada), where he received a Bachelor of Commerce degree. Our board of directors believes that Mr. Boros board and industry experience qualify him to serve on our board of directors.
Kenneth Chip Virnig has served on our board of directors and its audit committee since January 2015. Since September 2018, he has served as Partner at Thoma Bravo, and from July 2015 to September 2018 he served as Principal at Thoma Bravo. Mr. Virnig joined Thoma Bravo in 2008 and served as Vice President prior to his promotion to Principal. Prior to that, Mr. Virnig worked as an analyst in the investment banking group at Merrill Lynch & Co. from July 2006 to July 2008. He previously served on the board of directors of SailPoint Technologies Holdings, Inc. (NYSE: SAIL) until March 2019 and currently serves as a director of several software and technology service companies in which certain private equity funds advised by Thoma Bravo hold an investment, including Compuware and SIGOS, affiliates of Dynatrace, Hyland Software, Inc., Imperva, Inc., Imprivata, Inc., Qlik Technologies, Inc., Kofax, Ltd., LogRhythm, Inc., Barracuda Networks, Inc. and Veracode, Inc. Mr. Virnig received a B.A. in Business Economics, Commerce, Organizations and Entrepreneurship from Brown University. Our board of directors believes that Mr. Virnigs board and industry experience and his overall knowledge of our business qualify him to serve on our board of directors.
James K. Lines has served on our board of directors and as a member of the compensation and audit committees since January 2015. Mr. Lines has been an Operating Partner with Thoma Bravo since 2002, and is now a Senior Operating Partner. Mr. Lines prior experience includes service in various financial management capacities at affiliates of AMR Corporation (a parent company of American Airlines), including as Chief Financial Officer of The SABRE Group; as Senior Vice President and Chief Financial Officer of ITI Marketing Services, a private tele-services firm; and as Executive
113
Table of Contents
Vice President; and Chief Financial Officer of United Surgical Partners, an international operator of surgery centers and hospitals. Mr. Lines currently serves on the board of directors of SolarWinds Corporation (NYSE: SWI) and several other software and technology service companies in which certain private equity funds advised by Thoma Bravo hold an investment, including Compuware and SIGOS, affiliates of Dynatrace, Hyland Software, Inc., Riverbed Technology, Inc., DigiCert, Inc., Qlik Technologies, Inc., Imprivata, Inc. and ABC Financial Services, LLC. Mr. Lines earned his B.S. in Electrical Engineering from Purdue University and an M.B.A. from Columbia University. Our board of directors believes that Mr. Lines management, financial and industry experience and his knowledge of our business qualify him to serve on our board of directors.
Paul Zuber has served on our board of directors since January 2015. Mr. Zuber has been an Operating Partner with Thoma Bravo since 2010. Previously he served as founding Chief Executive Officer of Dilithium Networks Inc. from July 2001 to July 2010 and as Chief Executive Officer of Bluegum Group from 1995 to 2000. Mr. Zuber also served in senior positions at Ready Systems Inc. from 1986 to 1990. Mr. Zuber currently serves on the board of directors of several software and technology service companies in which certain private equity funds advised by Thoma Bravo hold an investment, including Empirix, Inc., MedeAnalytics, Inc., Elemica, Inc., Imprivata, Inc., Continuum Managed Services, LLC, Kofax, Ltd., Frontline Education Technologies, LLC, ABC Financial Services, LLC, Barracuda Networks, Inc., MeridianLink, Inc., SIGOS, an affiliate of Dynatrace, and LogRhythm, Inc. Mr. Zuber has an M.B.A. from the Stanford Graduate School of Business and B.A. degrees in International Relations and Economics from Stanford University. Our board of directors believes that Mr. Zubers board and industry experience and his knowledge of our business qualify him to serve on our board of directors.
Status as a Controlled Company
Because the Thoma Bravo Funds will beneficially own shares of common stock, representing approximately % of the voting power of our issued and outstanding capital stock (or % if the underwriters option to purchase additional shares is exercised in full), following the completion of this offering, we expect to be a controlled company as of the completion of the offering under the Sarbanes-Oxley Act of 2002, or the Sarbanes-Oxley Act, and the rules of the New York Stock Exchange, or NYSE. A controlled company does not need its board of directors to have a majority of independent directors or to form an independent compensation or nominating and corporate governance committee. As a controlled company, we will remain subject to rules of the Sarbanes-Oxley Act and the NYSE, which require us to have an audit committee composed entirely of independent directors. Under these rules, we must have at least one independent director on our audit committee by the date our common stock is listed on the NYSE, at least two independent directors on our audit committee within 90 days of the listing date, and at least three directors, all of whom must be independent, on our audit committee within one year of the listing date. We expect to have independent directors upon the closing of this offering, of whom will qualify as independent for audit committee purposes.
If at any time we cease to be a controlled company, we will take all action necessary to comply with the Sarbanes-Oxley Act and rules of the NYSE, including by having a majority of independent directors on our board of directors and ensuring we have a compensation committee and a nominating and corporate governance committee, each composed entirely of independent directors, subject to any permitted phase-in period.
Code of Business Conduct and Ethics
Prior to the completion of this offering, our board of directors will adopt a code of business conduct and ethics that applies to all of our employees, officers and directors, including our Chief
114
Table of Contents
Executive Officer, Chief Financial Officer and other executive and senior officers. The full text of our code of business conduct and ethics will be posted on the investor relations page on our website. We intend to disclose any amendments to our code of business conduct and ethics, or waivers of its requirements, on our website or in filings under the Securities Exchange Act of 1934, as amended, or the Exchange Act.
Board of Directors
We expect our board of directors will consist of persons immediately prior to the consummation of this offering, of whom will qualify as independent under the listing standards of the .
After the completion of this offering, the number of directors will be fixed by our board of directors, subject to the terms of our charter and bylaws that will become effective immediately prior to the completion of this offering. Each of our current directors will continue to serve as a director until the election and qualification of his successor, or until his earlier death, resignation or removal.
Additionally, our charter that will be in effect following this offering will provide that for so long as Thoma Bravo beneficially owns in the aggregate at least (i) 30% of our outstanding shares of common stock, Thoma Bravo will have the right to designate the chairman of our board of directors and of each committee of our board of directors as well as nominate a majority of our board of directors (provided that, at such time as we cease to be a controlled company under the NYSE corporate governance standards, the majority of our board of directors will be independent directors, as defined under the rules of the NYSE, and provided further, that the membership of each committee of our board of directors will comply with the applicable rules of the NYSE); (ii) 20% (but less than 30%) of our outstanding shares of common stock, Thoma Bravo will have the right to nominate a number of directors to our board of directors equal to the lowest whole number that is greater than 20% of the total number of directors (but in no event fewer than two directors); (iii) 10% (but less than 20%) of our outstanding shares of common stock, Thoma Bravo will have the right to nominate a number of directors to our board of directors equal to the lowest whole number that is greater than 5% of the total number of directors (but in no event fewer than one director); and (iv) at least 5% (but less than 10%) of our outstanding shares of common stock, Thoma Bravo will have the right to nominate one director to our board of directors. When Thoma Bravo beneficially owns less than 30% of our common stock, the chairman of our board of directors will be elected by a majority of our directors.
Our directors will be divided into three classes serving staggered three-year terms. Class I, Class II and Class III directors will serve until our annual meetings of stockholders in 2020, 2021 and 2022, respectively. Messrs. , and will be assigned to Class I, Messrs. , and will be assigned to Class II, and Messrs. , and will be assigned to Class III. At each annual meeting of stockholders held after the initial classification, directors will be elected to succeed the class of directors whose terms have expired. This classification of our board of directors could have the effect of increasing the length of time necessary to change the composition of a majority of the board of directors. In general, at least two annual meetings of stockholders will be necessary for stockholders to effect a change in a majority of the members of the board of directors.
Director Independence
Our board of directors has undertaken a review of the independence of each director. Based on information provided by each director concerning his background, employment and affiliations, our board of directors has determined that each of and , do not have relationships that
115
Table of Contents
would interfere with the exercise of independent judgment in carrying out the responsibilities of a director and that each of these directors is independent as that term is defined under the listing standards of the NYSE. In making these determinations, our board of directors considered the current and prior relationships that each non-employee director has with our company and all other facts and circumstances our board of directors deemed relevant in determining their independence and eligibility to serve on the committees of our board of directors, including the transactions involving them described in the section titled Certain Relationships and Related Party Transactions.
Committees of Our Board of Directors
Our board of directors has established an audit committee and a compensation committee, and may have such other committees as the board of directors may establish from time to time. The composition and responsibilities of each of the committees of our board of directors are described below. Members serve on these committees until their resignation or until otherwise determined by our board of directors.
For so long as Thoma Bravo beneficially owns at least 30% of our outstanding shares of common stock, Thoma Bravo will have the right to designate the chairman of each committee of our board of directors, and the directors nominated by Thoma Bravo are expected to constitute a majority of each committee of our board of directors (other than the audit committee), provided that our committee membership will comply with all applicable rules of the NYSE.
Audit Committee
We anticipate that following completion of this offering, our audit committee will consist of , and , each of whom satisfies the requirements for independence and financial literacy under the applicable rules and regulations of the Securities and Exchange Commission, or SEC, and listing standards of the NYSE. We anticipate that following the completion of this offering, will serve as the chair of our audit committee. qualifies as an audit committee financial expert as defined in the rules of the SEC, and satisfies the financial expertise requirements under the listing standards of the NYSE. Following the completion of this offering, our audit committee will, among other things, be responsible for:
| | selecting a qualified firm to serve as the independent registered public accounting firm to audit our financial statements; |
| | helping to ensure the independence and performance of the independent registered public accounting firm; |
| | discussing the scope and results of the audit with the independent registered public accounting firm, and reviewing, with management and the independent registered public accounting firm, our interim and year-end operating results; |
| | developing procedures for employees to submit concerns anonymously about questionable accounting or audit matters; |
| | reviewing our policies on risk assessment and risk management; |
| | reviewing related party transactions; and |
| | approving or, as required, pre-approving, all audit and all permissible non-audit services, other than de minimis non-audit services, to be performed by the independent registered public accounting firm. |
Upon completion of this offering, our audit committee will operate under a written charter that satisfies the applicable rules and regulations of the SEC and the listing standards of the .
116
Table of Contents
Compensation Committee
We anticipate that following completion of this offering, our compensation committee will consist of , and . We anticipate that following the completion of this offering, will serve as the chair of our compensation committee. Each member of our compensation committee is intended to meet the requirements of a non-employee director pursuant to Rule 16b-3 under the Exchange Act. Because we will be a controlled company under the Sarbanes-Oxley Act and rules of the NYSE as of the completion of the offering, we will not be required to have a compensation committee composed entirely of independent directors as of the closing of this offering.
Following the completion of this offering, our compensation committee will, among other things, be responsible for:
| | reviewing and approving the goals and objectives relating to the compensation of our executive officers, including any long-term incentive components of our compensation programs; |
| | evaluating the performance of our executive officers in light of the goals and objectives of our compensation programs and determining each executive officers compensation based on such evaluation; |
| | reviewing and approving, subject, if applicable, to stockholder approval, our compensation programs; |
| | reviewing the operation and efficacy of our executive compensation programs in light of their goals and objectives; |
| | reviewing and assessing risks arising from our compensation programs; |
| | reviewing and recommending to the board of directors the appropriate structure and amount of compensation for our directors; |
| | reviewing and approving, subject, if applicable, to stockholder approval, material changes in our employee benefit plans; and |
| | establishing and periodically reviewing policies for the administration of our equity compensation plans. |
Compensation Committee Interlocks and Insider Participation
During fiscal 2019, our compensation committee consisted of Marcel Bernard (who resigned from our board in May 2019) and Messrs. Lines and Boro. None of the members of our compensation committee is an officer or employee of our company, nor have they even been an officer or employee of our company. None of our executive officers currently serves, or in the past year has served, as a member of the board of directors or compensation committee of any entity that has one or more executive officers serving on our board of directors or compensation committee.
Nominating and Corporate Governance Committee.
Because we will be a controlled company under the Sarbanes-Oxley Act and rules of the NYSE as of the completion of the offering, we will not be required to, and do not currently expect to, have a nominating and corporate governance committee as of the closing of this offering.
117
Table of Contents
If and when we are no longer a controlled company, we will be required to establish a nominating and corporate governance committee. We anticipate that such a nominating and corporate governance committee would consist of three directors who will be independent under the rules of the SEC. This committee would identify, evaluate and recommend qualified nominees to serve on our board of directors, develop and oversee our internal corporate governance processes and maintain a management succession plan. Upon the formation of a nominating and corporate governance committee, we would expect to adopt a nominating and corporate governance committee charter defining the committees primary duties in a manner consistent with the applicable rules and regulations of the SEC and the listing standards of the NYSE.
118
Table of Contents
Executive Compensation Overview
Historically, our executive compensation program has reflected our growth and development-oriented corporate culture. To date, the compensation of Mr. Van Siclen, our Chief Executive Officer, and our other executive officers identified in the 2019 Summary Compensation Table below, who we refer to as the Named Executive Officers, has consisted of a combination of base salary and annual incentive bonuses. Our Named Executive Officers have also been eligible to receive long-term incentive compensation in the form of profits interests. Our named executive officers, like all full-time employees, are eligible to participate in our health and welfare benefit plans. As we transition from a private company to a publicly traded company, we will evaluate our compensation values and philosophy and compensation plans and arrangements as circumstances require.
2019 Summary Compensation Table
The following table summarizes the compensation awarded to, earned by, or paid to our principal executive officer and our next two most highly-compensated executive officers, our Named Executive Officers, for the fiscal year ended March 31, 2019.
| Name and Principal Position |
Fiscal Year |
Salary ($) |
Non-Equity Incentive Plan Compensation ($)(1) |
All Other Compensation ($) |
Total ($) |
|||||||||||||||
| John Van Siclen, Chief Executive Officer |
2019 | $ | 555,000 | $ | 550,000 | $ | 22,938 | (2) | $ | 1,132,938 | ||||||||||
| Stephen J. Pace, Senior Vice President, Worldwide Sales |
2019 | $ | 375,000 | $ | 408,273 | (3) | $ | 26,891 | (4) | $ | 810,165 | |||||||||
| Kevin Burns, Chief Financial Officer |
2019 | $ | 375,000 | $ | 206,250 | $ | 24,717 | (5) | $ | 605,967 | ||||||||||
| (1) | The amounts reported in this column, except as otherwise described below, will represent annual short-term incentive compensation paid to the executives based upon performance during fiscal year 2019. These amounts are not yet known. |
| (2) | Amounts reported represent $4,275 in 401(k) plan matching contributions, $3,431 in disability insurance premiums, $8,766 for a Presidents Club trip in fiscal year 2019 and $6,466 for reimbursement of taxes related to the cost of the Presidents Club trip. |
| (3) | The amounts reported in this column for Mr. Pace include $295,773 earned pursuant to his sales commission plan during fiscal year 2019. |
| (4) | Amounts reported represent $8,037 in 401(k) plan matching contributions, $3,622 in disability insurance premiums, $8,766 for a Presidents Club trip in fiscal year 2019 and $6,466 for reimbursement of taxes related to the cost of the Presidents Club trip. |
| (5) | Amounts reported represent $6,562 in 401(k) plan matching contributions, $2,923 in disability insurance premiums, $8,766 for a Presidents Club trip in fiscal year 2019 and $6,466 for reimbursement of taxes related to the cost of the Presidents Club trip. |
Narrative Disclosure to the 2019 Summary Compensation Table
Base Salaries
We use base salaries to recognize the experience, skills, knowledge and responsibilities required of all our employees, including our named executive officers. Base salaries are reviewed annually,
119
Table of Contents
typically in connection with our annual performance review process, and adjusted from time to time to realign salaries with market levels after taking into account individual responsibilities, performance and experience. For the year ended March 31, 2019, the annual base salaries for each of Messrs. Van Siclen, Pace and Burns were $555,000, $375,000, and $375,000, respectively.
Bonuses and Commissions
In fiscal year 2019, Mr. Pace participated in a commissions plan, which provided for a commission based bonus payment, based upon attainment of global bookings goals. Additionally, each of our named executive officers participated in our annual short-term incentive plan, pursuant to which each was eligible to receive annual bonuses based upon achievement of performance targets for fiscal year 2019. The performance criteria under our annual short-term incentive plan for fiscal year 2019 was an adjusted EBITDA metric determined by our board of directors. The amount of commission earned by Mr. Pace and the amount of short-term incentive compensation earned by each of our named executive officers for fiscal year 2019 is reported above in the Summary Compensation Table.
Equity Compensation
Although we do not have a formal policy with respect to the grant of equity incentive awards to our executive officers, we believe that equity grants provide our executives with a strong link to our long-term performance, create an ownership culture and help to align the interests of our executives and our stockholders. In addition, we believe that equity grants with a time-based vesting feature promote executive retention because this feature incentivizes our executive officers to remain in our employment during the vesting period. Accordingly, our board of directors periodically reviews the equity incentive compensation of our named executive officers and from time to time may grant equity incentive awards to them. During the year ended March 31, 2019, we did not grant any equity incentives to our named executive officers.
Executive Employment Arrangements
We initially entered into offer letters with each of the named executive officers in connection with his or her employment with us, which set forth the terms and conditions of employment of each individual, including base salary, target annual bonus opportunity and standard employee benefit plan participation. Prior to completion of this offering, we anticipate entering into new employment agreements with each of our named executive officers that will amend and restate their prior offer letters in their entirety. In addition, each of our named executive officers has entered into our standard employment, confidential information, invention assignment and arbitration agreement.
120
Table of Contents
Outstanding Equity Awards at 2019 Fiscal Year-End
The following table reflects information regarding outstanding equity-based awards held by our Named Executive Officers as of March 31, 2019. It assumes the completion of the Spin-Off Transactions prior to the completion of this offering, and an initial public offering price of $ (the midpoint of the price range set forth on the cover page of this prospectus). See Spin-Off Transactions.
| Name |
Vesting Start Date | Number of Shares or Units of Stock That Have Not Vested (#) |
Market Value of Shares or Units of Stock That Have Not Vested ($)(1) |
Equity Incentive Plan Awards: Number of Unearned Shares, Units or Other Rights That Have Not Vested (#) |
Equity Incentive Plan Awards: Market or Payout Value of Unearned Shares, Units or Other Rights That Have Not Vested ($)(1) |
|||||||||||||||
| John Van Siclen |
12/15/2014 | (2) | (3) | |||||||||||||||||
| Stephen J. Pace |
3/1/2016 | (2) | (3) | |||||||||||||||||
| Kevin Burns |
9/26/2016 | (2) | (3) | |||||||||||||||||
| 12/20/2016 | (2) | |||||||||||||||||||
| (1) | Represents the fair market value of shares that were unvested as of March 31, 2019. The fair market value assumes an initial public offering price of $ per share, which is the midpoint of the price range set forth on the cover page of this prospectus. |
| (2) | These shares vest over four years, with 25% vesting on the first anniversary of the vesting start date and the remainder vesting in 36 equal monthly installments thereafter. |
| (3) | These shares vest . |
Additional Narrative Disclosure
2019 Equity Incentive Plan
In 2019, our board of directors, upon the recommendation of the compensation committee of the board of directors, adopted our 2019 Equity Incentive Plan, or the 2019 Plan, which was subsequently approved by our stockholders. The 2019 Plan will become effective the day before the date that the registration statement of which this prospectus is a part is declared effective. The 2019 Plan will replace our Management Incentive Unit program, or the MIU Plan. In connection with the Spin-Off Transactions, outstanding awards granted under our MIU Plan will be converted into shares of common stock and restricted stock, which will be granted under our 2019 Plan. Our 2019 Plan provides flexibility to our compensation committee to use various equity-based incentive awards as compensation tools to motivate our workforce.
We have initially reserved shares of our common stock, or the Initial Limit, for the issuance of awards under the 2019 Plan. The 2019 Plan provides that the number of shares reserved and available for issuance under the plan will automatically increase each April 1, beginning on April 1, 2020, by % of the outstanding number of shares of our common stock on the immediately preceding March 31 or such lesser number determined by our compensation committee, or the Annual Increase. This number is subject to adjustment in the event of a stock split, stock dividend or other change in our capitalization.
The shares we issue under the 2019 Plan will be authorized but unissued shares or shares that we reacquire. The shares of common stock underlying any awards that are forfeited, cancelled, held back upon exercise or settlement of an award to satisfy the exercise price or tax withholding, reacquired by us prior to vesting, satisfied without any issuance of stock, expire or are otherwise terminated (other than by exercise) under the 2019 Plan will be added back to the shares of common stock available for issuance under the 2019 Plan.
121
Table of Contents
The maximum aggregate number of shares that may be issued in the form of incentive stock options shall not exceed the Initial Limit cumulatively increased on April 1, 2020 and on each April 1 thereafter by the lesser of the Annual Increase for such year or shares of common stock. The maximum value of all awards that may be granted under the 2019 Plan to any non-employee director in any calendar year shall not exceed $ .
The 2019 Plan will be administered by our compensation committee. Our compensation committee has full power to select, from among the individuals eligible for awards, the individuals to whom awards will be granted, to make any combination of awards to participants, and to determine the specific terms and conditions of each award, subject to the provisions of the 2019 Plan. Persons eligible to participate in the 2019 Plan will be those full or part-time officers, employees, non-employee directors and other key persons (including consultants) as selected from time to time by our compensation committee in its discretion.
The 2019 Plan permits the granting of both options to purchase common stock intended to qualify as incentive stock options under Section 422 of the Internal Revenue Code, or the Code, and options that do not so qualify. The option exercise price of each option will be determined by our compensation committee but may not be less than 100% of the fair market value of our common stock on the date of grant. The term of each option will be fixed by our compensation committee and may not exceed ten years from the date of grant. Our compensation committee will determine at what time or times each option may be exercised.
Our compensation committee may award stock appreciation rights subject to such conditions and restrictions as it may determine. Stock appreciation rights entitle the recipient to shares of common stock, or cash, equal to the value of the appreciation in our stock price over the exercise price. The exercise price of each stock appreciation right may not be less than 100% of the fair market value of the common stock on the date of grant.
Our compensation committee may award restricted shares of common stock and restricted stock units to participants subject to such conditions and restrictions as it may determine. These conditions and restrictions may include the achievement of certain performance goals and/or continued employment with us through a specified vesting period. Our compensation committee may also grant shares of common stock that are free from any restrictions under the 2019 Plan. Unrestricted stock may be granted to participants in recognition of past services or other valid consideration and may be issued in lieu of cash compensation due to such participant.
Our compensation committee may grant cash bonuses under the 2019 Plan to participants, subject to the achievement of certain performance goals.
The 2019 Plan provides that in the case of, and subject to, the consummation of a sale event as defined in the 2019 Plan, all outstanding awards may be assumed, substituted or otherwise continued by the successor entity. To the extent that the successor entity does not assume, substitute or otherwise continue such awards, then (i) all stock options and stock appreciation rights will automatically become fully exercisable and the restrictions and conditions on all other awards with time-based conditions will automatically be deemed waived, and awards with conditions and restrictions relating to the attainment of performance goals may become vested and non-forfeitable in connection with a sale event in the compensation committees discretion and (ii) upon the effectiveness of the sale event, the 2019 Plan and all awards will automatically terminate. In the event of such termination, (i) individuals holding options and stock appreciation rights will be permitted to exercise such options and stock appreciation rights (to the extent exercisable) prior to the sale event, or (ii) we may make or provide for a cash payment to participants holding options and stock appreciation rights equal to the difference between the per share cash consideration payable to stockholders in the sale event and the exercise price of the options or stock appreciation rights (to the extent then exercisable).
122
Table of Contents
Our board of directors may amend or discontinue the 2019 Plan and our compensation committee may amend the exercise price of options and amend or cancel outstanding awards for purposes of satisfying changes in law or any other lawful purpose but no such action may adversely affect rights under an award without the holders consent. Certain amendments to the 2019 Plan require the approval of our stockholders. No awards may be granted under the 2019 Plan after the date that is ten years from the date of stockholder approval.
2019 Employee Stock Purchase Plan
We have not decided whether or when to offer our employees the opportunity to participate in an employee stock purchase plan, in the U.S. or other countries. In 2019, our board of directors adopted and our stockholders approved our 2019 Employee Stock Purchase Plan, or the ESPP. If and when we decide to implement and roll-out this plan, the ESPP authorizes the issuance of up to a total of shares of common stock to participating employees. The ESPP provides that the number of shares reserved and available for issuance under the ESPP shall be cumulatively increased each April 1, beginning on April 1, 2020, and ending on January 1, 2029, by the lesser of (i) one percent of the outstanding number of shares of our common stock on the immediately preceding December 31, (ii) shares or (iii) such lesser number of shares as determined by our compensation committee. The number of shares reserved and available for issuance under the ESPP is subject to adjustment in the event of a stock split, stock dividend or other change in our capitalization.
All employees who are employed by us or any designated subsidiary are eligible to participate in the ESPP, unless otherwise determined by our compensation committee in advance of an offering and consistent with Section 123 of the Code. Any employee who owns five percent or more of the voting power or value of our shares of common stock is not eligible to purchase shares under the ESPP.
We may make one or more offerings each year to our employees to purchase shares under the ESPP. Each eligible employee may elect to participate in any offering by submitting an enrollment form at least 15 business days before the relevant offering date. Unless otherwise determined by our compensation committee, the initial offering under the ESPP will commence upon and will end on the following , with subsequent offering periods to begin on the first business day following each and and end on the last business day occurring on or before the following and , respectively.
Each employee who is a participant in the ESPP may purchase shares by authorizing payroll deductions at a minimum of percent and up to percent of his or her base compensation during an offering period. Unless the participating employee has previously withdrawn from the offering, his or her accumulated payroll deductions will be used to purchase shares of common stock on the last business day of the offering period at a price equal to 85 percent of the fair market value of the common stock on the first business day or the last business day of the offering period, whichever is lower, provided that no more than a number of shares of common stock determined by dividing $25,000 by the fair market value of the common stock on the first day of the offering may be purchased by any one employee during each offering period. Under applicable tax rules, an employee may purchase no more than $25,000 worth of shares, valued at the start of the purchase period, under the ESPP in any calendar year.
The accumulated payroll deductions of any employee who is not a participant on the last day of an offering period will be refunded. An employees rights under the ESPP terminate upon voluntary withdrawal from the plan or when the employee ceases employment with us for any reason.
The ESPP may be terminated or amended by our board of directors at any time. An amendment that increases the number of shares of common stock that are authorized under the ESPP and certain
123
Table of Contents
other amendments require the approval of our stockholders. The compensation committee may adopt subplans under the ESPP for employees of our non-U.S. subsidiaries who may participate in the ESPP and may permit such employees to participate in the ESPP on different terms, to the extent permitted by applicable law.
Annual Short-Term Incentive Plan
In , our board of directors adopted the Annual Short-Term Incentive Plan, or the Bonus Plan, which is administered by our compensation committee. The Bonus Plan provides for annual cash bonuses to selected employees of the Company and our subsidiaries, based upon achievement of certain performance measures, including, but not limited to, contribution targets and earnings before interest, taxes, depreciation and/or amortization (EBITDA).
The amount of the bonus pool under the Bonus Plan in any fiscal year will be determined by the compensation committee, in its sole discretion, based on our achievement of EBITDA for such year as compared to certain EBITDA targets established by the compensation committee. For achievement of 90% of the EBITDA target, 50% of the target bonus pool will be funded, for achievement of 100% of the EBITDA target, 100% of the bonus pool will be funded, and for achievement of 120% or greater of EBITDA target, 150% of the target bonus pool will be funded, with straight-line interpolation between each point. No bonus pool will be created and no payments will be made to participants unless at least 90% of the EBITDA target for such fiscal year is met. In the event no bonus pool is created, our compensation committee, in its discretion, may establish an alternative bonus program.
Each employee who is selected to participate in the Bonus Plan will have a target bonus opportunity set for each fiscal year. A participants target bonus may be based on achievement of one or more performance measures in any fiscal year, as determined in the compensation committees discretion, based on each participants performance and in consultation with our senior management. Achievement of any non-EBITDA performance measures for a fiscal year will be subject to 90% achievement of the EBITDA target for such year. Payment for any fiscal year shall be made within six calendar months following the fiscal year after audited financial statements are approved. To be eligible for a bonus, participants must be employed by us or our subsidiaries as of December 1 of a fiscal year and must remain continuously employed through the date of payment, with any bonus prorated to reflect any partial year of employment. The compensation committee may amend or terminate the Bonus Plan at any time.
Retirement Plans
We maintain a tax-qualified 401(k) retirement plan for eligible employees in the United States to save for retirement on a tax-advantaged basis. Under our 401(k) plan, employees may elect to defer up to 90% of their eligible compensation subject to applicable annual limits set pursuant to the Internal Revenue Code. Our 401(k) plan permits participants to make both pre-tax and certain after-tax (Roth) deferral contributions. The retirement plan is intended to qualify under Section 401(a) of the Internal Revenue Code. We match 50% of employees contributions to the 401(k) Plan up to 3% of compensation. Employees are 100% vested in their contributions to the 401(k) plan.
Indemnification of Officers and Directors
We have agreed to indemnify our directors and executive officers in certain circumstances. See Certain Relationships and Related Party TransactionsLimitation of Liability and Indemnification of Officers and Directors.
124
Table of Contents
Director Compensation
Historically our non-employee directors have been granted profits interests in connection with their appointment to the board (vesting in accordance with our standard vesting schedule of 25% on the first anniversary of grant and in substantially equal monthly increments thereafter through the fourth anniversary of grant). No equity was granted to any of our non-employee directors in fiscal year 2019.
In addition, our directors receive a cash retainer payable quarterly, reflected below. In fiscal year 2019, a majority of our non-employee directors represented Thoma Bravo. In certain cases, disclosed below, directors representing Thoma Bravo were not entitled to and did not receive compensation (either equity or cash).
| Name(1) |
Fees Earned or Paid in Cash ($) |
Total ($) | ||||||
| Seth Boro |
$ | |||||||
| Marcel Bernard(2)(3)(4) |
$ | |||||||
| Kenneth Chip Virnig |
||||||||
| Orlando Bravo(4) |
||||||||
| James K. Lines(2)(3)(5) |
$ | |||||||
| Paul Zuber(2)(3) |
$ | |||||||
| (1) | Messrs. Boro, Bravo and Virnig are included in the table but receive no compensation for their services. All three are representatives of the Thoma Bravo Funds. Messrs. Bernard, Lines and Zuber are Thoma Bravo operating partners. Mr. Lines and Mr. Zuber are our independent directors. |
| (2) | In connection with the Spin-Off Transactions, outstanding awards granted under our MIU Plan will be converted into shares of common stock and restricted stock awards, which will be granted under our 2019 Plan. Assuming the completion of the Spin-Off Transactions prior to the completion of this offering, Messrs. Bernard, Lines and Zuber held , , and unvested shares of restricted stock, respectively, as of March 31, 2019. |
| (3) | Messrs. Bernard, Lines and Zuber are not employees of Thoma Bravo, its affiliates or the Thoma Bravo Funds. Messrs. Bernard, Lines and Zuber may be considered independent contractors of Thoma Bravo and may have business or investment activities unrelated to Thoma Bravo. |
| (4) | Messrs. Bernard and Bravo resigned as directors in May 2019. |
| (5) | This includes approximately $ for healthcare benefits. |
Rule 10b5-1 Sales Plans
Our directors and executive officers may adopt written plans, known as Rule 10b5-1 plans, in which they will contract with a broker to buy or sell shares of our common stock on a periodic basis. Under a Rule 10b5-1 plan, a broker executes trades pursuant to parameters established by the director or executive officer when entering into the plan, without further direction from them. The director or executive officer may amend a Rule 10b5-1 plan in some circumstances and may terminate a plan at any time. Our directors and executive officers also may buy or sell additional shares outside of a Rule 10b5-1 plan when they are not in possession of material nonpublic information subject to compliance with the terms of our insider trading policy. Prior to 180 days after the date of this offering, subject to early termination, the sale of any shares under Rule 10b5-1 plan would be subject to the lock-up agreement that the director or executive officer has entered into with the underwriters.
125
Table of Contents
CERTAIN RELATIONSHIPS AND RELATED PARTY TRANSACTIONS
In addition to the director and executive compensation arrangements, including employment, termination of employment and change in control arrangements, discussed in the sections titled Management and Executive Compensation, the following is a description of each transaction since April 1, 2016, and each currently proposed transaction, in which:
| | we have been or are to be a participant; |
| | the amount involved exceeded or is expected to exceed $120,000; and |
| | any of our directors, executive officers or holders of more than 5% of our outstanding capital stock, or any immediate family member of, or person sharing the household with, any of these individuals or entities, had or will have a direct or indirect material interest. |
Prior to this offering, Dynatrace LLC operated as a wholly owned indirect subsidiary of Compuware Parent, LLC, or Parent. Prior to the completion of this offering and in connection with the Spin-Off Transactions, we plan to enter into an agreement with Compuware Software Group LLC, or Compuware, and certain of its subsidiaries, including Compuware Corporation, relating to our relationship with Compuware after this offering. Other than as described below, we do not currently expect to enter into any additional agreements or other transactions with Compuware, Dynatrace Holdings Corp., or DHC, SIGOS LLC, or SIGOS, or other related entities outside the ordinary course, or with any of our directors, officers or other affiliates.
Relationships with Compuware
Services Provided to Compuware and Related Entities
In the ordinary course of our business, we have provided services to Compuware, DHC and SIGOS, including tax, treasury, equity administration, accounting, finance, reporting, human resources and legal. The cost and fees associated with these services are allocated among the entities based on the co-invest on a basis that we consider to be a reasonable reflection of the use of services provided or the benefit received. Each entity is responsible for its portion of the fees and reimburses us accordingly. Our historical financial statements include reimbursements to us by Compuware, DHC and related entities related to these services. These reimbursements totaled $1.2 million, $0.8 million, and $0.5 million for the years ended March 31, 2017, 2018, and 2019, respectively. We do not anticipate providing these services after the completion of this offering and the Spin-Off Transactions.
Office Leases
We sublease one office in the United Kingdom and one office in France pursuant to sublease agreements with Compuware. The sublease payments for the office in the United Kingdom were $0.1 million for each of the years ended March 31, 2017, 2018 and 2019. The sublease payments for the office in France were $0.3 million for each of the years ended March 31, 2017, 2018 and 2019. We do not intend to renew the sublease agreements with Compuware upon expiration of the sublease for the United Kingdom and France offices in March 2027 and May 2021, respectively.
Benefit Plans
Through December 31, 2017, we participated in Compuwares benefit plans. Our share of compensation and benefit liabilities were paid directly by us to the third-party provider. Through December 31, 2018, we participated in Compuwares 401(k) retirement plan. Employer matching contributions were paid directly by us to the third-party provider. These payments totaled $1.5 million,
126
Table of Contents
$1.4 million, and $1.9 million for the years ended March 31, 2017, 2018 and 2019, respectively. Since December 31, 2018, our benefit plans have been independent of and separate from Compuwares benefit plans.
Compuware Debt
We were a guarantor of a $1.8 billion debt facility, or the Debt Facility, entered into by Compuware on December 15, 2014, with Jefferies Finance, LLC, which was extinguished in August 2018. The Debt Facility was entered into to facilitate the purchase of Compuware Parent LLC by Thoma Bravo, LLC and was set to mature on December 15, 2021. If Compuware was to default on this obligation during the life of the loan, the maximum potential future payments by the guarantors would have been $1,602 million. For the years ended March 31, 2017, 2018 and 2019, we paid $78.9 million, $88.0 million and $1.15 billion, respectively, to related parties to pay principal and interest amounts due under the Debt Facility.
Debt Restructuring
In the year ending March 31, 2019, Compuware entered into a series of transactions involving DHC, SIGOS and us, as well as other international subsidiaries within the group, to restructure its debt and to settle amounts outstanding between the international subsidiaries of Compuware and us. The restructuring was completed in November 2018.
Other
We transferred $13.5 million, $3.9 million, and $0.8 million for the years ended March 31, 2017, 2018, and 2019, respectively, to settle obligations with affiliated companies. We also had receivables from Thoma Bravo affiliates of $0.6 million for the year ended March 31, 2019. In addition, we transferred assets to another company under common control for $2.3 million in the year ended March 31, 2017.
Advisory Services Agreement
In December 2014, Compuware entered into two separate advisory services agreements, or the Consulting Agreements, with two Thoma Bravo entities. We paid Thoma Bravo consulting fees under the Consulting Agreements totaling $2.8 million, $4.9 million, and $4.9 million for the years ended March 31, 2017, 2018 and 2019, respectively. We are also obligated to reimburse Thoma Bravo for reasonable legal, accounting, travel expenses, healthcare, and other fees and expenses incurred by Thoma Bravo in rendering the services under the Consulting Agreements, including without limitation fees paid to certain of our directors. We paid Thoma Bravo $0.2 million, $0.1 million, and $0.1 million for the years ended March 31, 2017, 2018 and 2019, respectively. We paid such directors $0.3 million for each of the years ended March 31, 2017, 2018 and 2019. The Consulting Agreements will terminate upon the completion of this offering.
Employment Agreements
We have entered into employment agreements with our executive officers. For more information regarding the agreements with our named executive officers, see the section of the prospectus captioned Executive Compensation.
127
Table of Contents
Registration Rights
Prior to the completion of this offering, we will enter into a registration rights agreement, or the Registration Rights Agreement, with the Thoma Bravo Funds and certain other holders of our capital stock. Pursuant to the Registration Rights Agreement, we will agree to pay all registration expenses (other than underwriting discounts and commissions and subject to certain limitations set forth therein) of the holders of the shares registered pursuant to the registrations described below. The registration rights will be subject to certain conditions and limitations, including the right of the underwriters to limit the number of shares to be included in an underwritten offering and our right to delay or withdraw a registration statement under certain circumstances.
Pursuant to the Registration Rights Agreement, we will agree to not publicly sell or distribute any securities during the period beginning on the date of the notice of the requested demand registration and ending 90 days after the first effective date of any underwritten registration effected pursuant to the registrations described below (except pursuant to registrations on Form S-4, Form S-8 or any successor form). In addition, in connection with this offering, we expect that each party to the Registration Rights Agreement will agree not to sell or otherwise dispose of any securities without the prior written consent of the underwriters for a period of 180 days after the date of this prospectus, subject to certain terms and conditions and early release of certain holders in specified circumstances. See the section titled Underwriting for additional information regarding such restrictions.
Demand Registration Rights
Pursuant to the Registration Rights Agreement, the holders of a majority of the outstanding Registrable Securities (as defined therein) (the Initiating Holders) will be entitled to request (i) Long-Form Registrations (as defined therein), (ii) an unlimited number of Long-Form Registrations in which the requesting parties shall pay their pro rata share of the registration expenses and (iii) an unlimited number of Short-Form Registrations (as defined therein). In addition, with the consent of the Initiating Holders, the other parties to the Registration Rights Agreement may include their Registrable Securities in a Long-Form Registration or Short-Form Registration.
Piggyback Registration Rights
If at any time we propose to register the offer and sale of shares of our common stock under the Securities Act (other than in this offering, or a registration on Form S-4, Form S-8 or any successor form, or a registration of securities solely relating to an offering and sale to our employees, directors or consultants pursuant to any employee equity plan or other employee benefit plan arrangement, or a registration of non-convertible debt securities) then we must notify the holders of Registrable Securities of such proposal to allow them to include a specified number of their shares of our common stock in such registration, subject to certain marketing and other limitations.
Limitation of Liability and Indemnification of Officers and Directors
Our charter will contain provisions that limit the liability of our directors for monetary damages to the fullest extent permitted by Delaware law. Consequently, our directors will not be personally liable to us or our stockholders for monetary damages for any breach of fiduciary duties as directors, except liability for the following:
| | any breach of their duty of loyalty to our company or our stockholders; |
| | any act or omission not in good faith or that involves intentional misconduct or a knowing violation of law; |
128
Table of Contents
| | unlawful payments of dividends or unlawful stock repurchases or redemptions as provided in Section 174 of the Delaware General Corporation Law, or DGCL; or |
| | any transaction from which they derived an improper personal benefit. |
Any amendment to, or repeal of, these provisions will not eliminate or reduce the effect of these provisions in respect of any act, omission or claim that occurred or arose prior to that amendment or repeal. If the DGCL is amended to provide for further limitations on the personal liability of directors of corporations, then the personal liability of our directors will be further limited to the greatest extent permitted by the DGCL.
In addition, our bylaws will provide that we will indemnify, to the fullest extent permitted by law, any person who is or was a party or is threatened to be made a party to any action, suit or proceeding by reason of the fact that he or she is or was one of our directors or officers or is or was serving at our request as a director or officer of another corporation, partnership, joint venture, trust or other enterprise. Our bylaws will provide that we may indemnify to the fullest extent permitted by law any person who is or was a party or is threatened to be made a party to any action, suit or proceeding by reason of the fact that he or she is or was one of our employees or agents or is or was serving at our request as an employee or agent of another corporation, partnership, joint venture, trust or other enterprise. Our bylaws will also provide that we must advance expenses incurred by or on behalf of a director or executive officer in advance of the final disposition of any action or proceeding, subject to limited exceptions.
Further, we have entered into or will enter into indemnification agreements with each of our directors and executive officers that may be broader than the specific indemnification provisions contained in the DGCL. These indemnification agreements require us, among other things, to indemnify our directors and executive officers against liabilities that may arise by reason of their status or service. These indemnification agreements also require us to advance all expenses incurred by the directors and executive officers in investigating or defending any such action, suit or proceeding. We believe that these agreements are necessary to attract and retain qualified individuals to serve as directors and executive officers.
The limitation of liability and indemnification provisions that will be included in our charter and bylaws and in indemnification agreements that we have entered into or will enter into with our directors and executive officers may discourage stockholders from bringing a lawsuit against our directors and executive officers for breach of their fiduciary duties. They may also reduce the likelihood of derivative litigation against our directors and executive officers, even though an action, if successful, might benefit us and other stockholders. Further, a stockholders investment may be adversely affected to the extent that we pay the costs of settlement and damage awards against directors and executive officers as required by these indemnification provisions. At present, we are not aware of any pending litigation or proceeding involving any person who is or was one of our directors, officers, employees or other agents or is or was serving at our request as a director, officer, employee or agent of another corporation, partnership, joint venture, trust or other enterprise, for which indemnification is sought, and we are not aware of any threatened litigation that may result in claims for indemnification.
We have obtained or will obtain insurance policies under which, subject to the limitations of the policies, coverage is provided to our directors and executive officers against loss arising from claims made by reason of breach of fiduciary duty or other wrongful acts as a director or executive officer, including claims relating to public securities matters, and to us with respect to payments that may be made by us to these directors and executive officers pursuant to our indemnification obligations or otherwise as a matter of law.
129
Table of Contents
Certain of our non-employee directors may, through their relationships with their employers, be insured and/or indemnified against certain liabilities incurred in their capacity as members of our board of directors.
The underwriting agreement provides for indemnification by the underwriters of us and our officers and directors for certain liabilities arising under the Securities Act or otherwise.
Insofar as indemnification for liabilities arising under the Securities Act may be permitted to directors, executive officers or persons controlling our company pursuant to the foregoing provisions, we have been informed that, in the opinion of the SEC, such indemnification is against public policy as expressed in the Securities Act and is therefore unenforceable.
Policies and Procedures for Related Party Transactions
Our board of directors will adopt a formal written policy providing that our audit committee will be responsible for reviewing related party transactions, which are transactions, arrangements or relationships (or any series of similar transactions, arrangements or relationships), to which we are a party, in which the aggregate amount involved exceeds or may be expected to exceed $120,000 and in which a related person has, had or will have a direct or indirect material interest. For purposes of this policy, a related person is defined as a director, executive officer, nominee for director or greater than 5% beneficial owner of our capital stock, in each case since the beginning of the most recently completed year, and any of their immediate family members. In determining whether to approve or ratify any such transaction, our audit committee will take into account, among other factors it deems appropriate, (i) whether the transaction is on terms no less favorable than terms generally available to unaffiliated third parties under the same or similar circumstances and (ii) the extent of the related partys interest in the transaction.
130
Table of Contents
Prior to this offering, Compuware Parent, LLC, or Parent, through its wholly owned indirect subsidiary Dynatrace Holding Corp., or DHC, owned and operated three separate and distinct businesses through three indirect subsidiaries: (i) Dynatrace LLC, the principal operating company of our business, (ii) Compuware Software Group LLC, or Compuware, and (iii) SIGOS LLC, or SIGOS. Dynatrace Holdings LLC is an indirect equityholder of Parent that is treated as a corporation for U.S. federal income tax purposes that will, after the completion of the transactions described below, convert into a Delaware corporation with the name Dynatrace, Inc. and be the issuer of the shares offered pursuant to this prospectus.
Prior to the effectiveness of the registration statement of which this prospectus is a part, Parent, DHC, Compuware, we, and the other direct and indirect equityholders of Parent will effect the following transactions which will result in (i) the spin-off of Compuware and SIGOS as separate companies to the equityholders of Parent and (ii) Dynatrace, Inc. becoming the ultimate parent company of Dynatrace LLC.
| | DHC will, through a series of transactions, distribute to Parent, and Parent will spin-off and distribute to certain of its equityholders (including the Thoma Bravo Funds), all of the equity interests of SIGOS, or the SIGOS Spin-Off; |
| | All of the equityholders of Parent (including the Thoma Bravo Funds) will, through a series of transactions, receive shares of capital stock of Dynatrace Holdings LLC (or, in the case of Dynatrace employees, directors and other service providers who hold unvested equity awards in Parent, a new equity award under our 2019 Equity Incentive Plan that is equivalent in value to such unvested award) in exchange for their equity interests of Parent, after which Parent will merge with and into DHC; |
| | DHC will, through a series of transactions, distribute to Dynatrace Holdings LLC, and Dynatrace Holdings LLC will spin-off and distribute to its equityholders (including the Thoma Bravo Funds), all of the equity interests of Compuware, or the Compuware Spin-Off; |
| | Compuware will distribute to us an amount equal to $ million, which represents the estimated tax payable by us in connection with the Compuware Spin-Off, and all outstanding intercompany receivables and payables between Dynatrace, Compuware, SIGOS and their respective subsidiaries will be extinguished; and |
| | Dynatrace Holdings LLC will convert into a Delaware corporation with the name of Dynatrace, Inc., and the unit holders of Dynatrace Holdings LLC will becomes holders of shares of common stock of Dynatrace, Inc. |
Corporate-level U.S. federal (and possibly state and local) taxes of approximately $ will be payable by us in connection with the Compuware Spin-Off. Compuware has agreed to distribute to us such amount substantially concurrently with the Compuware Spin-Off and prior to the closing of this offering, and we have agreed to promptly remit such amount to the applicable taxing authorities. However, our tax liability relating to the Compuware Spin-Off will not be determined until we complete our applicable tax returns with respect to the taxable period that includes the Compuware Spin-Off. We will be solely responsible for any amount of taxes owed in excess of the amount we receive from Compuware prior to this offering. We do not expect to incur any material tax liabilities in connection with the SIGOS Spin-Off because we estimate that the fair market value of the SIGOS assets is materially similar to the adjusted tax basis in such assets. See Risk FactorsRisks Related to Our BusinessThe Compuware Spin-Off and the SIGOS Spin-Off are taxable transactions for us, and we will be subject to tax liabilities in connection with such transactions.
131
Table of Contents
The following diagram shows our organizational structure immediately prior to giving effect to the Spin-Off Transactions.
| (1) | Includes special purpose investment entities wholly-owned by certain Thoma Bravo Funds. |
| (2) | Dynatrace Holdings LLC will convert to a corporation and be renamed Dynatrace, Inc. immediately prior to the completion of this offering. |
| (3) | Includes employee equityholders and other equityholders who invested alongside the Thoma Bravo Funds. |
132
Table of Contents
Following the completion of the Spin-Off Transactions and prior to the closing of this offering, (i) the Thoma Bravo Funds will own approximately % of Dynatrace, Inc.s issued and outstanding shares of common stock, (ii) DHC will be a wholly owned indirect subsidiary of Dynatrace, Inc. and (iii) Dynatrace LLC will be a wholly owned indirect subsidiary of DHC. Dynatrace, Inc. will be the ultimate parent company of Dynatrace LLC and will have no material assets or operations other than its direct and indirect ownership interests of its subsidiaries, including Dynatrace LLC. Additionally, Dynatrace, Inc. will have several wholly owned direct subsidiaries that are legacies from the corporate structure that existed prior to this offering. Those entities will have no material assets or operations other than their ownership of a portion of the outstanding shares of DHC.
The following diagram shows our organizational structure, and the ownership of Compuware and SIGOS, after giving effect to the Spin-Off Transactions.
| (1) | Includes employee equityholders and other equityholders who invested alongside the Thoma Bravo Funds. |
133
Table of Contents
The following table sets forth certain information with respect to the beneficial ownership of our common stock as of , 2019 that, after the completion of the Spin-Off Transactions, will be owned by:
| | each of our named executive officers; |
| | each of our directors; |
| | all of our current directors and executive officers as a group; and |
| | each person known by us to be the beneficial owner of more than 5% of our common stock. |
We have determined beneficial ownership in accordance with the rules of the SEC, and thus it represents sole or shared voting or investment power with respect to our securities. Unless otherwise indicated below, to our knowledge, the persons and entities named in the table have sole voting and sole investment power with respect to all shares that they beneficially own, subject to community property laws where applicable. The information does not necessarily indicate beneficial ownership for any other purpose, including for purposes of Sections 13(d) and 13(g) of the Securities Act.
We have based our calculation of the percentage of beneficial ownership prior to this offering on shares of our common stock outstanding as of , 2019. We have based our calculation of the percentage of beneficial ownership after this offering on shares of our common stock outstanding immediately after the completion of this offering, assuming that the underwriters will not exercise their option to purchase up to an additional shares of our common stock from us. We have deemed shares of our common stock subject to stock options that are currently exercisable or exercisable within 60 days of , 2019 and shares of our restricted stock that have vested or will vest within 60 days of , 2019 to be outstanding and to be beneficially owned by the person holding the stock option for the purpose of computing the percentage ownership of that person. We did not deem these shares outstanding, however, for the purpose of computing the percentage ownership of any other person.
Unless otherwise indicated, the address of each beneficial owner listed in the table below is c/o Dynatrace LLC, 1601 Trapelo Road, Suite 116, Waltham, MA 02451.
| Beneficial Ownership Prior to the Offering(1) |
Beneficial Ownership After the Offering(1) |
Percent of Total Voting Power After the Offering |
||||||||||||||||||
| Name of Beneficial Owner |
Number | Percent | Number | Percent | ||||||||||||||||
| Named Executive Officers and Directors: |
||||||||||||||||||||
| John Van Siclen |
||||||||||||||||||||
| Kevin Burns |
||||||||||||||||||||
| Stephen J. Pace |
||||||||||||||||||||
| Seth Boro |
||||||||||||||||||||
| Kenneth Virnig |
||||||||||||||||||||
| James K. Lines |
||||||||||||||||||||
| Paul Zuber |
||||||||||||||||||||
| All executive officers and directors as a group (10 persons) |
||||||||||||||||||||
| 5% Stockholders: |
||||||||||||||||||||
| Thoma Bravo Funds(1) |
||||||||||||||||||||
| (1) | Consists of shares held directly by Thoma Bravo Fund X, L.P. (TB Fund X), shares held directly by Thoma Bravo Fund X-A, L.P. (TB Fund X-A), shares held |
134
Table of Contents
| directly by Thoma Bravo Fund XI, L.P. (TB Fund XI), shares held directly by Thoma Bravo Fund XI-A, L.P. (TB Fund XI-A), shares held directly by Thoma Bravo Executive Fund XI, L.P. (TB Exec Fund), shares held directly by Thoma Bravo Special Opportunities Fund I, L.P. (TB SOF) and shares held directly by Thoma Bravo Special Opportunities Fund I AIV, L.P. (TB SOF AIV). Thoma Bravo Partners X, L.P. (TB Partners X) is the general partner of each of TB Fund X, TB Fund X-A, TB SOF and TB SOF AIV. Thoma Bravo Partners XI, L.P. (TB Partners XI) is the general partner of each of TB Fund XI, TB Fund XI-A and TB Exec Fund. Thoma Bravo, LLC is the general partner of each of TB Partners X and TB Partners XI. By virtue of the relationships described in this footnote, Thoma Bravo, LLC may be deemed to exercise voting and dispositive power with respect to the shares held directly by TB Fund X, TB Fund X-A, TB Fund XI, TB Fund XI-A, TB Exec Fund, TB SOF and TB SOF AIV. The principal business address of the entities identified herein is c/o Thoma Bravo, LLC, 150 North Riverside Plaza, Suite 2800, Chicago, Illinois 60606. |
135
Table of Contents
The following is a summary of certain of our indebtedness that is currently outstanding. This summary does not purport to be complete and is qualified by reference to the agreements and related documents referred to herein, copies of which have been filed as exhibits to the registration statement of which this prospectus is a part.
First Lien Credit Facilities
General
On August 23, 2018, or the Closing Date, we entered into a Senior Secured First Lien Credit Agreement with a syndicate of lenders and Jefferies Finance LLC, as administrative agent, collateral agent and letter of credit issuer, and Goldman Sachs Bank USA and JPMorgan Chase Bank, N.A., as joint bookrunners and joint lead arrangers, which we refer to as the First Lien Credit Agreement.
The First Lien Credit Agreement provides for a term loan facility, or the First Lien Term Loan, in an original aggregate principal amount of $950.0 million and a senior secured revolving credit facility in an aggregate principal amount of $60.0 million, or the Revolving Credit Facility, which together with First Lien Term Loan, we refer to as the First Lien Credit Facilities. The Revolving Credit Facility includes a $15.0 million sublimit for the issuance of letters of credit. As of March 31, 2019, we had outstanding borrowings of $947.6 million and $0.5 million of First Lien Term Loan and letter of credit, respectively, and no outstanding borrowings under our Revolving Credit Facility. The First Lien Term Loan matures on August 23, 2025. Borrowings under the Revolving Credit Facility mature on August 23, 2023.
Amortization, Interest Rates and Fees
The First Lien Credit Agreement requires us to repay the principal of the First Lien Term Loan in equal quarterly repayments equal to 0.25% of the original principal amount of First Lien Term Loan.
The First Lien Term Loan bears interest at a floating rate which can be, at our option, either (1) a Eurodollar rate for a specified interest period plus an applicable margin of up to 3.25% or (2) a base rate plus an applicable margin of up to 2.25%. The applicable margins for Eurodollar rate and base rate borrowings are each subject to a reduction to 3.00% and 2.00%, respectively, based on our first lien net leverage ratio. The applicable margins for Eurodollar rate and base rate borrowings are each subject to an additional reduction of 0.25% upon the completion of an initial public offering based on our first lien net leverage ratio.
The borrowings under the Revolving Credit Facility bear interest at a floating rate which can be, at our option, either (1) a Eurodollar rate for a specified interest period plus an applicable margin of up to 3.25% or (2) a base rate plus an applicable margin of up to 2.25%. The applicable margins for Eurodollar rate and base rate borrowings are subject to reductions to 3.00% and 2.75% and 2.00% and 1.75%, respectively, based on our first lien net leverage ratio. The applicable margins for Eurodollar rate and base rate borrowings are each subject to an additional reduction of 0.25% upon the completion of an initial public offering. The Eurodollar rate applicable to the Revolving Credit Facility is subject to a floor of 0.0%.
The base rate for any day is a fluctuating rate per annum equal to the highest of (a) the prime rate as last quoted by The Wall Street Journal, (b) the federal funds effective rate in effect on such day, plus 0.50% per annum and (c) the Eurodollar rate for a one-month interest period plus 1.00%. The base rate applicable to the Revolving Credit Facility and the First Lien Term Loan is subject to a floor of 0.0%.
136
Table of Contents
In addition to paying interest on loans outstanding under the First Lien Term Loan and the Revolving Credit Facility, we are required to pay a commitment fee of up to 0.50% per annum of unused commitments under the Revolving Credit Facility, subject to reductions to 0.375% and 0.25% per annum based on our first lien net leverage ratio. We are also required to pay letter of credit fees on a per annum basis equal to the daily maximum amount available to be drawn under each letter of credit multiplied by the applicable margin for Eurodollar loans under the Revolving Credit Facility. We are required to pay customary fronting, issuance, and administrative fees for the issuance of letters of credit.
Voluntary Prepayments
We are permitted to voluntarily prepay or repay outstanding loans under the Revolving Credit Facility or First Lien Term Loan at any time, in whole or in part, subject to minimum amounts, and, with respect to the Revolving Credit Facility only, to subsequently reborrow amounts prepaid. Prior to the six month anniversary of the Closing Date, we are required to pay a 1.00% prepayment fee in connection with any voluntary prepayments of the First Lien Term Loan that constitute a Repricing Transaction (as defined in the First Lien Credit Agreement). With respect to the Revolving Credit Facility, prepayments are without premium or penalty.
We are permitted to reduce commitments under the Revolving Credit Facility at any time, in whole or in part, subject to minimum amounts.
Mandatory Prepayments
The First Lien Credit Agreement requires us to prepay, subject to certain exceptions, the First Lien Term Loan with a portion of our excess cash flow in an amount ranging from 0% to 50% of excess cash flow depending on our first lien net leverage ratio, with the net cash proceeds of certain asset sales and dispositions in an amount ranging from 0% to 100% of such net cash proceeds depending on our first lien net leverage ratio, and with 100% of the proceeds from certain debt issuances, in each case, subject to certain exceptions.
Guarantees
Subject to certain exceptions, all obligations under the First Lien Credit Facilities, as well as certain hedging and cash management arrangements, are jointly and severally, fully and unconditionally, guaranteed on a senior secured basis by current and future direct and indirect domestic subsidiaries of Dynatrace LLC (other than unrestricted subsidiaries, joint ventures, subsidiaries prohibited by applicable law from becoming guarantors and certain other exempted subsidiaries).
Security
Our obligations and the obligations of the guarantors under the First Lien Credit Facilities are secured by first priority pledges of and security interests in (i) substantially all of the existing and future equity interests of Dynatrace LLC and each subsidiary guarantor, as well as 65% of the equity interests of certain first-tier foreign subsidiaries held by the borrower or the guarantors under the First Lien Credit Agreement and (ii) substantially all of the Dynatrace LLCs and each guarantors tangible and intangible assets, in each case subject to other exceptions.
Certain Covenants
The First Lien Credit Agreement contains a number of covenants that, among other things, restrict, subject to certain exceptions, our ability to:
| | incur additional indebtedness; |
137
Table of Contents
| | incur liens; |
| | engage in mergers, consolidations, liquidations or dissolutions; |
| | pay dividends and distributions on, or redeem, repurchase or retire our capital stock; |
| | make investments, acquisitions, loans, or advances; |
| | create negative pledge or restrictions on the payment of dividends or payment of other amounts owed from subsidiaries; |
| | sell, transfer or otherwise dispose of assets, including capital stock of subsidiaries; |
| | make prepayments of material debt that is subordinated with respect to right of payment; |
| | engage in certain transactions with affiliates; |
| | modify certain documents governing material debt that is subordinated with respect to right of payment; |
| | change our fiscal year; and |
| | change our lines of business. |
In addition, the terms of the First Lien Credit Agreement include a financial covenant which requires that, at the end of each fiscal quarter, for so long as the aggregate principal amount of borrowings under the Revolving Credit Facility (excluding undrawn letters of credit of up to $5 million) exceeds 35% of the aggregate commitments under the Revolving Credit Facility, our first lien net leverage ratio cannot exceed 7.50 to 1.00. A breach of this financial covenant will not result in a default or event of default under the First Lien Term Loan unless and until a majority of the lenders under the Revolving Credit Facility have terminated the commitments under the Revolving Credit Facility and declared the borrowings under the Revolving Credit Facility due and payable.
Events of Default
The First Lien Credit Agreement contains certain customary events of default, including, among others, failure to pay principal, interest or other amounts; material inaccuracy of representations and warranties; violation of covenants; specified cross-default and cross-acceleration to other material indebtedness; certain bankruptcy and insolvency events; certain ERISA events; certain undischarged judgments; material invalidity of guarantees or grant of security interest; and change of control.
Second Lien Credit Facility
General
On the Closing Date, we entered into a Senior Secured Second Lien Credit Agreement with a syndicate of lenders and Jefferies Finance LLC, as administrative agent and collateral agent, and Goldman Sachs Bank USA and JPMorgan Chase Bank, N.A., as joint bookrunners and joint lead arrangers, which we refer to as the Second Lien Credit Agreement. The Second Lien Credit Agreement provides for a term loan facility, or the Second Lien Credit Facility, in an original aggregate principal amount of $170.0 million. As of March 31, 2019, we had outstanding borrowings of $88.7 million under the Second Lien Credit Facility. Borrowings under the Second Lien Credit Facility will mature on August 23, 2026.
Interest Rates and Fees
The borrowings under the Second Lien Credit Facility bear interest at a floating rate which can be, at our option, either (1) on a Eurodollar rate for a specified interest period plus 7.00% or (2) a base rate plus 6.00%.
138
Table of Contents
The base rate for any day is a fluctuating rate per annum equal to the highest of (a) the prime rate as last quoted by The Wall Street Journal, (b) the federal funds effective rate in effect on such day, plus 0.50% per annum and (c) the Eurodollar rate for a one-month interest period plus 1.00%. The base rate applicable to the Second Lien Term Loan is subject to a floor of 0.0%.
Voluntary Prepayments
We are permitted to voluntarily prepay or repay outstanding loans under the Second Lien Credit Facility at any time, in whole or in part, subject to minimum amounts. We are required to pay a make-whole premium on prepayments in an amount (a) for the period from the Closing Date to the first anniversary of the Closing Date, equal to 2.00% of the principal amount of the Second Lien Credit Facility being prepaid or, if the prepayment or repayment is in connection with a public offering or change of control, 1.00%, and (b) from the period from the first anniversary of the Closing Date to the second anniversary of the Closing Date, equal to 1.00% of the principal amount of the Second Lien Credit Facility being prepaid.
Mandatory Prepayments
The Second Lien Credit Agreement requires us to prepay, subject to certain exceptions, the Second Lien Term Loan with the net cash proceeds of certain asset sales and dispositions in an amount ranging from 0% to 100% of such net cash proceeds depending on our first lien net leverage ratio, and with 100% of the proceeds from certain debt issuances, in each case, subject to certain exceptions.
Such mandatory prepayments of the Second Lien Credit Facility are required only (i) if the First Lien Term Loan (and any refinancing thereof) has been paid in full or (ii) to the extent that the net cash proceeds of asset sales or dispositions or certain debt issuances, as applicable, have been declined by any lender under the First Lien Credit Agreement.
Guarantees
Subject to certain exceptions, all obligations under the Second Lien Credit Facility, as well as certain hedging and cash management arrangements, are jointly and severally, fully and unconditionally, guaranteed on a senior secured basis by current and future direct and indirect domestic subsidiaries of Dynatrace LLC (other than unrestricted subsidiaries, our joint ventures, subsidiaries prohibited by applicable law from becoming guarantors and certain other exempted subsidiaries).
Security
Our obligations and the obligations of the guarantors under the Second Lien Credit Facility are secured by second priority pledges of and security interests in (i) substantially all of the existing and future equity interests of Dynatrace LLC and each subsidiary guarantor, as well as 65% of the equity interests of certain first-tier foreign subsidiaries held by the borrower or the guarantors under the Second Lien Credit Agreement and (ii) substantially all of Dynatrace LLCs and each guarantors tangible and intangible assets, in each case subject to other exceptions.
Certain Covenants
The Second Lien Credit Agreement contains a number of covenants that, among other things, restrict, subject to certain exceptions, our ability to:
| | incur additional indebtedness; |
139
Table of Contents
| | incur liens; |
| | engage in mergers, consolidations, liquidations or dissolutions; |
| | pay dividends and distributions on, or redeem, repurchase or retire our capital stock; |
| | make investments, acquisitions, loans, or advances; |
| | create negative pledge or restrictions on the payment of dividends or payment of other amounts owed from subsidiaries; |
| | sell, transfer or otherwise dispose of assets, including capital stock of subsidiaries; |
| | make prepayments of material debt that is subordinated with respect to right of payment; |
| | engage in certain transactions with affiliates; |
| | modify certain documents governing material debt that is subordinated with respect to right of payment; |
| | change our fiscal year; and |
| | change our lines of business. |
Events of Default
The Second Lien Credit Agreement contains certain customary events of default, including, among others, failure to pay principal, interest or other amounts; material inaccuracy of representations and warranties; violation of covenants; specified cross-default and cross-acceleration to other material indebtedness; certain bankruptcy and insolvency events; certain ERISA events; certain undischarged judgments; material invalidity of guarantees or grant of security interest; and change of control.
140
Table of Contents
General
The following is a summary of the rights of our common stock and preferred stock and certain provisions of our charter and bylaws. This summary does not purport to be complete and is qualified in its entirety by the provisions of our charter and bylaws and Registration Rights Agreement, copies of which will be filed as exhibits to the registration statement of which this prospectus is a part, and to the applicable provisions of Delaware law.
Immediately following the completion of this offering, our authorized capital stock will consist of shares of capital stock, $ par value per share, of which:
| | shares are designated as common stock; and |
| | shares are designated as preferred stock. |
As of , 2019, there were shares of our common stock outstanding (assuming an initial public offering price of $ per share (the midpoint of the estimated offering price range set forth on the cover page of this prospectus)), held by stockholders of record, and no shares of our preferred stock outstanding, assuming the completion of the Spin-Off Transactions, which will be effective prior to the effectiveness of the registration statement of which this prospectus is a part, and the effectiveness of our charter upon the completion of this offering.
Common Stock
Dividend Rights
Subject to preferences that may apply to any shares of preferred stock outstanding at the time, and any contractual limitations, such as our credit agreements, the holders of our common stock are entitled to receive dividends out of funds then legally available, if any, if our board of directors, in its discretion, determines to issue dividends and then only at the times and in the amounts that our board of directors may determine.
Voting Rights
The holders of our common stock are entitled to one vote per share. Our common stock will vote as a single class on all matters relating to the election and removal of directors on our board of directors and as provided by law. Our stockholders do not have the ability to cumulate votes for the election of directors. Except in respect of matters relating to the election of directors, or as otherwise provided in our charter or required by law, all matters to be voted on by our stockholders must be approved by a majority of the shares present in person or by proxy at the meeting and entitled to vote on the subject matter. In the case of the election of directors, director candidates must be approved by a plurality of the shares present in person or by proxy at the meeting and entitled to vote on the election of directors.
No Preemptive or Similar Rights
Our common stock is not entitled to preemptive rights and is not subject to conversion, redemption or sinking fund provisions.
Right to Receive Liquidation Distributions
If we become subject to a liquidation, dissolution or winding-up, the assets legally available for distribution to our stockholders would be distributable ratably among the holders of our common stock
141
Table of Contents
and any participating preferred stock outstanding at that time, subject to prior satisfaction of all outstanding debt and liabilities and the preferential rights and payment of liquidation preferences, if any, on any outstanding shares of preferred stock.
Fully Paid and Non-Assessable
All of the outstanding shares of our common stock are, and the shares of our common stock to be issued pursuant to this offering will be, fully paid and non-assessable.
Preferred Stock
After the completion of this offering, no shares of our preferred stock will be outstanding. Pursuant to our charter, our board of directors will have the authority, without further action by the stockholders, to issue from time to time shares of preferred stock in one or more series. Our board of directors may designate the rights, preferences, privileges and restrictions of the preferred stock, including dividend rights, conversion rights, voting rights, redemption rights, liquidation preference, sinking fund terms, and the number of shares constituting any series or the designation of any series. The issuance of preferred stock could have the effect of restricting dividends on our common stock, diluting the voting power of our common stock, impairing the liquidation rights of our common stock, or delaying, deterring or preventing a change in control. Such issuance could have the effect of decreasing the market price of our common stock. Any preferred stock so issued may rank senior to our common stock with respect to the payment of dividends or amounts upon liquidation, dissolution or winding up, or both. We currently have no plans to issue any shares of preferred stock.
Options
As of , 2019, we had outstanding options to purchase an aggregate of shares of our common stock, with a weighted-average exercise price of $ per share.
Anti-Takeover Provisions in Our Charter and Bylaws
Certain provisions of our charter and bylaws that will be effective as of the completion of this offering may have the effect of delaying, deferring or discouraging another person from attempting to acquire control of us. These provisions, which are summarized below, may discourage takeovers, coercive or otherwise. These provisions are also geared, in part, towards encouraging persons seeking to acquire control of us to negotiate first with our board of directors. We believe that the benefits of increased protection of our potential ability to negotiate with an unfriendly or unsolicited acquirer outweigh the disadvantages of discouraging a proposal to acquire us because negotiation of these proposals could result in an improvement of their terms.
Board Size; Board of Directors Vacancies; Directors Removed Only for Cause. Our charter and bylaws allow Thoma Bravo to set the size of our board of directors and fill any vacancy on our board of directors, including newly created seats, for so long as Thoma Bravo beneficially owns at least 30% of the outstanding shares of our common stock. Upon Thoma Bravo ceasing to own at least 30% of the outstanding shares of our common stock, only our board of directors will be allowed to fill vacant directorships. In addition, (i) prior to the first date on which Thoma Bravo ceases to beneficially own at least 30% of the voting power of our then outstanding capital stock entitled to vote generally in the election of directors, our directors may be removed with or without cause upon the affirmative vote of Thoma Bravo and (ii) on and after such date on which Thoma Bravo ceases to beneficially own at least 30% of the voting power of our then outstanding capital stock entitled to vote generally in the election
142
Table of Contents
of directors, directors may only be removed for cause and only upon the affirmative vote of the holders of 66 2/3% or more of our outstanding shares of capital stock then entitled to vote at a meeting of our stockholders called for that purpose. In the event Thoma Bravo ceases to beneficially own at least 30% of the voting power of our then outstanding capital stock entitled to vote generally in the election of directors, directors previously nominated by Thoma Bravo would be entitled to serve the remainder of their respective terms, unless they are otherwise removed for cause in accordance with the terms of our charter. These provisions may have the effect of deferring, delaying or discouraging hostile takeovers, or changes in control or management of our company. In addition, following the date on which Thoma Bravo ceases to beneficially own at least 30% of the outstanding shares of our common stock, the number of directors constituting our board of directors will be permitted to be set only by a resolution adopted by a majority vote of our entire board of directors. These provisions would prevent a stockholder from increasing the size of our board of directors and then gaining control of our board of directors by filling the resulting vacancies with its own nominees. This will make it more difficult to change the composition of our board of directors and will promote continuity of management.
Classified Board. Our charter and bylaws provide that our board of directors is classified into three classes of directors, with each class serving three-year staggered terms. A third party may be discouraged from making a tender offer or otherwise attempting to obtain control of us as it is more difficult and time-consuming for stockholders to replace a majority of the directors on a classified board of directors.
Stockholder Action; Special Meeting of Stockholders. Pursuant to Section 228 of the DGCL, any action required to be taken at any annual or special meeting of the stockholders may be taken without a meeting, without prior notice and without a vote if a consent or consents in writing, setting forth the action so taken, is signed by the holders of outstanding stock having not less than the minimum number of votes that would be necessary to authorize or take such action at a meeting at which all shares of our stock entitled to vote thereon were present and voted, unless our certificate of incorporation provides otherwise. Our charter provides that so long as Thoma Bravo beneficially owns at least a majority of the outstanding shares of our common stock, any action required or permitted to be taken by our stockholders may be effected by written consent. Our charter provides that, after Thoma Bravo ceases to beneficially own at least a majority of the outstanding shares of our common stock, our stockholders may not take action by written consent but may only take action at annual or special meetings of our stockholders. As a result, a holder controlling a majority of our capital stock after Thoma Bravo no longer owns at least a majority of the outstanding shares of our common stock would not be able to amend our bylaws or remove directors without holding a meeting of our stockholders called in accordance with our bylaws. Our charter provides that special meetings of the stockholders may be called only upon a resolution approved by a majority of the total number of directors that we would have if there were no vacancies, the chairman of our board of directors, the Chief Executive Officer or the President, or, prior to the date that Thoma Bravo ceases to beneficially own at least a majority of the voting power of our then outstanding capital stock entitled to vote generally in the election of directors, at the request of the holders of a majority of the voting power of our then outstanding shares of voting capital stock. These provisions might delay the ability of our stockholders to force consideration of a proposal or for stockholders controlling a majority of our capital stock to take any action, including the removal of directors.
Advance Notice Requirements for Stockholder Proposals and Director Nominations. Our bylaws provide advance notice procedures for stockholders seeking to bring business before our annual meeting of stockholders or to nominate candidates for election as directors at our annual meeting of stockholders. Our bylaws specify certain requirements regarding the form and content of a stockholders notice. Our bylaws prohibit the conduct of any business at a special meeting other than as specified in the notice for such meeting. Our bylaws also provide that nominations of persons for election to our board of directors may be made at a special meeting of stockholders at which directors
143
Table of Contents
are to be elected pursuant to the notice of meeting (i) by or at the direction of our board of directors or (ii) provided that our board of directors has determined that directors shall be elected at such meeting, by any stockholder who (a) is a stockholder of record both at the time the notice is delivered and on the record date for the determination of stockholders entitled to vote at the special meeting, (b) is entitled to vote at the meeting and upon such election and (c) complies with the notice procedures set forth in our bylaws. These provisions might preclude our stockholders from bringing matters before our annual meeting of stockholders or from making nominations for directors at our annual meeting of stockholders if the proper procedures are not followed. We expect that these provisions may also discourage or deter a potential acquirer from conducting a solicitation of proxies to elect the acquirers own slate of directors or otherwise attempting to obtain control of our company. These provisions will not apply to nominations of candidates for elections as directors by Thoma Bravo.
No Cumulative Voting. The DGCL provides that stockholders are not entitled to cumulate votes in the election of directors unless a corporations certificate of incorporation provides otherwise. Our charter does not provide for cumulative voting.
Amendment of Charter Provisions and Bylaws. Our charter provides that prior to the date that Thoma Bravo ceases to beneficially own a majority of the voting power of our then outstanding capital stock entitled to vote generally in the election of directors (the Trigger Date), our bylaws may be adopted, amended, altered or repealed by the vote of a majority of the voting power of our then outstanding voting capital stock, voting together as a single class. After the Trigger Date, our charter and bylaws may be adopted, amended, altered or repealed by either (i) a vote of a majority of the total number of directors that the company would have if there were no vacancies or (ii) in addition to any other vote otherwise required by law, the affirmative vote of the holders of at least 66 2/3% of the voting power of our then outstanding capital stock entitled to vote generally in the election of directors, voting together as a single class.
Our charter also provides that following the Trigger Date, the provisions of our charter relating to the size and composition of our board of directors, limitation on liabilities of directors, stockholder action by written consent, the ability of stockholders to call special meetings, business combinations with interested persons, amendment of our bylaws or charter and the Court of Chancery of the State of Delaware as the exclusive forum for certain disputes, may only be amended, altered, changed or repealed by the affirmative vote of the holders of at least 66 2/3% of the voting power of all of our outstanding shares of capital stock entitled to vote generally in the election of directors, voting together as a single class. Prior to the Trigger Date, such provisions may be amended, altered, changed or repealed by the affirmative vote of the holders of a majority of the voting power of our then outstanding capital stock entitled to vote generally in the election of directors, voting together as a single class. Our charter also provides that the provision of our charter that deals with corporate opportunity may only be amended, altered or repealed by a vote of % of the voting power of our then outstanding capital stock entitled to vote generally in the election of directors, voting together as a single class. See Corporate Opportunity.
Issuance of Undesignated Preferred Stock. Our board of directors has the authority, without further action by our stockholders, to designate and issue shares of preferred stock with rights and preferences, including super voting, special approval, dividend or other rights or preferences on a discriminatory basis. The existence of authorized but unissued shares of undesignated preferred stock would enable our board of directors to render more difficult or to discourage an attempt to obtain control of us by means of a merger, tender offer, proxy contest or other means.
Business Combinations with Interested Stockholders. We have elected in our charter not to be subject to Section 203 of the DGCL, an anti-takeover law. In general, Section 203 prohibits a publicly held Delaware corporation from engaging in a business combination, such as a merger, with an interested stockholder (i.e., a person or group owning 15% or more of the corporations voting capital
144
Table of Contents
stock) for a period of three years following the date the person became an interested stockholder, unless (with certain exceptions) the business combination or the transaction in which the person became an interested stockholder is approved in a prescribed manner. Accordingly, we are not subject to any anti-takeover effects of Section 203 of the DGCL. However, our charter contains provisions that have the same effect as Section 203, except that they provide that sales of common stock to or by Thoma Bravo will be deemed to have been approved by our board of directors, and thereby not subject to the restrictions set forth in our charter that have the same effect as Section 203 of the DGCL.
Corporate Opportunity. Messrs. Boro and Virnig, managing partners of Thoma Bravo, and Messrs. Lines and Zuber, operating partners of Thoma Bravo, currently serve on our board of directors and will continue to serve as directors following completion of this offering. Thoma Bravo, as the ultimate general partner of the Thoma Bravo Funds, will continue to beneficially own a majority of our outstanding common stock upon the completion of this offering. Thoma Bravo may beneficially hold equity interests in entities that directly or indirectly compete with us, and companies in which it currently invests may begin competing with us. As a result of these relationships, when conflicts between the interests of Thoma Bravo, on the one hand, and of other stockholders, on the other hand, arise, these directors may not be disinterested. Although our directors and officers have a duty of loyalty to us under the DGCL and our charter, transactions that we enter into in which a director or officer has a conflict of interest are generally permissible so long as (i) the material facts relating to the directors or officers relationship or interest as to the transaction are disclosed to our board of directors and a majority of our disinterested directors approved the transactions, (ii) the material facts relating to the directors or officers relationship or interest are disclosed to our stockholders and a majority of our disinterested stockholders approve the transaction or (iii) the transaction is otherwise fair to us.
Our charter provides that no officer or director of our company who is also a principal, officer, director, member, manager, partner, employee and/or independent contractor of Thoma Bravo will be liable to us or our stockholders for breach of any fiduciary duty by reason of the fact that any such individual pursues or acquires a corporate opportunity for its own account or the account of an affiliate, as applicable, instead of us, directs a corporate opportunity to Thoma Bravo instead of us or does not communicate information regarding a corporate opportunity to us. Our charter also provides that any principal, officer, director, member, manager, partner, employee and/or independent contractor of Thoma Bravo or any entity that controls, is controlled by or under common control with Thoma Bravo or any investment funds advised by Thoma Bravo will not be required to offer any transaction opportunity of which they become aware to us and could take any such opportunity for themselves or offer it to other companies in which they have an investment.
This provision may not be modified without the affirmative vote of the holders of at least % of the voting power of all of our outstanding shares of common stock.
Choice of Forum
Our bylaws that will become effective upon the completion of this offering will provide that the Court of Chancery of the State of Delaware will be the sole and exclusive forum for state law claims for (i) any derivative action or proceeding brought on our behalf, (ii) any action asserting a breach of fiduciary duty by one or more of our directors, officers or employees, (iii) any action asserting a claim against us arising pursuant to the Delaware General Corporation Law or (iv) any action asserting a claim against us that is governed by the internal affairs doctrine. This provision will not apply to actions arising under the Securities Act or the Exchange Act. Additionally, the forum selection clause in our bylaws may limit our stockholders ability to obtain a favorable judicial forum for disputes with us. The Court of Chancery of the State of Delaware may also reach different judgments or results than would other courts, including courts where a stockholder considering an action may be located or would
145
Table of Contents
otherwise choose to bring the action, and such judgments may be more or less favorable to us than our stockholders. Any person or entity purchasing or otherwise acquiring any interest in shares of our capital stock shall be deemed to have notice of and consented to the forum provisions in our bylaws. The enforceability of similar choice of forum provisions in other companies certificates of incorporation and bylaws has been challenged in legal proceedings, and it is possible that a court could find these types of provisions to be inapplicable or unenforceable.
Transfer Agent and Registrar
Upon the completion of this offering, the transfer agent and registrar for our common stock will be Computershare Trust Company, N.A.
Limitations of Liability and Indemnification
See the section titled Certain Relationships and Related Party TransactionsLimitation of Liability and Indemnification of Officers and Directors.
Listing
We intend to apply for listing of our common stock on the New York Stock Exchange under the symbol DT.
146
Table of Contents
SHARES ELIGIBLE FOR FUTURE SALE
Prior to the completion of this offering, there has been no public market for shares of our common stock. Future sales of shares of our common stock in the public market after this offering, or the perception that these sales may occur, could adversely affect the prevailing market price at such time and our ability to raise equity capital in the future.
Following the completion of this offering, based on the number of shares of our common stock outstanding as of , 2019, a total of shares of our common stock will be outstanding. Of these shares, all shares of our common stock sold in this offering will be eligible for sale in the public market without restriction under the Securities Act, except that any shares of our common stock purchased in this offering by our affiliates, as that term is defined in Rule 144 under the Securities Act, would only be able to be sold in compliance with the conditions of Rule 144 described below.
The remaining shares of our common stock will be deemed restricted securities, as that term is defined in Rule 144 under the Securities Act. These restricted securities will be eligible for sale in the public market only if they are registered or if they qualify for an exemption from registration under Rule 144 or Rule 701 under the Securities Act, which rules are summarized below. Subject to the lock-up agreements described below, the provisions of our Registration Rights Agreement described under the section titled Certain Relationships and Related Party TransactionsRegistration Rights, the applicable conditions of Rule 144 or Rule 701, and our insider trading policy, these restricted securities will be eligible for sale in the public market from time to time beginning 181 days after the date of this prospectus.
Lock-Up Agreements
We, our executive officers and directors, the Thoma Bravo Funds and substantially all of the other holders of our common stock or stock options outstanding immediately prior to this offering have agreed or will agree to enter into lock-up agreements with the underwriters of this offering under which we and they have agreed or will agree that, subject to certain exceptions, without the prior written consent of Goldman Sachs & Co. LLC and J.P. Morgan Securities LLC, we and they will not dispose of or hedge any shares or any securities convertible into or exchangeable for shares of our common stock for a period of 180 days after the date of this prospectus. The consent of Goldman Sachs & Co. LLC and J.P. Morgan Securities LLC is required to release any of the securities subject to these lock-up agreements. See the section titled Underwriting.
Rule 144
Rule 144 generally provides that, once we have been subject to the public company reporting requirements of Section 13 or Section 15(d) of the Exchange Act for at least 90 days, a stockholder who is not deemed to have been one of our affiliates at any time during the preceding 90 days and who has beneficially owned the shares of our common stock proposed to be sold for at least six months is entitled to sell such shares in reliance upon Rule 144 without complying with the volume limitation, manner of sale or notice conditions of Rule 144. If such stockholder has beneficially owned the shares of our common stock proposed to be sold for at least one year, then such person is entitled to sell such shares in reliance upon Rule 144 without complying with any of the conditions of Rule 144.
Rule 144 also provides that a stockholder who is deemed to have been one of our affiliates at any time during the preceding 90 days and who has beneficially owned the shares of our common stock proposed to be sold for at least six months is entitled to sell such shares in reliance upon Rule 144
147
Table of Contents
within any three-month period beginning 90 days after the date of this prospectus a number of shares that does not exceed the greater of:
| | 1% of the number of shares of our capital stock then outstanding, which will equal shares immediately after the completion of this offering; or |
| | the average weekly trading volume of our common stock during the four calendar weeks preceding the filing of a notice on Form 144 with respect to such sale. |
Sales of our common stock made in reliance upon Rule 144 by a stockholder who is deemed to have been one of our affiliates at any time during the preceding 90 days are also subject to the current public information, manner of sale and notice conditions of Rule 144.
Rule 701
Rule 701 generally provides that, once we have been subject to the public company reporting requirements of Section 13 or Section 15(d) of the Exchange Act for at least 90 days, a stockholder who purchased shares of our common stock pursuant to a written compensatory benefit plan or contract and who is not deemed to have been one of our affiliates at any time during the preceding 90 days may sell such shares in reliance upon Rule 144 without complying with the current public information or holding period conditions of Rule 144. Rule 701 also provides that a stockholder who purchased shares of our common stock pursuant to a written compensatory benefit plan or contract and who is deemed to have been one of our affiliates during the preceding 90 days may sell such shares under Rule 144 without complying with the holding period condition of Rule 144. However, all stockholders who purchased shares of our common stock pursuant to a written compensatory benefit plan or contract are required to wait until 90 days after the date of this prospectus before selling such shares pursuant to Rule 701.
Registration Rights
After the completion of this offering, the holders of shares of our common stock will be entitled to certain rights with respect to the registration of such shares (and any additional shares acquired by such holders in the future) under the Securities Act. The registration of these shares of our common stock under the Securities Act would result in these shares becoming eligible for sale in the public market without restriction under the Securities Act immediately upon the effectiveness of such registration, subject to the Rule 144 limitations applicable to affiliates. See the section titled Certain Relationships and Related Party TransactionsRegistration Rights for a description of these registration rights.
Registration Statement
Upon the completion of this offering, we intend to file a registration statement on Form S-8 under the Securities Act to register all of the shares of our common stock subject to equity awards outstanding or reserved for issuance under our equity compensation plans. The shares of our common stock covered by this registration statement will be eligible for sale in the public market without restriction under the Securities Act immediately upon the effectiveness of such registration statement, subject to vesting restrictions, the conditions of Rule 144 applicable to affiliates and any lock-up agreements. See the section titled Executive Compensation for a description of our equity compensation plans.
148
Table of Contents
MATERIAL U.S. FEDERAL INCOME TAX CONSIDERATIONS FOR
NON-U.S. HOLDERS OF OUR COMMON STOCK
The following is a summary of the material U.S. federal income tax considerations related to the purchase, ownership and disposition of our common stock by a non-U.S. holder (as defined below), that holds our common stock as a capital asset (generally property held for investment). This summary is based on the provisions of the Internal Revenue Code, U.S. Treasury regulations, administrative rulings and judicial decisions, all as in effect on the date hereof, and all of which are subject to change, possibly with retroactive effect. We have not sought any ruling from the Internal Revenue Service, or the IRS, with respect to the statements made and the conclusions reached in the following summary, and there can be no assurance that the IRS or a court will agree with such statements and conclusions.
This summary does not address all aspects of U.S. federal income taxation that may be relevant to non-U.S. holders in light of their personal circumstances. In addition, this summary does not address the Medicare tax on certain investment income, the alternative minimum tax, the rules regarding qualified small business stock under Section 1202 of the Code, U.S. federal estate or gift tax laws, any state, local or non-U.S. tax laws or any tax treaties. This summary also does not address tax considerations applicable to investors that may be subject to special treatment under the U.S. federal income tax laws, such as:
| | banks, insurance companies or other financial institutions; |
| | tax-exempt or governmental organizations; |
| | dealers in securities or foreign currencies; |
| | traders in securities that use the mark-to-market method of accounting for U.S. federal income tax purposes; |
| | partnerships or other pass-through entities for U.S. federal income tax purposes or holders of interests therein; |
| | persons deemed to sell our common stock under the constructive sale provisions of the Internal Revenue Code; |
| | persons that acquired our common stock through the exercise of employee stock options or otherwise as compensation or through a tax-qualified retirement plan; |
| | certain former citizens or long-term residents of the U.S.; |
| | persons that hold our common stock as part of a straddle, appreciated financial position, synthetic security, hedge, conversion transaction or other integrated investment or risk reduction transaction; and |
| | persons that own, or have owned, actually or constructively, more than 5% of our common stock. |
PROSPECTIVE INVESTORS ARE ENCOURAGED TO CONSULT THEIR TAX ADVISORS WITH RESPECT TO THE APPLICATION OF THE U.S. FEDERAL INCOME TAX LAWS TO THEIR PARTICULAR SITUATION, AS WELL AS ANY TAX CONSEQUENCES OF THE PURCHASE, OWNERSHIP AND DISPOSITION OF OUR COMMON STOCK ARISING UNDER THE U.S. FEDERAL ESTATE OR GIFT TAX LAWS OR UNDER THE LAWS OF ANY STATE, LOCAL, NON-U.S. OR OTHER TAXING JURISDICTION OR UNDER ANY APPLICABLE INCOME TAX TREATY.
Non-U.S. Holder Defined
For purposes of this discussion, a non-U.S. holder is a beneficial owner of our common stock that is not for U.S. federal income tax purposes a partnership or any of the following:
| | an individual who is a citizen or resident of the U.S.; |
149
Table of Contents
| | a corporation (or other entity treated as a corporation for U.S. federal income tax purposes) created or organized in or under the laws of the U.S., any state thereof or the District of Columbia; |
| | an estate the income of which is subject to U.S. federal income tax regardless of its source; or |
| | a trust (i) the administration of which is subject to the primary supervision of a U.S. court and which has one or more U.S. persons who have the authority to control all substantial decisions of the trust or (ii) which has made a valid election under applicable U.S. Treasury regulations to be treated as a U.S. person. |
If a partnership (including an entity or arrangement treated as a partnership for U.S. federal income tax purposes) holds our common stock, the tax treatment of a partner in the partnership generally will depend upon the status of the partner, upon the activities of the partnership and upon certain determinations made at the partner level. Accordingly, we urge partners in partnerships (including entities or arrangements treated as partnerships for U.S. federal income tax purposes) considering the purchase of our common stock to consult their tax advisors regarding the U.S. federal income tax considerations of the purchase, ownership and disposition of our common stock by such partnership.
Distributions
We do not expect to pay any distributions on our common stock in the foreseeable future. However, in the event we do make distributions of cash or other property on our common stock, such distributions will constitute dividends for U.S. federal income tax purposes to the extent paid from our current or accumulated earnings and profits, as determined under U.S. federal income tax principles. To the extent those distributions exceed our current and accumulated earnings and profits, the distributions will be treated as a non-taxable return of capital to the extent of the non-U.S. holders tax basis in our common stock and thereafter as capital gain from the sale or exchange of such common stock. See Gain on Disposition of Our Common Stock. Subject to backup withholding requirements, the withholding requirements under FATCA (as defined below) and with respect to effectively connected dividends, each of which is discussed below, any distribution made to a non-U.S. holder on our common stock generally will be subject to U.S. withholding tax at a rate of 30% of the gross amount of the distribution unless an applicable income tax treaty provides for a lower rate. To receive the benefit of a reduced treaty rate, a non-U.S. holder must provide the applicable withholding agent with an IRS Form W-8BEN or IRS Form W-8BEN-E (or other applicable or successor form) certifying qualification for the reduced rate. This certification must be provided to us or our paying agent prior to the payment of dividends and must be updated periodically. If the non-U.S. holder holds the stock through a financial institution or other agent acting on the non-U.S. holders behalf, the non-U.S. holder will be required to provide appropriate documentation to the agent, which then will be required to provide certification to us or our paying agent, either directly or through other intermediaries. Non-U.S. holders that do not timely provide the required certification, but that qualify for a reduced treaty rate, may obtain a refund of any excess amounts withheld by timely filing an appropriate claim for refund with the IRS. Non-U.S. holders are urged to consult their tax advisors regarding their entitlement to benefits under a relevant income tax treaty.
Dividends paid to a non-U.S. holder that are effectively connected with a trade or business conducted by the non-U.S. holder in the U.S. (and, if required by an applicable income tax treaty, are treated as attributable to a permanent establishment maintained by the non-U.S. holder in the U.S.) generally will be taxed on a net income basis at the rates and in the manner generally applicable to United States persons (as defined under the Internal Revenue Code). Such effectively connected dividends will not be subject to U.S. withholding tax if the non-U.S. holder satisfies certain certification
150
Table of Contents
requirements by providing the applicable withholding agent with a properly executed IRS Form W-8ECI (or other applicable or successor form) certifying eligibility for exemption. If the non-U.S. holder is a corporation for U.S. federal income tax purposes, it may also be subject to a branch profits tax (at a 30% rate or such lower rate as specified by an applicable income tax treaty) on its effectively connected earnings and profits (as adjusted for certain items), which will include effectively connected dividends.
Gain on Disposition of Our Common Stock
Subject to the discussions below under Backup Withholding and Information Reporting and Additional Withholding Requirements under FATCA, a non-U.S. holder generally will not be subject to U.S. federal income or withholding tax on any gain realized upon the sale or other disposition of our common stock unless:
| | the non-U.S. holder is an individual who is present in the U.S. for a period or periods aggregating 183 days or more during the calendar year in which the sale or disposition occurs and certain other conditions are met; |
| | the gain is effectively connected with a trade or business conducted by the non-U.S. holder in the U.S. (and, if required by an applicable income tax treaty, is attributable to a permanent establishment maintained by the non-U.S. holder in the U.S.); or |
| | our common stock constitutes a United States real property interest by reason of our status as a United States real property holding corporation, or USRPHC, for U.S. federal income tax purposes. |
A non-U.S. holder described in the first bullet point above will generally be subject to U.S. federal income tax at a rate of 30% (or such lower rate as specified by an applicable income tax treaty) on the amount of such gain, which generally may be offset by U.S. source capital losses; provided the non-U.S. holder has timely filed U.S. federal income tax returns with respect to such losses.
A non-U.S. holder whose gain is described in the second bullet point above or, subject to the exceptions described in the next paragraph, the third bullet point above, generally will be taxed on a net income basis at the rates and in the manner generally applicable to United States persons (as defined under the Internal Revenue Code) unless an applicable income tax treaty provides otherwise. If the non-U.S. holder is a corporation for U.S. federal income tax purposes whose gain is described in the second bullet point above, then such gain would also be included in its effectively connected earnings and profits (as adjusted for certain items), which may be subject to a branch profits tax (at a 30% rate or such lower rate as specified by an applicable income tax treaty).
Generally, a corporation is a USRPHC if the fair market value of its United States real property interests equals or exceeds 50% of the sum of the fair market value of its worldwide real property interests and its other assets used or held for use in a trade or business. We believe that we currently are not a USRPHC for U.S. federal income tax purposes, and we do not expect to become a USRPHC for the foreseeable future. However, in the event that we become a USRPHC, as long as our common stock is and continues to be regularly traded on an established securities market (within the meaning of the U.S. Treasury Regulations), only a non-U.S. holder that actually or constructively owns, or owned at any time during the shorter of the five-year period ending on the date of the disposition or the non-U.S. holders holding period for the common stock, more than 5% of our common stock will be taxable on gain realized on the disposition of our common stock as a result of our status as a USRPHC. If we were to become a USRPHC and our common stock were not considered to be regularly traded on an established securities market, such holder (regardless of the percentage of stock owned) would be subject to U.S. federal income tax on a taxable disposition of our common
151
Table of Contents
stock (as described in the preceding paragraph), and a 15% withholding tax would apply to the gross proceeds from such disposition.
Non-U.S. holders should consult their tax advisors with respect to the application of the foregoing rules to their ownership and disposition of our common stock.
Backup Withholding and Information Reporting
Any distributions paid to a non-U.S. holder must be reported annually to the IRS and to the non-U.S. holder. Copies of these information returns may be made available to the tax authorities in the country in which the non-U.S. holder resides or is established. Payments of dividends to a non-U.S. holder generally will not be subject to backup withholding if the non-U.S. holder establishes an exemption by properly certifying its non-U.S. status on an IRS Form W-8BEN or IRS Form W-8BEN-E (or other applicable or successor form).
Payments of the proceeds from a sale or other disposition by a non-U.S. holder of our common stock effected by or through a U.S. office of a broker generally will be subject to information reporting and backup withholding (at the applicable rate) unless the non-U.S. holder establishes an exemption by properly certifying its non-U.S. status on an IRS Form W-8BEN or IRS Form W-8BEN-E (or other applicable or successor form) and certain other conditions are met. Information reporting and backup withholding generally will not apply to any payment of the proceeds from a sale or other disposition of our common stock effected outside the U.S. by a non-U.S. office of a broker. However, sales or other dispositions of our common stock effected outside the U.S. by such a broker if it has certain relationships within the U.S. will result in information reporting and backup withholding unless such broker has documentary evidence in its records that the non-U.S. holder is not a United States person and certain other conditions are met, or the non-U.S. holder otherwise establishes an exemption.
Backup withholding is not an additional tax. Rather, the U.S. federal income tax liability (if any) of persons subject to backup withholding will be reduced by the amount of tax withheld. If backup withholding results in an overpayment of taxes, a refund may be obtained, provided that the required information is timely furnished to the IRS.
Additional Withholding Requirements under FATCA
Sections 1471 through 1474 of the Internal Revenue Code, and the U.S. Treasury regulations and administrative guidance issued thereunder, or FATCA, generally impose a 30% withholding tax on any dividends paid on common stock and subject to the discussion of certain proposed Treasury Regulations below, on the gross proceeds from a disposition of common stock (if such disposition occurs after December 31, 2018), in each case if paid to a foreign financial institution or a non-financial foreign entity (each as defined in the Internal Revenue Code) (including, in some cases, when such foreign financial institution or non-financial foreign entity is acting as an intermediary), unless (i) in the case of a foreign financial institution, such institution enters into an agreement with the U.S. government to withhold on certain payments, and to collect and provide to the U.S. tax authorities substantial information regarding U.S. account holders of such institution (which includes certain equity and debt holders of such institution, as well as certain account holders that are non-U.S. entities with U.S. owners), (ii) in the case of a non-financial foreign entity, such entity certifies that it does not have any substantial United States owners (as defined in the Internal Revenue Code) or provides the applicable withholding agent with a certification identifying the direct and indirect substantial United States owners of the entity (in either case, generally on an IRS Form W-8BEN-E), or (iii) the foreign financial institution or non-financial foreign entity otherwise qualifies for an exemption from these rules and provides appropriate documentation (such as an IRS Form W-8BEN-E). Withholding under FATCA
152
Table of Contents
generally applies to payments of dividends on our common stock. While withholding under FATCA may apply to payments of gross proceeds from a sale or other disposition of our common stock, under recently proposed U.S. Treasury Regulations, withholding on payments of gross proceeds is not required. Although such regulations are not final, applicable withholding agents may rely on the proposed regulations until final regulations are issued. Foreign financial institutions located in jurisdictions that have an intergovernmental agreement with the U.S. governing these rules may be subject to different rules. Under certain circumstances, a holder might be eligible for refunds or credits of such taxes. Non-U.S. holders are encouraged to consult their own tax advisors regarding the effects of FATCA on an investment in our common stock.
INVESTORS CONSIDERING THE PURCHASE OF OUR COMMON STOCK ARE URGED TO CONSULT THEIR OWN TAX ADVISORS REGARDING THE APPLICATION OF THE U.S. FEDERAL INCOME TAX LAWS TO THEIR PARTICULAR SITUATIONS AND THE APPLICABILITY AND EFFECT OF U.S. FEDERAL ESTATE AND GIFT TAX LAWS AND ANY STATE, LOCAL OR NON-U.S. TAX LAWS AND TAX TREATIES.
153
Table of Contents
We and the underwriters named below have entered into an underwriting agreement with respect to the shares being offered. Subject to certain conditions, each underwriter has severally agreed to purchase the number of shares indicated in the following table. Goldman Sachs & Co. LLC, J.P. Morgan Securities LLC and Citigroup Global Markets Inc. are the representatives of the underwriters.
| Underwriters |
Number of Shares | |||
| Goldman Sachs & Co. LLC |
||||
| J.P. Morgan Securities LLC |
||||
| Citigroup Global Markets Inc. |
||||
| Barclays Capital Inc. |
||||
| Jefferies LLC |
||||
| RBC Capital Markets, LLC |
||||
| UBS Securities LLC |
||||
| KeyBanc Capital Markets Inc. |
||||
| William Blair & Company, L.L.C. |
||||
| Canaccord Genuity LLC |
||||
| JMP Securities LLC |
||||
| Macquarie Capital (USA) Inc. |
||||
| Piper Jaffray & Co. |
||||
|
|
|
|||
| Total |
||||
|
|
|
|||
The underwriters are committed to take and pay for all of the shares being offered, if any are taken, other than the shares covered by the option described below unless and until this option is exercised.
The underwriters have an option to buy up to an additional shares from us to cover sales by the underwriters of a greater number of shares than the total number set forth in the table above. They may exercise that option for 30 days. If any shares are purchased pursuant to this option, the underwriters will severally purchase shares in approximately the same proportion as set forth in the table above.
The following table shows the per share and total underwriting discounts and commissions to be paid to the underwriters by us. Such amounts are shown assuming both no exercise and full exercise of the underwriters option to purchase additional shares.
| Paid by the Company |
||||||||
| No Exercise | Full Exercise | |||||||
| Per Share |
$ | $ | ||||||
| Total |
$ | $ | ||||||
Shares sold by the underwriters to the public will initially be offered at the initial public offering price set forth on the cover of this prospectus. Any shares sold by the underwriters to securities dealers may be sold at a discount of up to $ per share from the initial public offering price. After the initial offering of the shares, the representatives may change the offering price and the other selling terms. The offering of the shares by the underwriters is subject to receipt and acceptance and subject to the underwriters right to reject any order in whole or in part.
We, our officers, directors, and holders of substantially all of our common stock have agreed with the underwriters, subject to certain exceptions, not to dispose of or hedge any of their common stock or
154
Table of Contents
securities convertible into or exchangeable for shares of common stock during the period from the date of this prospectus continuing through the date 180 days after the date of this prospectus, except with the prior written consent of Goldman Sachs & Co. LLC and J.P. Morgan Securities LLC. This agreement does not apply to any existing employee benefit plans. See Shares Eligible for Future Sale for a discussion of certain transfer restrictions.
Prior to this offering, there has been no public market for the shares. The initial public offering price has been negotiated among us and the representatives. Among the factors to be considered in determining the initial public offering price of the shares, in addition to prevailing market conditions, will be our historical performance, estimates of our business potential and earnings prospects, an assessment of our management and the consideration of the above factors in relation to market valuation of companies in related businesses.
We intend to apply to list the common stock on the New York Stock Exchange under the symbol DT.
In connection with the offering, the underwriters may purchase and sell shares of common stock in the open market. These transactions may include short sales, stabilizing transactions and purchases to cover positions created by short sales. Short sales involve the sale by the underwriters of a greater number of shares than they are required to purchase in the offering, and a short position represents the amount of such sales that have not been covered by subsequent purchases. A covered short position is a short position that is not greater than the amount of additional shares for which the underwriters option described above may be exercised. The underwriters may cover any covered short position by either exercising their option to purchase additional shares or purchasing shares in the open market. In determining the source of shares to cover the covered short position, the underwriters will consider, among other things, the price of shares available for purchase in the open market as compared to the price at which they may purchase additional shares pursuant to the option described above. Naked short sales are any short sales that create a short position greater than the amount of additional shares for which the option described above may be exercised. The underwriters must cover any such naked short position by purchasing shares in the open market. A naked short position is more likely to be created if the underwriters are concerned that there may be downward pressure on the price of the common stock in the open market after pricing that could adversely affect investors who purchase in the offering. Stabilizing transactions consist of various bids for or purchases of common stock made by the underwriters in the open market prior to the completion of the offering.
The underwriters may also impose a penalty bid. This occurs when a particular underwriter repays to the underwriters a portion of the underwriting discount received by it because the representatives have repurchased shares sold by or for the account of such underwriter in stabilizing or short covering transactions.
Purchases to cover a short position and stabilizing transactions, as well as other purchases by the underwriters for their own accounts, may have the effect of preventing or retarding a decline in the market price of our common stock, and together with the imposition of the penalty bid, may stabilize, maintain or otherwise affect the market price of the common stock. As a result, the price of the common stock may be higher than the price that otherwise might exist in the open market. The underwriters are not required to engage in these activities and may end any of these activities at any time. These transactions may be effected on the New York Stock Exchange, in the over-the-counter market or otherwise.
We estimate that our share of the total expenses of the offering, excluding underwriting discounts and commissions, will be approximately $ .
155
Table of Contents
We have agreed to indemnify the several underwriters against certain liabilities, including liabilities under the Securities Act of 1933.
The underwriters and their respective affiliates are full service financial institutions engaged in various activities, which may include sales and trading, commercial and investment banking, advisory, investment management, investment research, principal investment, hedging, market making, brokerage and other financial and non-financial activities and services. Certain of the underwriters and their respective affiliates have provided, and may in the future provide, a variety of these services to us and to persons and entities with relationships with us, for which they received or will receive customary fees and expenses. In August 2018, we entered into a credit facility with affiliates of Goldman Sachs & Co. LLC, J.P. Morgan Securities LLC and Jefferies LLC, under which these underwriters and their respective affiliates have been, and may be in the future, paid customary fees. For additional information on our credit facility, see the sections titled Managements Discussion and Analysis of Financial Condition and Results of OperationsLiquidity and Capital Resources and Description of Indebtedness.
In the ordinary course of their various business activities, the underwriters and their respective affiliates, officers, directors and employees may purchase, sell or hold a broad array of investments and actively trade securities, derivatives, loans, commodities, currencies, credit default swaps and other financial instruments for their own account and for the accounts of their customers, and such investment and trading activities may involve or relate to assets, securities and/or instruments of the issuer (directly, as collateral securing other obligations or otherwise) and/or persons and entities with relationships with the issuer. The underwriters and their respective affiliates may also communicate independent investment recommendations, market color or trading ideas and/or publish or express independent research views in respect of such assets, securities or instruments and may at any time hold, or recommend to clients that they should acquire, long and/or short positions in such assets, securities and instruments.
European Economic Area
In relation to each Member State of the European Economic Area which has implemented the Prospectus Directive (each, a Relevant Member State) an offer to the public of our common stock may not be made in that Relevant Member State, except that an offer to the public in that Relevant Member State of our common stock may be made at any time under the following exemptions under the Prospectus Directive:
| | To any legal entity which is a qualified investor as defined in the Prospectus Directive; |
| | To fewer than 150 natural or legal persons (other than qualified investors as defined in the Prospectus Directive), subject to obtaining the prior consent of the representatives for any such offer; or |
| | In any other circumstances falling within Article 3(2) of the Prospectus Directive; |
provided that no such offer or shares of our common stock shall require us or any underwriter to publish a prospectus pursuant to Article 3 of the Prospectus Directive.
For the purposes of this provision, the expression an offer to the public in relation to any shares of our common stock in any Relevant Member State means the communication in any form and by any means of sufficient information on the terms of the offer and our common stock to be offered so as to enable an investor to decide to purchase shares of our common stock, as the same may be varied in that Member State by any measure implementing the Prospectus Directive in that Relevant Member State. The expression Prospectus Directive means Directive 2003/71/EC (as amended, including by Directive 2010/73/EU and Regulation (EU) 2017/1129), and includes any relevant implementing measure in the Relevant Member State.
156
Table of Contents
United Kingdom
In the United Kingdom, this prospectus is being directed only at persons who are qualified investors who are (i) investment professionals falling within Article 19(5) of the Financial Services and Markets Act 2000 (Financial Promotion) Order 2005 (the Order); or (ii) high net worth entities and other persons to whom it may lawfully be communicated, falling within Article 49(2)(a) to (d) of the Order (all such persons together being referred to as relevant persons). Any investment or investment activity to which this prospectus relates is available only to relevant persons and will only be engaged with relevant persons. Any person in the United Kingdom who is not a relevant person should not act or rely on this prospectus or any of its contents.
Canada
The shares of common stock may be sold in Canada only to purchasers purchasing, or deemed to be purchasing, as principal that are accredited investors, as defined in National Instrument 45-106 Prospectus Exemptions or subsection 73.3(1) of the Securities Act (Ontario), and are permitted clients, as defined in National Instrument 31-103 Registration Requirements, Exemptions, and Ongoing Registrant Obligations. Any resale of the shares of common stock must be made in accordance with an exemption form, or in a transaction not subject to, the prospectus requirements of applicable securities laws.
Securities legislation in certain provinces or territories of Canada may provide a purchaser with remedies for rescission or damages if this prospectus (including any amendment thereto) contains a misrepresentation, provided that the remedies for rescission or damages are exercised by the purchaser within the time limit prescribed by the securities legislation of the purchasers province or territory. The purchaser should refer to any applicable provisions of the securities legislation of the purchasers province or territory of these rights or consult with a legal advisor.
Pursuant to section 3A.3 of National Instrument 33-105 Underwriting Conflicts (NI 33-105), the underwriters are not required to comply with the disclosure requirements of NI 33-105 regarding underwriter conflicts of interest in connection with this offering.
Hong Kong
The shares of common stock may not be offered or sold in Hong Kong by means of any document other than (i) in circumstances which do not constitute an offer to the public within the meaning of the Companies (Winding Up and Miscellaneous Provisions) Ordinance (Cap. 32 of the Laws of Hong Kong) (Companies (Winding Up and Miscellaneous Provisions) Ordinance) or which do not constitute an invitation to the public within the meaning of the Securities and Futures Ordinance (Cap. 571 of the Laws of Hong Kong) (Securities and Futures Ordinance), or (ii) to professional investors as defined in the Securities and Futures Ordinance and any rules made thereunder, or (iii) in other circumstances which do not result in the document being a prospectus as defined in the Companies (Winding Up and Miscellaneous Provisions) Ordinance, and no advertisement, invitation or document relating to the shares of common stock may be issued or may be in the possession of any person for the purpose of issue (in each case whether in Hong Kong or elsewhere), which is directed at, or the contents of which are likely to be accessed or read by, the public in Hong Kong (except if permitted to do so under the securities laws of Hong Kong) other than with respect to shares of common stock which are or are intended to be disposed of only to persons outside Hong Kong or only to professional investors in Hong Kong as defined in the Securities and Futures Ordinance and any rules made thereunder.
Singapore
This prospectus has not been registered as a prospectus with the Monetary Authority of Singapore. Accordingly, this prospectus and any other document or material in connection with the
157
Table of Contents
offer or sale, or invitation for subscription or purchase, of the shares may not be circulated or distributed, nor may the shares be offered or sold, or be made the subject of an invitation for subscription or purchase, whether directly or indirectly, to persons in Singapore other than (i) to an institutional investor (as defined under Section 4A of the Securities and Futures Act, Chapter 289 of Singapore (the SFA)) under Section 274 of the SFA, (ii) to a relevant person (as defined in Section 275(2) of the SFA) pursuant to Section 275(1) of the SFA, or any person pursuant to Section 275(1A) of the SFA, and in accordance with the conditions specified in Section 275 of the SFA or (iii) otherwise pursuant to, and in accordance with the conditions of, any other applicable provision of the SFA, in each case subject to conditions set forth in the SFA.
Where the shares of common stock are subscribed or purchased under Section 275 of the SFA by a relevant person that is a corporation (which is not an accredited investor (as defined in Section 4A of the SFA)) the sole business of which is to hold investments and the entire share capital of which is owned by one or more individuals, each of whom is an accredited investor, the securities (as defined in Section 239(1) of the SFA) of that corporation shall not be transferable for 6 months after that corporation has acquired the shares under Section 275 of the SFA except: (1) to an institutional investor under Section 274 of the SFA or to a relevant person (as defined in Section 275(2) of the SFA), (2) where such transfer arises from an offer in that corporations securities pursuant to Section 275(1A) of the SFA, (3) where no consideration is or will be given for the transfer, (4) where the transfer is by operation of law, (5) as specified in Section 276(7) of the SFA, or (6) as specified in Regulation 32 of the Securities and Futures (Offers of Investments) (Shares and Debentures) Regulations 2005 of Singapore (Regulation 32)
Where the shares of common stock are subscribed or purchased under Section 275 of the SFA by a relevant person that is a trust (where the trustee is not an accredited investor (as defined in Section 4A of the SFA)) whose sole purpose is to hold investments and each beneficiary of the trust is an accredited investor, the beneficiaries rights and interest (howsoever described) in that trust shall not be transferable for 6 months after that trust has acquired the shares under Section 275 of the SFA except: (1) to an institutional investor under Section 274 of the SFA or to a relevant person (as defined in Section 275(2) of the SFA), (2) where such transfer arises from an offer that is made on terms that such rights or interest are acquired at a consideration of not less than $200,000 (or its equivalent in a foreign currency) for each transaction (whether such amount is to be paid for in cash or by exchange of securities or other assets), (3) where no consideration is or will be given for the transfer, (4) where the transfer is by operation of law, (5) as specified in Section 276(7) of the SFA, or (6) as specified in Regulation 32.
Singapore Securities and Futures Act Product Classification Solely for the purposes of its obligations pursuant to Sections 309B(1)(a) and 309B(1)(c) of the SFA, the Company has determined, and hereby notifies all relevant persons (as defined in Section 309A of the SFA) that the common shares are prescribed capital markets products (as defined in the Securities and Futures (Capital Markets Products) Regulations 2018) and Excluded Investment Products (as defined in MAS Notice SFA 04-N12: Notice of the Sale of Investment products and MAS Notice FAA-N16: Notice on Recommendations on Investment Products).
Japan
The securities have not been and will not be registered under the Financial Instruments and Exchange Act of Japan (Act No. 25 of 1948, as amended), or the FIEA. The securities may not be offered or sold, directly or indirectly, in Japan or to or for the benefit of any resident of Japan (including any person resident in Japan or any corporation or other entity organized under the laws of Japan) or to others for reoffering or resale, directly or indirectly, in Japan or to or for the benefit of any resident of Japan, except pursuant to an exemption from the registration requirements of the FIEA and otherwise in compliance with any relevant laws and regulations of Japan.
158
Table of Contents
The validity of our common stock offered by this prospectus will be passed upon for us by Goodwin Procter LLP, Boston, Massachusetts. Certain legal matters in connection with this offering will be passed upon for the underwriters by Wilmer Cutler Pickering Hale and Dorr LLP, Boston, Massachusetts.
The consolidated financial statements as of March 31, 2018 and 2019 and for each of the three years in the period ended March 31, 2019 included in this Prospectus and in the Registration Statement have been so included in reliance on the report of BDO USA LLP, an independent registered public accounting firm, appearing elsewhere herein and in the Registration Statement, given on the authority of said firm as experts in auditing and accounting.
WHERE YOU CAN FIND ADDITIONAL INFORMATION
We have filed with the SEC a registration statement on Form S-1 under the Securities Act with respect to the shares of our common stock offered by this prospectus. This prospectus, which constitutes a part of the registration statement, does not contain all of the information set forth in the registration statement, some of which is contained in exhibits to the registration statement as permitted by the rules and regulations of the SEC. For further information with respect to us and our common stock, we refer you to the registration statement, including the exhibits filed as a part of the registration statement. Statements contained in this prospectus concerning the contents of any contract or any other document is not necessarily complete. If a contract or document has been filed as an exhibit to the registration statement, please see the copy of the contract or document that has been filed. Each statement in this prospectus relating to a contract or document filed as an exhibit is qualified in all respects by the filed exhibit. The SEC maintains an Internet website that contains reports, proxy statements and other information about issuers, like us, that file electronically with the SEC. The address of that website is www.sec.gov.
As a result of this offering, we will become subject to the information and reporting requirements of the Exchange Act and, in accordance with this law, will file periodic reports, proxy statements and other information with the SEC. These periodic reports, proxy statements and other information will be available for inspection and copying at the SECs public reference facilities and the website of the SEC referred to above. We also maintain a website at www.dynatrace.com. Upon the completion of this offering, you may access these materials free of charge as soon as reasonably practicable after they are electronically filed with, or furnished to, the SEC. Information contained on our website is not a part of this prospectus, and the inclusion of our website address in this prospectus is an inactive textual reference only.
159
Table of Contents
Table of Contents
After the reorganization transactions discussed in Note 2 to the Companys consolidated financial statements are effected, we expect to be in a position to render the following audit report.
/s/ BDO USA, LLP
Troy, Michigan
May 31, 2019
Report of Independent Registered Public Accounting Firm
Shareholders and Board of Directors
Dynatrace, Inc.
Waltham, Massachusetts
Opinion on the Financial Statements
We have audited the accompanying consolidated balance sheets of Dynatrace, Inc. (the Company) and subsidiaries as of March 31, 2018 and 2019, the related consolidated statements of operations, comprehensive income (loss), members deficit and cash flows for each of the three years in the period ended March 31, 2019, and the related notes (collectively referred to as the consolidated financial statements). In our opinion, the consolidated financial statements present fairly, in all material respects, the financial position of the Company and subsidiaries at March 31, 2018 and 2019, and the results of their operations and their cash flows for each of the three years in the period ended March 31, 2019, in conformity with accounting principles generally accepted in the United States of America.
Change in Accounting Principle
As discussed in Note 2 to the consolidated financial statements, the Company has changed its method of accounting for revenue from contracts with customers in fiscal year 2019 due to the adoption of the new revenue standard. The Company adopted the standard using the full retrospective approach.
Basis for Opinion
These consolidated financial statements are the responsibility of the Companys management. Our responsibility is to express an opinion on the Companys consolidated financial statements based on our audits. We are a public accounting firm registered with the Public Company Accounting Oversight Board (United States) (PCAOB) and are required to be independent with respect to the Company in accordance with the U.S. federal securities laws and the applicable rules and regulations of the Securities and Exchange Commission and the PCAOB.
We conducted our audits in accordance with the standards of the PCAOB. Those standards require that we plan and perform the audit to obtain reasonable assurance about whether the consolidated financial statements are free of material misstatement, whether due to error or fraud. The Company is not required to have, nor were we engaged to perform, an audit of its internal control over financial reporting. As part of our audits we are required to obtain an understanding of internal control over financial reporting but not for the purpose of expressing an opinion on the effectiveness of the Companys internal control over financial reporting. Accordingly, we express no such opinion.
F-2
Table of Contents
Our audits included performing procedures to assess the risks of material misstatement of the consolidated financial statements, whether due to error or fraud, and performing procedures that respond to those risks. Such procedures included examining, on a test basis, evidence regarding the amounts and disclosures in the consolidated financial statements. Our audits also included evaluating the accounting principles used and significant estimates made by management, as well as evaluating the overall presentation of the consolidated financial statements. We believe that our audits provide a reasonable basis for our opinion.
We have served as the Companys auditor since 2015.
Troy, Michigan
____________, 2019
F-3
Table of Contents
CONSOLIDATED BALANCE SHEETS
(In thousands)
| March 31, | ||||||||
| 2018 | 2019 | |||||||
| Assets |
||||||||
| Current assets: |
||||||||
| Cash and cash equivalents |
$ | 77,581 | $ | 51,314 | ||||
| Accounts receivable, net |
136,476 | 115,431 | ||||||
| Deferred commissions, current |
18,763 | 27,705 | ||||||
| Prepaid expenses and other current assets |
11,603 | 18,768 | ||||||
|
|
|
|
|
|||||
| Total current assets |
244,423 | 213,218 | ||||||
|
|
|
|
|
|||||
| Property and equipment, net |
18,478 | 17,925 | ||||||
| Goodwill |
1,270,937 | 1,270,120 | ||||||
| Other intangible assets, net |
330,115 | 259,123 | ||||||
| Deferred tax assets, net |
9,850 | 10,678 | ||||||
| Deferred commissions, non-current |
20,519 | 31,545 | ||||||
| Other assets |
4,680 | 8,757 | ||||||
|
|
|
|
|
|||||
| Total assets |
$ | 1,899,002 | $ | 1,811,366 | ||||
|
|
|
|
|
|||||
| Liabilities and members deficit |
||||||||
| Current liabilities: |
||||||||
| Accounts payable |
$ | 3,165 | $ | 6,559 | ||||
| Accrued expenses, current |
58,432 | 64,920 | ||||||
| Current portion of long term debt |
| 9,500 | ||||||
| Deferred revenue, current |
194,019 | 272,772 | ||||||
| Payable to related party |
1,747,363 | 597,150 | ||||||
|
|
|
|
|
|||||
| Total current liabilities |
2,002,979 | 950,901 | ||||||
|
|
|
|
|
|||||
| Deferred revenue, non-current |
52,608 | 92,973 | ||||||
| Accrued expenses, non-current |
31,910 | 98,359 | ||||||
| Deferred tax liabilities, net |
80,195 | 47,598 | ||||||
| Long-term debt, net of current portion |
| 1,011,793 | ||||||
|
|
|
|
|
|||||
| Total liabilities |
2,167,692 | 2,201,624 | ||||||
|
|
|
|
|
|||||
| Commitments and Contingencies (Note 11) |
||||||||
| Members deficit: |
||||||||
| Common units, no par value - 100 units authorized, issued and outstanding |
| | ||||||
| Additional paid-in capital |
(183,084 | ) | (184,546 | ) | ||||
| Accumulated deficit |
(59,808 | ) | (176,002 | ) | ||||
| Accumulated other comprehensive (loss) |
(25,798 | ) | (29,710 | ) | ||||
|
|
|
|
|
|||||
| Total members deficit |
(268,690 | ) | (390,258 | ) | ||||
|
|
|
|
|
|||||
| Total liabilities and members deficit |
$ | 1,899,002 | $ | 1,811,366 | ||||
|
|
|
|
|
|||||
See accompanying notes to consolidated financial statements
F-4
Table of Contents
CONSOLIDATED STATEMENTS OF OPERATIONS
(In thousands, except per share data)
| Fiscal Year Ended March 31, | ||||||||||||
| 2017 | 2018 | 2019 | ||||||||||
| Revenues: |
||||||||||||
| Subscriptions |
$ | 232,783 | $ | 257,576 | $ | 349,830 | ||||||
| License |
130,738 | 98,756 | 40,354 | |||||||||
| Services |
42,856 | 41,715 | 40,782 | |||||||||
|
|
|
|
|
|
|
|||||||
| Total revenue |
406,377 | 398,047 | 430,966 | |||||||||
|
|
|
|
|
|
|
|||||||
| Cost of revenues: |
||||||||||||
| Cost of subscriptions |
52,176 | 48,270 | 56,934 | |||||||||
| Cost of services |
30,735 | 30,316 | 31,529 | |||||||||
| Amortization of acquired technology |
19,261 | 17,948 | 18,338 | |||||||||
|
|
|
|
|
|
|
|||||||
| Total cost of revenues |
102,172 | 96,534 | 106,801 | |||||||||
|
|
|
|
|
|
|
|||||||
| Gross profit |
304,205 | 301,513 | 324,165 | |||||||||
|
|
|
|
|
|
|
|||||||
| Operating expenses: |
||||||||||||
| Research and development |
52,885 | 58,320 | 76,759 | |||||||||
| Sales and marketing |
129,971 | 145,350 | 178,886 | |||||||||
| General and administrative |
49,232 | 64,114 | 91,778 | |||||||||
| Amortization of other intangibles |
51,947 | 50,498 | 47,686 | |||||||||
| Restructuring and other |
7,637 | 4,990 | 1,763 | |||||||||
|
|
|
|
|
|
|
|||||||
| Total operating expenses |
291,672 | 323,272 | 396,872 | |||||||||
|
|
|
|
|
|
|
|||||||
| Income (loss) from operations |
12,533 | (21,759 | ) | (72,707 | ) | |||||||
| Interest expense, net |
(25,481 | ) | (35,220 | ) | (69,845 | ) | ||||||
| Other, net |
(3,445 | ) | 5,204 | 2,641 | ||||||||
|
|
|
|
|
|
|
|||||||
| Loss before income taxes |
(16,393 | ) | (51,775 | ) | (139,911 | ) | ||||||
| Income tax benefit |
17,189 | 60,997 | 23,717 | |||||||||
|
|
|
|
|
|
|
|||||||
| Net income (loss) |
$ | 796 | $ | 9,222 | $ | (116,194 | ) | |||||
|
|
|
|
|
|
|
|||||||
| Net income (loss) per share, basic and diluted |
$ | $ | $ | |||||||||
| Weighted average shares used in computing net income (loss) per share, basic and diluted |
||||||||||||
| Pro forma net income (loss) per share, basic and diluted |
||||||||||||
| Weighted average shares used in computing pro forma net income (loss) per share, basic and diluted (unaudited) |
||||||||||||
See accompanying notes to consolidated financial statements
F-5
Table of Contents
CONSOLIDATED STATEMENTS OF COMPREHENSIVE INCOME (LOSS)
(In thousands)
| Fiscal Year Ended March 31, | ||||||||||||
| 2017 | 2018 | 2019 | ||||||||||
| Net income (loss) |
$ | 796 | $ | 9,222 | $ | (116,194 | ) | |||||
| Other comprehensive income (loss) |
||||||||||||
| Foreign currency translation adjustment |
719 | (8,680 | ) | (3,912 | ) | |||||||
|
|
|
|
|
|
|
|||||||
| Total other comprehensive income (loss) |
719 | (8,680 | ) | (3,912 | ) | |||||||
|
|
|
|
|
|
|
|||||||
| Comprehensive income (loss) |
$ | 1,515 | $ | 542 | $ | (120,106 | ) | |||||
|
|
|
|
|
|
|
|||||||
See accompanying notes to consolidated financial statements
F-6
Table of Contents
CONSOLIDATED STATEMENTS OF MEMBERS DEFICIT
(In thousands)
| Common Units |
Additional Paid- In Capital |
Accumulated Deficit |
Accumulated Other Comprehensive Loss |
Total Members Deficit |
||||||||||||||||||||
| Units | Amount | |||||||||||||||||||||||
| Balance, March 31, 2016 |
100 | $ | | $ | (164,550 | ) | $ | (69,826 | ) | $ | (17,837 | ) | $ | (252,213 | ) | |||||||||
| Foreign currency translation, net of tax |
719 | 719 | ||||||||||||||||||||||
| Transfers to related parties |
(13,521 | ) | (13,521 | ) | ||||||||||||||||||||
| Equity repurchases |
(287 | ) | (287 | ) | ||||||||||||||||||||
| Net income |
796 | 796 | ||||||||||||||||||||||
|
|
|
|
|
|
|
|
|
|
|
|
|
|||||||||||||
| Balance, March 31, 2017 |
100 | $ | | $ | (178,358 | ) | $ | (69,030 | ) | $ | (17,118 | ) | $ | (264,506 | ) | |||||||||
|
|
|
|
|
|
|
|
|
|
|
|
|
|||||||||||||
| Foreign currency translation, net of tax |
(8,680 | ) | (8,680 | ) | ||||||||||||||||||||
| Transfers to related parties |
(3,920 | ) | (3,920 | ) | ||||||||||||||||||||
| Equity repurchases |
(806 | ) | (806 | ) | ||||||||||||||||||||
| Net income |
9,222 | 9,222 | ||||||||||||||||||||||
|
|
|
|
|
|
|
|
|
|
|
|
|
|||||||||||||
| Balance, March 31, 2018 |
100 | $ | | $ | (183,084 | ) | $ | (59,808 | ) | $ | (25,798 | ) | $ | (268,690 | ) | |||||||||
|
|
|
|
|
|
|
|
|
|
|
|
|
|||||||||||||
| Foreign currency translation, net of tax |
(3,912 | ) | (3,912 | ) | ||||||||||||||||||||
| Transfers to related parties |
(813 | ) | (813 | ) | ||||||||||||||||||||
| Equity repurchases |
(649 | ) | (649 | ) | ||||||||||||||||||||
| Net loss |
(116,194 | ) | (116,194 | ) | ||||||||||||||||||||
|
|
|
|
|
|
|
|
|
|
|
|
|
|||||||||||||
| Balance, March 31, 2019 |
100 | $ | | $ | (184,546 | ) | $ | (176,002 | ) | $ | (29,710 | ) | $ | (390,258 | ) | |||||||||
|
|
|
|
|
|
|
|
|
|
|
|
|
|||||||||||||
See accompanying notes to consolidated financial statements
F-7
Table of Contents
CONSOLIDATED STATEMENTS OF CASH FLOWS
(In thousands)
| Fiscal Year Ended March 31, | ||||||||||||
| 2017 | 2018 | 2019 | ||||||||||
| Cash flows from operating activities: |
||||||||||||
| Net income (loss) |
$ | 796 | $ | 9,222 | $ | (116,194 | ) | |||||
| Adjustments to reconcile net income (loss) to cash provided by operations: |
||||||||||||
| Depreciation |
11,067 | 8,783 | 7,319 | |||||||||
| Amortization |
73,852 | 73,455 | 72,792 | |||||||||
| Share-based compensation |
349 | 22,294 | 71,151 | |||||||||
| Deferred income taxes |
(28,408 | ) | (73,196 | ) | (34,214 | ) | ||||||
| Other |
1,825 | 400 | 1,501 | |||||||||
| Net change in operating assets and liabilities: |
||||||||||||
| Accounts receivable |
10,577 | (14,727 | ) | 17,979 | ||||||||
| Deferred commissions |
(5,823 | ) | (14,062 | ) | (19,968 | ) | ||||||
| Prepaid expenses and other assets |
(943 | ) | 1,996 | (12,658 | ) | |||||||
| Accounts payable and accrued expenses |
9,687 | 26,797 | 32,403 | |||||||||
| Deferred revenue |
21,581 | 77,876 | 127,030 | |||||||||
|
|
|
|
|
|
|
|||||||
| Net cash provided by operating activities |
94,560 | 118,838 | 147,141 | |||||||||
|
|
|
|
|
|
|
|||||||
| Cash flows from investing activities: |
||||||||||||
| Purchase of property and equipment |
(8,660 | ) | (11,606 | ) | (7,377 | ) | ||||||
| Capitalized software additions |
(5,216 | ) | (3,623 | ) | (1,873 | ) | ||||||
| Acquisitions, net of cash acquired |
| (11,302 | ) | | ||||||||
|
|
|
|
|
|
|
|||||||
| Net cash used in investing activities |
(13,876 | ) | (26,531 | ) | (9,250 | ) | ||||||
|
|
|
|
|
|
|
|||||||
| Cash flows from financing activities: |
||||||||||||
| Proceeds from term loan |
| | 1,120,000 | |||||||||
| Debt issuance costs |
| | (16,288 | ) | ||||||||
| Repayment of Term Loans |
| | (83,871 | ) | ||||||||
| Payments to related parties |
(62,732 | ) | (74,616 | ) | (1,177,021 | ) | ||||||
| Equity repurchases |
(287 | ) | (885 | ) | (649 | ) | ||||||
| Installments related to acquisition |
| | (3,653 | ) | ||||||||
|
|
|
|
|
|
|
|||||||
| Net cash used in financing activities |
(63,019 | ) | (75,501 | ) | (161,482 | ) | ||||||
|
|
|
|
|
|
|
|||||||
| Effect of exchange rates on cash and cash equivalents |
(1,338 | ) | 2,827 | (2,676 | ) | |||||||
| Net increase (decrease) in cash and cash equivalents |
16,327 | 19,633 | (26,267 | ) | ||||||||
| Cash and cash equivalents, beginning of year |
41,621 | 57,948 | 77,581 | |||||||||
|
|
|
|
|
|
|
|||||||
| Cash and cash equivalents, end of year |
$ | 57,948 | $ | 77,581 | $ | 51,314 | ||||||
|
|
|
|
|
|
|
|||||||
| Supplemental cash flow data: |
||||||||||||
| Cash paid for interest |
$ | 163 | $ | 38 | $ | 40,969 | ||||||
| Cash paid for tax |
$ | 8,907 | $ | 12,906 | $ | 5,928 | ||||||
| Noncash investing and financing activities: |
||||||||||||
| Installments due related to acquisition |
$ | | $ | 8,488 | $ | | ||||||
| Asset transfer to related party |
$ | (2,274 | ) | $ | | $ | | |||||
| Transactions with related parties |
$ | 25,638 | $ | 35,168 | $ | 14,263 | ||||||
See accompanying notes to consolidated financial statements
F-8
Table of Contents
NOTES TO CONSOLIDATED FINANCIAL STATEMENTS
| 1. | Description of the Business |
Business
Dynatrace (Dynatrace, or the Company) offers a software intelligence platform, purpose-built for the enterprise cloud. As enterprises embrace the cloud as the means for digital transformation, the Companys all-in-one intelligence platform addresses the growing complexity that technology and digital business teams face. The Companys platform does so by utilizing artificial intelligence and advanced automation to provide answers, not just data, about the performance of applications, the underlying hybrid cloud infrastructure, and the experience of our customers users. The Company designed our software intelligence platform to allow our customers to modernize and automate IT operations, develop and release higher quality software faster, and deliver superior user experiences.
Thoma Bravo, a private equity investment firm, completed its acquisition of Compuware Corporation on December 15, 2014. Following the acquisition, Compuware Corporation was restructured following which Compuware Parent, LLC became the owner of Dynatrace Holding Corporation (DHC), under which the Compuware and Dynatrace businesses were separated, establishing Dynatrace as a standalone business. Following the corporate reorganization described below, Dynatrace became wholly owned by Dynatrace, Inc. (formerly Dynatrace Holdings LLC).
Fiscal year
The Companys fiscal year ends on March 31. References to Fiscal 2019, for example, refer to the fiscal year ended March 31, 2019.
| 2. | Significant Accounting Policies |
Basis of presentation and consolidation
Prior to , 2019, Dynatrace Holdings LLC, a Delaware limited liability company, was an indirect equity holder of DHC that indirectly and wholly owned Dynatrace, LLC. On , 2019, Dynatrace Holdings LLC (i) converted into a Delaware corporation with the name Dynatrace, Inc. and (ii) through a series of corporate reorganization steps, became the parent company of DHC. Additionally, as part of the reorganization, two wholly owned subsidiaries of DHC, Compuware Corporation and SIGOS LLC, were spun-out from the corporate structure to the DHC shareholders. As a result of these transactions, DHC is a wholly owned indirect subsidiary of Dynatrace, Inc. These reorganization steps are collectively referred to as the reorganization.
The reorganization was completed between entities that have been under common control since December 15, 2014. Therefore, these financial statements retroactively reflect DHC and Dynatrace Holdings LLC on a consolidated basis for the periods presented. The spin-offs of Compuware Corporation and SIGOS LLC from DHC have been accounted for retroactively as a change in reporting entity and accordingly, these financial statements exclude their accounts and results.
The consolidated financial statements have been prepared in accordance with accounting principles generally accepted in the United States of America (U.S. GAAP). All intercompany balances and transactions have been eliminated in the accompanying financial statements. The income tax amounts in the accompanying consolidated financial statements have been calculated based on a separate return methodology and presented as if the Companys operations were separate taxpayers in the respective jurisdictions.
F-9
Table of Contents
As described in Note 16, the consolidated financial statements reflect the debt and debt service associated with subordinated demand promissory notes payable of DHC to a related party. The financial statements also reflect certain expenses incurred by DHC related to Dynatrace for certain functions including shared services, which are immaterial to these financial statements. These attributed expenses were allocated to Dynatrace on the basis of direct usage when identifiable, and for resources indirectly used by Dynatrace, allocations were based on a proportional cost allocation methodology, to reflect estimated usage by Dynatrace. Management considers the allocation methodology and results to be reasonable for all periods presented. However, the financial information presented in these financial statements may not reflect the consolidated financial position, operating results and cash flows of Dynatrace had the Dynatrace business been a separate stand-alone entity during the periods presented. Actual costs that would have been incurred if Dynatrace had been a stand-alone company would depend on multiple factors, including organizational structure and strategic decisions made in various areas.
Foreign currency translation
The reporting currency of the Company is the U.S. dollar (USD). The functional currency of the Companys principal foreign subsidiaries is the currency of the country in which each entity operates. Accordingly, assets and liabilities in the consolidated balance sheet have been translated at the rate of exchange at the balance sheet date, and revenues and expenses have been translated at average exchange rates prevailing during the period the transactions occurred. Translation adjustments have been excluded from the results of operations and are reported as accumulated other comprehensive loss within the consolidated statements of members deficit.
Transaction gains and losses generated by the effect of changes in foreign currency exchange rates on recorded assets and liabilities denominated in a currency different than the functional currency of the applicable entity are recorded in Other, net in the consolidated statements of operations.
Use of estimates
The preparation of consolidated financial statements in accordance with GAAP requires management to make estimates and assumptions that affect the reported amounts of assets, liabilities, the disclosure of contingent assets and liabilities as of the date of the consolidated financial statements, and the reported amounts of revenue and expenses during the reporting period. Management periodically evaluates such estimates and assumptions for continued reasonableness. In particular, the Company makes estimates with respect to the stand-alone selling price for each distinct performance obligation in customer contracts with multiple performance obligations, the uncollectible accounts receivable, the fair value of tangible and intangible assets acquired, and liabilities assumed in a business combination, valuation of long-lived assets, equity-based compensation expense and income taxes, among other things. Appropriate adjustments, if any, to the estimates used are made prospectively based upon such periodic evaluation. Actual results could differ from those estimates.
Segment information
The Company operates as one operating segment. The Companys chief operating decision maker is its chief executive officer, who reviews financial information presented on a consolidated basis, for purposes of making operating decisions, assessing financial performance and allocating resources.
Business combinations
When the Company acquires a business, management allocates the purchase price to the net tangible and identifiable intangible assets acquired. Any residual purchase price is recorded as
F-10
Table of Contents
goodwill. The allocation of the purchase price requires management to make significant estimates in determining the fair values of assets acquired and liabilities assumed, especially with respect to intangible assets. These estimates can include but are not limited to, the cash flows that an asset is expected to generate in the future, the appropriate weighted average cost of capital and the cost savings expected to be derived from acquiring an asset.
Deferred offering costs
Deferred offering costs, primarily consisting of legal, accounting, printer, and other direct fees and costs related to the Companys proposed initial public offering, are capitalized. The deferred offering costs will be offset against proceeds from the proposed initial public offering upon the closing of the offering. In the event the anticipated offering is not completed, all of the deferred offering costs will be expensed. As of March 31, 2018, the Company had not yet capitalized any offering costs in the consolidated balance sheets. As of March 31, 2019, the Company has capitalized $1.6 million of offering costs which are included in prepaid expenses and other current assets in the consolidated balance sheets.
Revenue recognition
The Company elected to early adopt Accounting Standards Codification Topic 606 (ASC 606), Revenue from Contracts with Customers, effective April 1, 2018, using the full retrospective transition method. Under this method, the Company is presenting the consolidated financial statements for the years ended March 31, 2017 and 2018 as if ASC 606 had been effective for those periods. The Company applied a practical expedient not to disclose the amount of the transaction price allocated to the remaining performance obligations for contracts with an original expected duration of one year or less.
The Company sells software licenses, subscriptions, maintenance and support, and professional services together in contracts with its customers, which include end-customers and channel partners. Certain of the Companys software license agreements provide customers with a right to use software perpetually or for a defined term. As required under applicable accounting principles, the goods and services that the Company promises to transfer to a customer are accounted for separately if they are distinct from one another. Promised items that are not distinct are bundled with other promised items until the bundle is distinct from other promised items in the contract. The transaction price is allocated to the separate performance obligations based on the relative estimated standalone selling prices of those performance obligations.
In accordance with ASC 606, revenue is recognized when a customer obtains control of promised services. The amount of revenue recognized reflects the consideration the Company expects to be entitled to receive in exchange for these services.
The Company determines revenue recognition through the following steps:
| 1. | Identification of the contract, or contracts, with a customer |
The Company considers the terms and conditions of the contract in identifying the contracts. The Company determines a contract with a customer to exist when the contract is approved, each partys rights regarding the services to be transferred can be identified, the payment terms for the services can be identified, it has been determined the customer has the ability and intent to pay, and the contract has commercial substance. At contract inception, the Company will evaluate whether two or more contracts should be combined and accounted for as a single contract and whether the combined or single contract includes more than one performance obligation. The Company applies judgment in determining the customers ability and intent to pay, which is based on a variety of factors, including the customers historical payment experience or, in the case of a new customer, credit, and financial information pertaining to the customer.
F-11
Table of Contents
| 2. | Identification of the performance obligations in the contract |
Performance obligations promised in a contract are identified based on the services and the products that will be transferred to the customer that are both capable of being distinct, whereby the customer can benefit from the service either on its own or together with other resources that are readily available from third parties or from the Company, and are distinct in the context of the contract, whereby the transfer of the services and the products is separately identifiable from other promises in the contract. The Companys performance obligations consist of (i) software licenses, (ii) subscription services, (ii) maintenance and support for software licenses, and (iv) professional services.
| 3. | Determination of the transaction price |
The transaction price is determined based on the consideration to which the Company expects to be entitled in exchange for transferring services to the customer. Variable consideration is included in the transaction price if, in the Companys judgment, it is probable that a significant future reversal of cumulative revenue under the contract will not occur. The Companys contracts do not contain a significant financing component.
| 4. | Allocation of the transaction price to the performance obligations in the contract |
If the contract contains a single performance obligation, the entire transaction price is allocated to the single performance obligation. Contracts that contain multiple performance obligations require an allocation of the transaction price to each performance obligation based on a relative standalone selling price (SSP) for arrangements not including software licenses or subscription services. The Company has determined that its pricing for software licenses and subscription services is highly variable and therefore allocates the transaction price to those performance obligations using the residual approach.
| 5. | Recognition of revenue when, or as a performance obligation is satisfied |
Revenue is recognized at the time the related performance obligation is satisfied by transferring the control of the promised service to a customer. Revenue is recognized when control of the service is transferred to the customer, in an amount that reflects the consideration that the Company expects to receive in exchange for those services.
Subscriptions
Subscription revenue relates to performance obligations for which the Company recognizes revenue over time as control of the product or service is transferred to the customer. Subscription revenue includes arrangements that permit customers to access and utilize the Companys hosted software delivered on a software-as-a-service (SaaS) basis, term-based and perpetual licenses of the Companys Dynatrace Software, as well as maintenance. Fees associated with subscriptions are generally invoiced and deferred upon contract execution and are recognized as revenue ratably over the term. The when-and-if available updates of the Dynatrace Software, which are part of the maintenance agreement, are critical to the continued utility of the Dynatrace Software; therefore, the Company has determined the Dynatrace Software and the related when-and-if available updates to be a combined performance obligation. Accordingly, when Dynatrace Software is sold under a term-based license, the revenue associated with this combined performance obligation is recognized ratably over the license term as maintenance is included for the duration of the license term. The Company has determined that perpetual licenses of Dynatrace Software provide customers with a material right to acquire additional goods or services that they would not receive without entering into the initial contract as the renewal option for maintenance services allows the customer to extend the utility of the Dynatrace Software without having to again make the initial payment of the perpetual software license fee. The associated material right is deferred and recognized ratably over the term of the expected optional maintenance renewals.
F-12
Table of Contents
Subscription revenue also includes maintenance services relating to the Companys Classic offerings as that revenue is recognized over time given that our obligation is a stand-ready obligation to provide customer support and when-and-if available updates to the Classic software as well as certain other stand-ready obligations.
Licenses
Licenses revenue relates to performance obligations for which the Company recognizes revenue at the point that the license is transferred to the customer. License revenue includes these perpetual and term-based licenses that relate to the Companys Classic offerings (Classic Software Licenses), which are focused on traditional customer approaches to building, operating and monitoring software in more stable and less dynamic and complex environments. The Company requires customers purchasing perpetual licenses of Classic Software and Dynatrace Software, as defined below, to also purchase maintenance services covering at least one year from the beginning of the perpetual license. The Company has determined that the Classic Software Licenses and the related maintenance services are separate performance obligations with different patterns of recognition. Revenue from Classic Software Licenses is recognized upon delivery of the license. Revenue from maintenance is recognized over the period of time of the maintenance agreement and is included in Subscriptions.
Services
The Company offers implementation, consulting and training services for the Companys software solutions and SaaS offerings. Services fees are generally based on hourly rates. Revenues from services are recognized in the period the services are performed, provided that collection of the related receivable is reasonably assured.
Disaggregation of Revenue
The following table is a summary of the Companys total revenues by geographic region:
| Year Ended | ||||||||||||||||||||||||
| March 31, 2017 | March 31, 2018 | March 31, 2019 | ||||||||||||||||||||||
| Amount | % | Amount | % | Amount | % | |||||||||||||||||||
| (in thousands, except percentages) | ||||||||||||||||||||||||
| North America |
$ | 250,292 | 62 | % | $ | 232,521 | 58 | % | $ | 248,012 | 57 | % | ||||||||||||
| Europe, Middle East and Africa |
99,725 | 25 | % | 111,295 | 28 | % | 125,615 | 29 | % | |||||||||||||||
| Asia Pacific |
44,829 | 11 | % | 39,275 | 10 | % | 45,563 | 11 | % | |||||||||||||||
| Latin America |
11,531 | 3 | % | 14,956 | 4 | % | 11,776 | 3 | % | |||||||||||||||
|
|
|
|
|
|
|
|||||||||||||||||||
| Total revenue |
$ | 406,377 | $ | 398,047 | $ | 430,966 | ||||||||||||||||||
|
|
|
|
|
|
|
|||||||||||||||||||
For the years ended March 31, 2017, 2018, and 2019, the United States was the only country that represented more than 10% of the Companys revenues in any period, constituting $237.2 million and 58%, $216.6 million and 54%, and $233.3 million and 54%, respectively, of total revenue.
Deferred commissions
Deferred sales commissions earned by the Companys sales force are considered incremental and recoverable costs of obtaining a contract with a customer. Sales commissions for new contracts are deferred and then amortized on a straight-line basis over a period of benefit which the Company has estimated to be three years. The period of benefit has been determined by taking into consideration the duration of customer contracts, the life of the technology, renewals of maintenance
F-13
Table of Contents
and other factors. Sales commissions for renewal contracts are deferred and then amortized on a straight-line basis over the related contractual renewal period. Amortization expense is included in sales and marketing expenses on the consolidated statements of operations.
The Company periodically reviews these deferred costs to determine whether events or changes in circumstances have occurred that could impact the period of benefit of these deferred commissions. There were no impairment losses recorded during the periods presented.
The following table represents a rollforward of the Companys deferred commissions:
| Fiscal Year Ended March 31, | ||||||||||||
| 2017 | 2018 | 2019 | ||||||||||
| Beginning balance |
$ | 19,398 | $ | 25,219 | $ | 39,282 | ||||||
| Additions to deferred commissions |
16,431 | 30,835 | 43,212 | |||||||||
| Amortization of deferred commissions |
(10,610 | ) | (16,772 | ) | (23,244 | ) | ||||||
|
|
|
|
|
|
|
|||||||
| Ending Balance |
$ | 25,219 | $ | 39,282 | $ | 59,250 | ||||||
|
|
|
|
|
|
|
|||||||
| Deferred commissions, current |
13,643 | 18,763 | 27,705 | |||||||||
| Deferred commissions, non-current |
11,576 | 20,519 | 31,545 | |||||||||
|
|
|
|
|
|
|
|||||||
| Total deferred commissions |
$ | 25,219 | $ | 39,282 | $ | 59,250 | ||||||
|
|
|
|
|
|
|
|||||||
Deferred revenue
Deferred revenue consists primarily of billed subscription and maintenance fees related to the future service period of subscription and maintenance agreements in effect at the reporting date. Deferred licenses are also included in deferred revenue for those billed arrangements that are being recognized over time. Short-term deferred revenue represents the unearned revenue that will be earned within twelve months of the balance sheet date; whereas, long-term deferred revenue represents the unearned revenue that will be earned after twelve months from the balance sheet date.
As of March 31, 2019, the aggregate amount of the transaction price allocated to remaining performance obligations was $552.3 million, which consists of both billed consideration in the amount of $365.7 million and unbilled consideration in the amount of $186.6 million that the Company expects to recognize as subscription revenue. The Company expects to recognize 59% of this amount as revenue in the fiscal year ending March 31, 2020 and 100% over the three years ending March 31, 2022.
As of March 31, 2019, approximately $365.7 million of billed revenue is expected to be recognized from remaining performance obligations for subscription arrangements. The Company expects to recognize revenue on 75% of those remaining performance obligations over the next 12 months, with the balance recognized thereafter.
The Company applied a practical expedient allowing it not to disclose the amount of the transaction price allocated to the remaining performance obligations for contracts with an original expected duration of one year or less.
Payment terms
Payment terms and conditions vary by contract type, although the Companys terms generally include a requirement of payment within 30 days. In instances where the timing of revenue recognition differs from the timing of payment, the Company has determined that its contracts do not include a significant financing component. The primary purpose of invoicing terms is to provide customers with simplified and predictable ways of purchasing products and services, not to receive financing from customers or to provide customers with financing.
F-14
Table of Contents
Cost of revenues
Cost of subscriptions
Cost of subscription revenue includes all direct costs to deliver the Companys subscription products including salaries, benefits, share-based compensation and related expenses such as employer taxes, allocated overhead for facilities, IT, third-party hosting fees related to the Companys cloud services, and amortization of internally developed capitalized software technology. The Company recognizes these expenses as they are incurred.
Cost of services
Cost of services revenue includes salaries, benefits, share-based compensation and related expenses such as employer taxes for our services organization, allocated overhead for depreciation of equipment, facilities and IT, and amortization of acquired intangible assets. The Company recognizes expense related to its services organization as they are incurred.
Amortization of acquired technology
Amortization of acquired technology includes amortization expense for technology acquired in business combinations.
Research and development
Research and development (R&D) costs, which primarily include the cost of programming personnel, including share-based compensation, amounted to $52.9 million, $58.3 million, and $76.8 million during the years ended March 31, 2017, 2018 and 2019, respectively. R&D costs related to the Companys software solutions are reported as Research and development in the consolidated statements of operations.
Leases
The Company primarily leases facilities under operating leases. For leases that contain rent escalation or rent concession provisions, rent expense is recorded on a straight-line basis over the term of the lease. The difference between the rent paid and the straight-line rent expense is recorded as current and non-current deferred rent liability, as appropriate on the consolidated balance sheets. Rent expense for operating leases was $8.7 million, $8.7 million, and $11.3 million for the years ended March 31, 2017, 2018 and 2019, respectively.
Restructuring expense
The Company defines restructuring expense as costs directly associated with exit or disposal activities. Such costs include employee severance and termination benefits, contract termination fees and penalties, and other exit or disposal costs. In general, the Company records involuntary employee-related exit and disposal costs when there is a substantive plan for employee severance and related costs are probable and estimable. For one-time termination benefits (i.e., no substantive plan) and employee retention costs, expense is recorded when the employees are entitled to receive such benefits and the amount can be reasonably estimated. Contract termination fees and penalties and other exit and disposal costs are generally recorded when incurred.
Concentration of credit risk
Financial instruments that potentially subject the Company to concentrations of credit risk consist of cash and cash equivalents and accounts receivable. The Company maintains its cash in bank deposit accounts that, at times, may exceed federally insured limits. There is presently no
F-15
Table of Contents
concentration of credit risk for customers as no individual entity represented more than 10% of the balance in accounts receivable as of March 31, 2017, 2018, and 2019 or 10% of revenue for the years ended March 31, 2017, 2018, and 2019.
Cash and cash equivalents
All highly-liquid investments with a maturity of three months or less when purchased are considered cash and cash equivalents.
Accounts receivable and allowance for doubtful accounts
The Company continuously assesses the collectability of outstanding customer invoices and in doing so, assesses the need to maintain an allowance for estimated losses resulting from the non-collection of customer receivables. In estimating this allowance, the Company considers factors such as: historical collection experience, a customers current creditworthiness, customer concentrations, age of outstanding balances, both individually and in the aggregate, and existing economic conditions. Actual customer collections could differ from the Companys estimates. Allowance for doubtful accounts totaled $3.9 million and $3.4 million, and is classified as Accounts receivable, net in the consolidated balance sheets as of March 31, 2018 and 2019, respectively.
Property and equipment, net
The Company states property and equipment, net, at the acquisition cost less accumulated depreciation. Depreciation is recorded using the straight-line method over the estimated useful lives of the related assets. Leasehold improvements are depreciated over the shorter of the useful lives of the assets or the related lease. The following table presents the estimated useful lives of the Companys property and equipment:
| Computer equipment and software |
3 - 5 years | |
| Furniture and fixtures |
5 - 10 years | |
| Leasehold improvements |
Shorter of the useful life of the asset or the lease term |
Property and equipment are reviewed for impairment whenever events or circumstances indicate their carrying value may not be recoverable. When such events or circumstances arise, an estimate of future undiscounted cash flows produced by the asset, or the appropriate grouping of assets, is compared to the assets carrying value to determine if an impairment exists. If the asset is determined to be impaired, the impairment loss is measured based on the excess of its carrying value over its fair value. Assets to be disposed of are reported at the lower of carrying value or net realizable value. There was no impairment of property and equipment during the years ended March 31, 2017, 2018, and 2019.
Goodwill and other intangible assets
The Companys goodwill and intangible assets primarily relate to the push-down of such assets relating to Thoma Bravos December 15, 2014 acquisition of Compuware Corporation based on their relative fair values at the date of acquisition.
Goodwill represents the excess of the purchase price of an acquired business over the fair value of the underlying net tangible and intangible assets. Goodwill is evaluated for impairment annually in the fourth quarter of the Companys fiscal year, and whenever events or changes in circumstances indicate the carrying value of goodwill may not be recoverable. Triggering events that may indicate impairment include, but are not limited to, a significant adverse change in customer demand or business climate that could affect the value of goodwill or a significant decrease in expected cash flows. Since the Companys acquisition by Thoma Bravo through March 31, 2019, the Company did not have any goodwill impairment.
F-16
Table of Contents
Intangible assets consist primarily of customer relationships, developed technology, trade names and trademarks, all of which have a finite useful life, as well as goodwill. Intangible assets are amortized based on either the pattern in which the economic benefits of the intangible assets are estimated to be realized or on a straight-line basis, which approximates the manner in which the economic benefits of the intangible asset will be consumed.
Capitalized software
The Companys capitalized software includes the costs of internally developed software technology and software technology purchased through acquisition. Internally developed software technology consists of development costs associated with software products to be sold (software products) and internal use software associated with hosted software.
Costs associated with the development of software technology are expensed prior to the establishment of technological feasibility and capitalized thereafter until the related software technology is available for general release to customers. Technological feasibility is established when management has authorized and committed to funding a project and it is probable that the project will be completed, and the software will be used to perform the function intended. For internal use software, capitalization begins during the application development stage. The Company capitalized $5.2 million, $3.6 million, and $1.9 million for internally developed software technology during the years ended March 31, 2017, 2018, and 2019, respectively, and is recorded within Other intangible assets, net in the consolidated balance sheets.
The amortization of capitalized software technology is computed on a project-by-project basis. The annual amortization is the greater of the amount computed using (a) the ratio of current gross revenues compared with the total of current and anticipated future revenues for the software technology or (b) the straight-line method over the remaining estimated economic life of the software technology, including the period being reported on. Amortization begins when the software technology is available for general release to customers. The amortization period for capitalized software is generally three to five years. Amortization of internally developed capitalized software technology is $2.6 million, $5.0 million, and $6.8 million during the years ended March 31, 2017, 2018, and 2019, respectively, and is recorded within Cost of subscriptions in the consolidated statements of operations.
Impairment of long-lived assets
Long-lived assets, including amortized intangibles, are reviewed for impairment whenever events or changes in circumstances indicate that the carrying amount of an asset may not be recoverable. If circumstances require a long-lived asset be tested for possible impairment, the Company first compares undiscounted cash flows expected to be generated by an asset to the carrying value of the asset. If the carrying value of the long-lived asset is not recoverable on an undiscounted cash flow basis, impairment is recognized to the extent that the carrying value exceeds its fair value. Fair value is estimated by the Company using discounted cash flows and other market-related valuation models, including earnings multiples and comparable asset market values. If circumstances change or events occur to indicate that the Companys fair market value has fallen below book value, the Company will compare the estimated fair value of long-lived assets (including goodwill) to its book value. If the book value exceeds the estimated fair value, the Company will recognize the difference as an impairment loss in the consolidated statements of operations. The Company did not incur any impairment losses during the years ended March 31, 2017, 2018, and 2019.
Income taxes
The Company accounts for income taxes under the asset and liability method, which requires the recognition of deferred tax assets and liabilities for the expected future tax consequences of events
F-17
Table of Contents
that have been included in the financial statements. Under this method, deferred tax assets and liabilities are determined based on the differences between the financial statements and tax bases of assets and liabilities and net operating loss and credit carryforwards using enacted tax rates in effect for the year in which the differences are expected to reverse. The effect of a change in tax rates on deferred tax assets and liabilities is recognized in the period that includes the enactment date. The Company does not permanently reinvest any earnings in its foreign subsidiaries and recognizes all deferred tax liabilities that arise from outside basis differences in its investment in subsidiaries.
The Company records net deferred tax assets to the extent it believes these assets will more likely than not be realized. These deferred tax assets are subject to periodic assessments as to recoverability and if it is determined that it is more likely than not that the benefits will not be realized, valuation allowances are recorded which would reduce deferred tax assets. In making such determination, the Company considers all available positive and negative evidence, including future reversals of existing taxable temporary differences, projected future taxable income, tax planning strategies and recent financial operations.
Interest and penalties related to uncertain income tax positions are included in the income tax provision.
Fair value of assets and liabilities
Assets and liabilities recorded at fair value in the financial statements are categorized based upon the level of judgment associated with the inputs used to measure their fair value. Hierarchical levels which are directly related to the amount of subjectivity associated with the inputs to the valuation of these assets or liabilities are as follows:
| | Level 1: Observable inputs that reflect quoted prices for identical assets or liabilities in active markets; |
| | Level 2: Observable inputs, other than Level 1 prices, such as quoted prices for similar assets or liabilities, quoted prices in markets that are not active or other inputs that are observable or can be corroborated by observable market data for substantially the full term of the assets or liabilities; and |
| | Level 3: Unobservable inputs reflecting the Companys own assumptions incorporated in valuation techniques used to determine fair value. These assumptions are required to be consistent with market participant assumptions that are reasonably available. |
The Companys carrying amounts of financial instruments, including cash and cash equivalents, accounts receivable, accounts payable, and other current liabilities approximate their fair values due to their short maturities.
Share-based compensation
Certain employees were granted management incentive units (MIUs) which make a holder eligible to participate in distributions of cash, property, or securities of Compuware Parent LLC made in respect of the Company (whether by way of dividend, repurchase, recapitalization, or otherwise). In the event the employee is no longer employed by the Company, including due to a change in control, as defined, all the management incentive units will be subject to a repurchase arrangement, at the discretion of the Company, Compuware Parent LLC, or Thoma Bravo and certain Thoma Bravo affiliated funds that hold equity in Compuware Parent LLC (collectively, TB). There have been no distributions during the years ended March 31, 2017, 2018, and 2019.
F-18
Table of Contents
On January 1, 2018, certain MIU participants exchanged their MIUs for appreciation units (AUs) which entitle a holder to receive the same cash payments as the holder would have received if the holder had continued to own the MIUs that had been exchanged. In the event the employee is no longer employed by the Company, including due to a change in control, as defined, all the AUs will be subject to a repurchase arrangement at the discretion of the Company, Compuware Parent LLC, or TB. There have been no distributions during the years ended March 31, 2017, 2018, and 2019.
The Company recognizes compensation expense for a share-based award on a straight-line basis over an employees requisite service period based on the awards fair value. Share-based awards are settled in cash and are accounted for as liability-based awards. As such, liabilities for awards under these plans are required to be measured at fair value at each reporting date until the date of settlement.
Excess tax benefits of awards related to awards exercises are recognized as an income tax benefit in the income statement and reflected in operating activities in the statement of cash flows. Share-based compensation cost that has been included in income from continuing operations amounted to $0.3 million, $22.3 million, and $71.2 million for the years ended March 31, 2017, 2018, and 2019. The total income tax benefit recognized in the consolidated statements of operations for share-based compensation arrangements was zero, $0.7 million, and $4.8 million for the years ended March 31, 2017, 2018, and 2019, respectively. The liability for these share-based awards is recorded in accrued expenses, non-current on the balance sheet.
Earnings per share
Basic earnings per share attributable to common shareholders is calculated by dividing the net income attributable to common shareholders for the period by the weighted-average number of common shares outstanding during the period, without consideration of potentially dilutive securities. Diluted earnings per share includes the dilutive effect of common share equivalents and is calculated using the weighted-average number of common shares and the common share equivalents outstanding during the reporting period. An antidilutive impact is an increase in earnings per share or a reduction in net loss per share resulting from the conversion, exercise, or contingent issuance of certain securities. For the years ended March 31, 2017, 2018, and 2019, basic and diluted earnings per share have been retroactively adjusted to reflect the reorganization transactions described in Note 2.
Recently adopted accounting pronouncements
In May 2014, the FASB issued Accounting Standards Update (ASU) 2014-09, Revenue from Contracts with Customers (Topic 606), which supersedes the revenue recognition requirements in Accounting Standards Codification 605, Revenue Recognition and establishes a new revenue standard. This new standard is based on the principle that revenue is recognized to depict the transfer of control of goods or services to customers in an amount that reflects the consideration to which the entity expects to be entitled to in exchange for those goods or services. The standard also requires additional disclosures about the nature, amount, timing and uncertainty of revenues and cash flows arising from customer contracts, including significant judgments and changes in judgments, and assets recognized from costs incurred to obtain or fulfill a contract. The FASB has also issued several amendments to the new standard which were designed to clarify and simplify the adoption process.
In preparation for adoption of the new standard, the Company updated its accounting policies, systems, internal controls and processes. The Company adopted Topic 606 as of April 1, 2018 using the full retrospective method, which required adjustments to the historical financial information for fiscal years 2017 and 2018 to be consistent with the new standard. The Company recorded a net decrease
F-19
Table of Contents
to members accumulated deficit of $25.9 million as of April 1, 2016 as a result of the transition. The most significant impacts of the standard relate to the timing of revenue recognition for arrangements involving licenses and sales commissions. Under the new revenue standard, term licenses of the Companys Classic products and the associated maintenance are considered separate performance obligations. This results in revenue associated with these term licenses being recognized upon delivery of the license rather than over the contractual term. Perpetual licenses and term license related to Dynatrace Software and the associated maintenance which includes when-and-if-available updates have been determined to be combined performance obligations and are recognized ratably over the longer of the term or useful life of the license. Additionally, some deferred revenue, primarily from arrangements involving term licenses, was never recognized as revenue and instead is now a part of the cumulative effect adjustment within accumulated deficit. Finally, the Company is required to capitalize and amortize incremental costs of obtaining a contract, such as certain sales commission costs, over the remaining contractual term or over an expected period of benefit, which the Company has determined to be approximately three years.
The Company applied the following practical expedients permitted under Topic 606; for all reporting periods presented before the date of initial adoption, the Company has elected not to disclose the amount of the transaction price allocated to the remaining performance obligations or provide an explanation of when the Company expects to recognize that amount as revenue. Additionally, the Company has also elected not to separately evaluate each contract modification that occurred before the initial adoption date. The Company has elected not to assess whether a contract has a significant financing component if it expects at contract inception that the period between payment and the transfer of products or services will be one year or less.
In August 2016, the FASB issued ASU 2016-15, Statement of Cash Flows (Topic 230): Classification of Certain Cash Receipts and Cash Payments. The ASU addresses eight specific cash flow issues with the objective of reducing the existing diversity in practice in how certain transactions are classified in the statement of cash flows. The ASU will be applied using a retrospective transition method to each period presented. This new guidance is effective for annual reporting periods beginning after December 15, 2017, and interim periods within those periods, with early adoption permitted. The Company adopted the guidance as of April 1, 2018, noting no material impact on the consolidated financial statements.
In January 2017, the FASB issued ASU 2017-04, IntangiblesGoodwill and Other (Topic 350): Simplifying the Test for Goodwill Impairment, which removes step 2 from the goodwill impairment test. Under the new guidance, if a reporting units carrying amount exceeds its fair value, an entity will record an impairment charge based on that difference. The impairment charge will be limited to the amount of goodwill allocated to that reporting unit. This new guidance is effective for annual and interim reporting periods beginning after December 15, 2019, with early adoption permitted. The Company adopted the guidance as of March 31, 2018, noting no material impact on the consolidated financial statements.
In January 2017, the FASB issued ASU 2017-01, Business Combinations (Topic 805): Clarifying the Definition of a Business, which clarifies when transactions should be accounted for as acquisitions (or disposals) of assets or business. This new guidance is effective for annual reporting periods beginning after December 15, 2017, including interim periods within those periods, with early adoption permitted. The Company adopted the guidance as of April 1, 2018, noting no material impact on the consolidated financial statements.
In May 2017, the FASB issued ASU 2017-09, Compensation-Stock Compensation (Topic 718): Scope of Modification Accounting. The update provides guidance about which changes to the terms or conditions of a share-based payment award require an entity to apply modification accounting under
F-20
Table of Contents
Topic 718. This new guidance is effective for annual and interim reporting periods beginning after December 15, 2017 with early adoption permitted. The Company adopted the guidance as of March 31, 2018, noting no material impact on the consolidated financial statements.
Recently issued accounting pronouncements
In February 2016, the FASB issued ASU 2016-02, Leases (Topic 842). The amendments supersede current lease requirements in Topic 840 which require lessees to recognize most leases on their balance sheets as lease liabilities with corresponding right-of-use assets. The objective of Topic 842 is to establish the principles that lessees and lessors shall apply to report useful information to users of financial statements about the amount, timing, and uncertainty of cash flows arising from a lease. This new guidance is effective for public companies for annual reporting periods beginning after December 15, 2018, and interim periods within those periods, except for emerging growth companies who may elect to adopt the standard for annual reporting periods beginning after December 15, 2019. In July 2018, the FASB issued ASU 2018-11, Leases (Topic 842): Targeted Improvements that allows entities to recognize a cumulative-effect adjustment to the opening balance of retained earnings in the period of adoption. The Company plans to elect this new transition guidance upon adoption of the standard on April 1, 2020. The Company will use the package of practical expedients which allows Dynatrace to not (1) reassess whether any expired or existing contracts are considered or contain leases; (2) reassess the lease classification for any expired or existing leases; and (3) reassess the initial direct costs for any existing leases. Adoption of the standard is expected to result in the recognition of the right-of-use assets and lease liabilities for operating leases. The Company is currently evaluating the effects the standard will have on its consolidated financial statements.
In August 2018, the FASB issued ASU 2018-15, Customers Accounting for Implementation Costs Incurred in a Cloud Computing Arrangement That Is a Service Contract; Disclosures for Implementation Costs Incurred for Internal-Use Software and Cloud Computing Arrangements, which aligns the accounting for implementation costs incurred in a hosting arrangement that is a service contract with the accounting for implementation costs incurred to develop or obtain internal-use software under ASC 350-40, in order to determine which costs to capitalize and recognize as an asset. ASU 2018-15 is effective for annual periods, and interim periods within those years, beginning after December 15, 2020, and can be applied either prospectively to implementation costs incurred after the date of adoption or retrospectively to all arrangements. The Company is currently evaluating the effects the standard will have on its consolidated financial statements.
| 3. | Business Combinations |
In November 2017, the Company completed the acquisition of Qumram AG (Qumram), a Swiss company whose technology allows organizations to gain insight into user behavior and enhance customer experience by recording, analyzing and visually replaying user sessions, for an aggregate purchase price of $20.8 million. Total cash consideration net of cash acquired was $11.3 million. The Company has recorded a payment obligation of $8.5 million, of which $3.6 million classified as Accrued expenses, current and $4.9 million classified as Accrued expenses, non-current in its consolidated balance sheet for the year ended March 31, 2018. Of the total purchase price, $1.7 million was allocated to acquired technology and an immaterial amount to net tangible assets acquired, with the excess $18.7 million of the purchase price over the fair value of net tangible and intangible assets acquired recorded as goodwill. The Company also recognized transaction costs of approximately $0.2 million, which are included in general and administrative expense in its consolidated statement of operations for the year ended March 31, 2018. The acquired technology has an estimated useful life of 6 years and is recorded within Other intangible assets, net in the consolidated balance sheets for the year ended March 31, 2018. The acquisition has been accounted for as a business combination under the acquisition method. Goodwill generated from the acquisition is
F-21
Table of Contents
attributable to expected synergies from future growth and potential future monetization opportunities, and is not deductible for tax purposes. Pro forma revenue and results of operations have not been presented because the historical results of Qumram were not material to the Companys consolidated financial statements in any period presented.
| 4. | Prepaid Expenses and Other Current Assets |
Prepaid expenses and other current assets consisted of the following (in thousands):
| March 31, | ||||||||
| 2018 | 2019 | |||||||
| Prepaid expenses |
$ | 9,546 | $ | 13,334 | ||||
| Income taxes refundable |
1,825 | 4,078 | ||||||
| Other |
232 | 1,356 | ||||||
|
|
|
|
|
|||||
| Prepaid expenses and other current assets |
$ | 11,603 | $ | 18,768 | ||||
|
|
|
|
|
|||||
| 5. | Property and Equipment, Net |
The following table summarizes, by major classification, the components of property and equipment (in thousands):
| March 31, | ||||||||
| 2018 | 2019 | |||||||
| Computer equipment and software |
$ | 38,340 | $ | 37,745 | ||||
| Furniture and fixtures |
7,108 | 6,701 | ||||||
| Leasehold improvements |
10,586 | 11,741 | ||||||
| Other |
874 | 1,260 | ||||||
|
|
|
|
|
|||||
| Total property and equipment |
56,908 | 57,447 | ||||||
| Less: accumulated depreciation and amortization |
(38,430 | ) | (39,522 | ) | ||||
|
|
|
|
|
|||||
| Property and equipment, net |
$ | 18,478 | $ | 17,925 | ||||
|
|
|
|
|
|||||
Depreciation and amortization of property and equipment totaled $11.1 million, $8.8 million, and $7.3 million for the years ended March 31, 2017, 2018, and 2019, respectively.
| 6. | Goodwill and Intangible Assets, net |
Changes in the carrying amount of goodwill, including from the Companys formation and acquisitions occurring prior to fiscal 2017, on a consolidated basis for fiscal 2017, fiscal 2018, and fiscal 2019 consist of the following (in thousands):
| March 31, | ||||||||
| 2018 | 2019 | |||||||
| Balance, beginning of year |
$ | 1,251,155 | $ | 1,270,937 | ||||
| Goodwill from acquisitions |
18,741 | | ||||||
| Foreign currency impact |
1,041 | (817 | ) | |||||
|
|
|
|
|
|||||
| Balance, end of year |
$ | 1,270,937 | $ | 1,270,120 | ||||
|
|
|
|
|
|||||
F-22
Table of Contents
Intangible assets, net excluding goodwill consist of (in thousands):
|
Weighted Average Useful Life (in months) |
March 31, | |||||||||||
| 2018 | 2019 | |||||||||||
| Capitalized software |
109 | $ | 186,808 | $ | 188,608 | |||||||
| Customer relationships |
120 | 351,555 | 351,555 | |||||||||
| Trademarks and tradenames |
120 | 55,003 | 55,003 | |||||||||
|
|
|
|
|
|||||||||
| Total intangible assets |
593,366 | 595,166 | ||||||||||
| Less: accumulated amortization |
(263,251 | ) | (336,043 | ) | ||||||||
|
|
|
|
|
|||||||||
| Total intangible assets, net |
$ | 330,115 | $ | 259,123 | ||||||||
|
|
|
|
|
|||||||||
Amortization of other intangible assets totaled $73.9 million, $73.5 million, and $72.8 million for the years ended March 31, 2017, 2018 and 2019, respectively.
As of March 31, 2019, the estimated future amortization expense of the Companys other intangible assets in the table above is as follows (in thousands):
| Fiscal Year Ended March 31, | ||||||||||||||||||||||||
| 2020 | 2021 | 2022 | 2023 | 2024 | Thereafter | |||||||||||||||||||
| Capitalized software |
$ | 17,845 | $ | 16,430 | $ | 15,867 | $ | 15,673 | $ | 15,421 | $ | 10,629 | ||||||||||||
| Customer relationships |
34,780 | 29,243 | 24,660 | 20,794 | 17,534 | 10,473 | ||||||||||||||||||
| Trademarks and tradenames |
5,501 | 5,501 | 5,501 | 5,501 | 4,753 | 3,017 | ||||||||||||||||||
|
|
|
|
|
|
|
|
|
|
|
|
|
|||||||||||||
| Total amortization |
$ | 58,126 | $ | 51,174 | $ | 46,028 | $ | 41,968 | $ | 37,708 | $ | 24,119 | ||||||||||||
|
|
|
|
|
|
|
|
|
|
|
|
|
|||||||||||||
| 7. | Income Taxes |
Income tax provision
Income/(loss) before income taxes and the income tax provision/(benefit) include the following (in thousands):
| Fiscal Year Ended March 31, | ||||||||||||
| 2017 | 2018 | 2019 | ||||||||||
| Domestic |
$ | (58,188 | ) | $ | (64,391 | ) | $ | (163,385 | ) | |||
| Foreign |
41,795 | 12,616 | 23,474 | |||||||||
|
|
|
|
|
|
|
|||||||
| Total |
$ | (16,393 | ) | $ | (51,775 | ) | $ | (139,911 | ) | |||
|
|
|
|
|
|
|
|||||||
The income tax provision includes the following (in thousands):
| Fiscal Year Ended March 31, | ||||||||||||
| 2017 | 2018 | 2019 | ||||||||||
| Income tax (benefit) expense |
||||||||||||
| Federal |
$ | 2,048 | $ | (393 | ) | $ | 3,213 | |||||
| State |
605 | 1,198 | 575 | |||||||||
| Foreign |
8,585 | 11,638 | 5,920 | |||||||||
|
|
|
|
|
|
|
|||||||
| Total current tax position |
11,238 | 12,443 | 9,708 | |||||||||
|
|
|
|
|
|
|
|||||||
| Federal |
(23,781 | ) | (72,336 | ) | (29,021 | ) | ||||||
| State |
(4,404 | ) | (990 | ) | (5,464 | ) | ||||||
| Foreign |
(242 | ) | (114 | ) | 1,060 | |||||||
|
|
|
|
|
|
|
|||||||
| Total deferred tax provision |
(28,427 | ) | (73,440 | ) | (33,425 | ) | ||||||
|
|
|
|
|
|
|
|||||||
| Total income tax (benefit) expense |
$ | (17,189 | ) | $ | (60,997 | ) | $ | (23,717 | ) | |||
|
|
|
|
|
|
|
|||||||
F-23
Table of Contents
The Companys income tax benefit of $17.2 million for the year ended March 31, 2017 differed from the amount computed on pre-tax loss at the U.S. federal income tax rate of 35%, because tax attributes at the Company are shared with other members of its consolidated tax group, some of whom are not included in this filing.
The Companys income tax benefit of $61.0 million for the year ended March 31, 2018 differed from the amount computed on pretax income at the U.S. federal blended rate of 31.5% primarily due to the Tax Cuts and Jobs Act (the Tax Act). The Tax Act was signed into law on December 22, 2017 and includes, among other items, a permanent reduction to the U.S. corporate income tax rate from 35% to 21% effective January 1, 2018 and requires immediate taxation of accumulated, unremitted non-U.S. earnings (the Transition Tax). As a result, at March 31, 2018, the Company recognized a tax benefit of $50.0 million from revaluing U.S. net deferred tax liabilities. The Transition Tax had no impact on the Companys income tax provision.
The Companys income tax benefit of $23.7 million for the year ended March 31, 2019 differed from the amount computed on pre-tax loss at the U.S. federal income tax rate of 21% primarily because of non-deductible share-based compensation. The Tax Act includes two new U.S. corporate tax provisions effective for the year ended March 31, 2019, the global intangible low-taxed income (GILTI) and the base-erosion and anti-abuse tax (BEAT). The GILTI provision requires the Company to include in its U.S. income tax return non-U.S. subsidiary earnings in excess of an allowable return on the non-U.S. subsidiarys tangible assets. The BEAT provision in the Tax Act eliminates the deduction of certain base-erosion payments made to related non-U.S. corporations, and imposes a minimum tax if the amount is greater than the regular tax. The Company evaluated the GILTI and BEAT provisions resulting in an immaterial impact to the financial statements for the year ended March 31, 2019.
The tax rate reconciliation is as follows (in thousands):
| Fiscal Year Ended March 31, | ||||||||||||
| 2017 | 2018 | 2019 | ||||||||||
| Income tax (benefit) at U.S. federal statutory income tax rate |
$ | (5,738 | ) | $ | (16,309 | ) | $ | (29,381 | ) | |||
| State and local tax expense |
(3,799 | ) | 208 | (4,890 | ) | |||||||
| Foreign tax rate differential |
(2,920 | ) | 3,619 | 2,051 | ||||||||
| Non-deductible expenses |
1,215 | 8,645 | 11,807 | |||||||||
| Tax credits |
(7,482 | ) | (6,173 | ) | (13,233 | ) | ||||||
| Sharing of consolidated tax attributes |
(6,417 | ) | (8,890 | ) | | |||||||
| Changes in tax law |
| (50,033 | ) | | ||||||||
| Changes in valuation allowance |
6,633 | 5,133 | 6,087 | |||||||||
| Foreign withholding tax |
1,544 | 2,701 | 3,086 | |||||||||
| Other adjustments |
(225 | ) | 102 | 756 | ||||||||
|
|
|
|
|
|
|
|||||||
| Total income tax (benefit) |
$ | (17,189 | ) | $ | (60,997 | ) | $ | (23,717 | ) | |||
|
|
|
|
|
|
|
|||||||
Deferred tax assets and liabilities
Based on the Companys review of both positive and negative evidence regarding the realizability of deferred tax assets at March 31, 2019, a valuation allowance continues to be recorded against certain deferred tax assets based upon the conclusion that it was more likely than not they would not be realized. The valuation allowance at March 31, 2018 and 2019 relates primarily to foreign tax credits and net operating losses.
F-24
Table of Contents
Temporary differences and carryforwards that give rise to a significant portion of deferred tax assets and liabilities are as follows (in thousands):
| March 31, | ||||||||
| 2018 | 2019 | |||||||
| Deferred revenue |
$ | | $ | 4,752 | ||||
| Intangible assets |
1,621 | 1,247 | ||||||
| Accrued expenses |
4,891 | 5,983 | ||||||
| Share-based compensation |
714 | 4,776 | ||||||
| Net operating loss carryforwards |
5,743 | 4,470 | ||||||
| Other tax carryforwards, primarily foreign tax credits |
25,811 | 32,630 | ||||||
| Other |
5,165 | 1,183 | ||||||
|
|
|
|
|
|||||
| Total deferred tax assets before valuation allowance |
43,945 | 55,041 | ||||||
| Less: valuation allowance |
(25,591 | ) | (31,678 | ) | ||||
|
|
|
|
|
|||||
| Net deferred tax assets |
18,354 | 23,363 | ||||||
|
|
|
|
|
|||||
| Intangible assets |
66,253 | 52,778 | ||||||
| Capitalized research and development costs |
1,792 | 822 | ||||||
| Fixed assets |
16 | (447 | ) | |||||
| Deferred revenue |
2,246 | | ||||||
| State taxes |
10,406 | 6,090 | ||||||
| Other |
7,986 | 1,040 | ||||||
|
|
|
|
|
|||||
| Total deferred tax liabilities |
88,699 | 60,283 | ||||||
|
|
|
|
|
|||||
| Net deferred tax liabilities |
$ | (70,345 | ) | (36,920 | ) | |||
|
|
|
|
|
|||||
| Long-term deferred tax assets |
9,850 | 10,678 | ||||||
| Long-term deferred tax liabilities |
(80,195 | ) | (47,598 | ) | ||||
|
|
|
|
|
|||||
| Net deferred tax liabilities |
$ | (70,345 | ) | $ | (36,920 | ) | ||
|
|
|
|
|
|||||
At March 31, 2018 and 2019, the Company had net operating losses (tax-effected) and tax credit carryforwards for income tax purposes before valuation allowance of $31.6 million, and $37.1 million, respectively, that expire in the tax years as follows (in thousands):
| Fiscal Year Ended March 31, | ||||||||||||
| 2018 | 2019 | Expiration | ||||||||||
| Non-U.S. net operating losses |
$ | 4,756 | $ | 4,301 | Indefinite | |||||||
| Non-U.S. net operating losses |
988 | 169 | 2020-2026 | |||||||||
| U.S. federal and state tax carryforwards |
| 2,657 | Indefinite | |||||||||
| U.S. federal and state tax carryforwards, primarily foreign tax credits |
25,811 | 29,973 | 2026-2037 | |||||||||
|
|
|
|
|
|||||||||
| Total Carryforwards |
$ | 31,555 | $ | 37,100 | ||||||||
|
|
|
|
|
|||||||||
Uncertain tax positions
The amount of gross unrecognized tax benefits was $9.1 million and $9.7 million as of March 31, 2018 and 2019, respectively, all of which would favorably affect the Companys effective tax rate if recognized in future periods.
F-25
Table of Contents
The following is a tabular reconciliation of the total amounts of unrecognized tax benefits for the years ended March 31, 2017, 2018, and 2019 (in thousands):
| Fiscal Year Ended March 31, | ||||||||||||
| 2017 | 2018 | 2019 | ||||||||||
| Gross unrecognized tax benefit, beginning of year |
$ | 8,332 | $ | 8,770 | $ | 9,143 | ||||||
| Gross increases to tax positions for prior periods |
461 | 257 | 20 | |||||||||
| Gross decreases to tax positions for prior periods |
(23 | ) | (482 | ) | (70 | ) | ||||||
| Gross increases to tax positions for current period |
| 598 | 560 | |||||||||
|
|
|
|
|
|
|
|||||||
| Gross unrecognized tax benefit, end of year |
$ | 8,770 | $ | 9,143 | $ | 9,653 | ||||||
|
|
|
|
|
|
|
|||||||
As of March 31, 2018 and 2019, the net interest and penalties payable associated with its uncertain tax positions are immaterial. During the years ended March 31, 2017, 2018, and 2019, respectively, the Company recognized an immaterial amount of net interest expense.
The Company has open years from tax periods 2009 and forward, primarily in China. These open years contain matters that could be subject to differing interpretations of applicable tax laws and regulations due to the amount, timing or inclusion of revenue and expenses.
| 8. | Accrued Expenses |
Accrued expenses, current consisted of the following (in thousands):
| March 31, | ||||||||
| 2018 | 2019 | |||||||
| Accrued employee - related expenses |
$ | 32,398 | $ | 35,192 | ||||
| Accrued tax liabilities |
6,929 | 6,274 | ||||||
| Accrued restructuring |
1,953 | 1,488 | ||||||
| Accrued professional fees |
2,219 | 3,440 | ||||||
| Accrued installments for acquisition |
3,616 | 4,832 | ||||||
| Income taxes payable |
870 | 3,811 | ||||||
| Other |
10,447 | 9,883 | ||||||
|
|
|
|
|
|||||
| Total accrued expenses, current |
$ | 58,432 | $ | 64,920 | ||||
|
|
|
|
|
|||||
Accrued expenses, non-current consisted of the following (in thousands):
| March 31, | ||||||||
| 2018 | 2019 | |||||||
| Share-based compensation |
$ | 22,565 | $ | 92,047 | ||||
| Other |
9,345 | 6,312 | ||||||
|
|
|
|
|
|||||
| Total accrued expenses, non-current |
$ | 31,910 | $ | 98,359 | ||||
|
|
|
|
|
|||||
| 9. | Long-term Debt |
On August 23, 2018, the Company entered into the First Lien Credit Agreement to provide for a term loan commitment (the First Lien Term Loan) in which the Company borrowed an aggregate principal amount of $950.0 million, which matures on August 23, 2025. Borrowings under the First Lien Term Loan bear interest, at the Companys election, at either (i) the Alternative Base Rate, as defined per the credit agreement, plus 2.25% per annum, or (ii) LIBOR plus 3.25% per annum, if the net
F-26
Table of Contents
leverage ratio exceeds 4.35 to 1.00 and is subject to a reduction if the net leverage ratio is lower than 4.35 to 1.00 or if there is an initial public offering. Interest payments are due quarterly, or more frequently, based on the terms of the credit agreement. Principal payments required under the First Lien Term Loan are approximately $2.4 million per quarter, commencing on March 31, 2019, with the remainder due at maturity.
On August 23, 2018, the Company entered into the Second Lien Credit Agreement to provide for a second term loan commitment (the Second Lien Term Loan) in which the Company borrowed an aggregate principal amount of $170.0 million. Borrowings under the Second Lien Term Loan bear interest, at the Companys election, at either (i) the Alternative Base Rate, as defined per the credit agreement, plus 6.00% per annum, or (ii) LIBOR plus 7.00% per annum. The maturity date on the Second Lien Term Loan is August 23, 2026, with principal payment due in full on the maturity date. Interest payments are due quarterly, or more frequently, based on the terms of the credit agreement. The First Lien Term Loan and Second Lien Term Loan are collectively referred to as the Term Loans.
The Term Loans require prepayments in the case of certain events including: property or asset sale in excess of $5.0 million, proceeds in excess of $5.0 million from an insurance settlement, or proceeds from a new debt agreement. An additional prepayment may be required under the First Lien Term Loan related to excess cash flow for the respective measurement periods.
All of the indebtedness under the Term Loans is and will be guaranteed by the Companys existing and future material domestic subsidiaries and is and will be secured by substantially all of the assets of the Company and such guarantors. The Term Loans contain customary negative covenants. At March 31, 2019, the Company was in compliance with all applicable covenants pertaining to the Term Loans.
Debt issuance costs and original issuance discount of $15.5 million were incurred in connection with the entry into the Term Loans. These debt issuance costs and original issuance discount will be amortized into interest expense over the contractual term of the Term Loans. The Company recognized $1.2 million of amortization of debt issuance costs and original issuance discount for the year ended March 31, 2019 which is included in the accompanying consolidated statements of operations. At March 31, 2019, the Company had an aggregate principal amount outstanding of $947.6 million and $88.7 million for the First Lien Term Loan and Second Lien Term Loan, respectively, bearing interest at 5.7% and 9.5%, respectively. The Company had $14.3 million of unamortized debt issuance costs and original issuance discount which is recorded as a reduction of the debt balance on the Companys consolidated balance sheets.
During the year ended March 31, 2019, the Company exchanged $57.1 million in satisfaction of $56.9 million of its outstanding principal on its Second Lien Term Loan. As a result, the Company recognized a loss on extinguishment of $0.2 million included in interest income (expense), net in the consolidated statement of operations.
Revolving Facility
The First Lien Credit Agreement further provided for a revolving credit facility (the Revolving Facility) in an aggregate amount of $60.0 million, which matures on August 23, 2023. Borrowings under the Revolving Facility bear interest, at the Companys election, at either (i) the Alternative Base Rate, as defined per the credit agreement, plus 2.25% per annum, or (ii) LIBOR plus 3.25% per annum, if the net leverage ratio exceeds 4.35 to 1.00 and is subject to a reduction if the net leverage ratio is lower than 4.35 to 1.00 or if there is an initial public offering. The Revolving Facility includes a $15.0 million letter of credit sub-facility.
F-27
Table of Contents
The Company incurs fees with respect to the Revolving Facility, including (i) a commitment fee of 0.50% per annum of unused commitments under the Revolving Facility, subject to a reduction based on the First Lien Term Loan net leverage, (ii) facility fees equal to the applicable margin in effect for Eurodollar Rate Loans, as defined per the credit agreement, times the average daily stated amount of letters of credit, (iii) a fronting fee equal to either (a) 0.125% per annum on the stated amount of each letter of credit or (b) such other rate per annum as agreed to by the parties subject to the letters of credit, and (iv) customary administrative fees.
All of the indebtedness under the Revolving Facility is and will be guaranteed by the Companys existing and future material domestic subsidiaries and is and will be secured by substantially all of the assets of the Company and such guarantors.
Debt issuance costs of $0.8 million were incurred in connection with the entry into the Revolving Facility. These debt issuance costs are amortized into interest expense over the contractual term of the loan. The Company recognized $0.1 million of amortization of debt issuance costs for the year ended March 31, 2019 which is included in the accompanying consolidated statements of operations. There were $0.7 million of unamortized debt issuance costs included as a reduction of the debt balance on the accompanying consolidated balance sheets as of March 31, 2019.
The Revolving Facility contains customary negative covenants and does not include any financial maintenance covenants other than a springing minimum net leverage ratio not exceeding 7.50 to 1.00 on the last day of any fiscal quarter, which will be tested only upon the occurrence of an event of default or certain other conditions as specified in the agreement. At March 31, 2019, the Company was in compliance with all applicable covenants pertaining to the Revolving Facility.
As of March 31, 2019, there were no amounts outstanding under the Revolving Facility and there were $0.5 million of letters of credit issued. The Company had $59.5 million of availability under the Revolving Facility as of March 31, 2019.
Debt maturities
The maturities of outstanding debt are as follows (in thousands):
| Fiscal year |
Amount | |||
| 2020 |
$ | 9,500 | ||
| 2021 |
9,500 | |||
| 2022 |
9,500 | |||
| 2023 |
9,500 | |||
| 2024 |
9,500 | |||
| Thereafter |
988,814 | |||
|
|
|
|||
| Total future payments |
$ | 1,036,314 | ||
|
|
|
|||
| 10. | Restructuring Activities |
The Company has undertaken various restructuring activities to achieve its strategic and financial objectives. Restructuring activities include, but are not limited to product offering cancellation and termination of related employees, office relocation, administrative cost structure realignment and consolidation of resources. The Company expects to finance restructuring programs through cash on hand and cash generated from operations. Restructuring costs are estimated based on information available at the time such charges are recorded. In general, management anticipates that restructuring activities will be completed within a time frame such that significant changes to the plan are not likely. Due to the inherent uncertainty involved in estimating restructuring expenses, actual amounts paid for
F-28
Table of Contents
such activities may differ from amounts initially estimated. The Company recorded restructuring expenses of $5.8 million, $4.6 million, and $1.7 million during the years ended March 31, 2017, 2018, and 2019, respectively.
Facility exit costs
Starting in October 2016, the Company began undertaking plans to optimize its U.S. offices, and as result, exited certain leased office spaces. Accordingly, the Company calculated and recorded a liability at the cease-use date related to those operating leases based on the difference between the present value of the estimated future sublease rental income and the present value of remaining lease obligations, adjusted for the effects of any prepaid or deferred items. The Company recorded facility exit charges of $2.0 million, $0.8 million, and zero to Restructuring expenses during the years ended March 31, 2017, 2018, and 2019, respectively. The related liability is recorded in Accrued expenses, current on the consolidated balance sheets.
Transformation activities
During the year ended March 31, 2018, the Company announced a restructuring program designed to better align employee resources with its product offering and future plans, resulting in a reduction in force. Accordingly, the Company calculated and recorded a liability of the estimated termination benefits of $3.8 million.
During the year ended March 31, 2019, the Company announced a restructuring program designed to better align employee resources with its product offerings and future plans.
Restructuring reserves
Restructuring reserve balances of $2.0 million and $1.5 million as of March 31, 2018 and 2019, respectively, are classified as Accrued expenses, current on the consolidated balance sheets. The Company anticipates that the activities associated with the restructuring reserve balance as of March 31, 2019 will be substantially complete by the end of fiscal 2020.
The Companys consolidated restructuring reserves and related activity are summarized below.
|
Employee Termination Benefits |
Lease Abandonment Costs |
Total | ||||||||||
| Balance, March 31, 2017 |
$ | 592 | $ | 601 | $ | 1,193 | ||||||
| Expense |
3,840 | 750 | 4,590 | |||||||||
| Utilization |
(3,714 | ) | (116 | ) | (3,830 | ) | ||||||
|
|
|
|
|
|
|
|||||||
| Balance, March 31, 2018 |
718 | 1,235 | 1,953 | |||||||||
| Expense |
1,715 | | 1,715 | |||||||||
| Utilization |
(1,557 | ) | (623 | ) | (2,180 | ) | ||||||
|
|
|
|
|
|
|
|||||||
| Balance, March 31, 2019 |
$ | 876 | $ | 612 | $ | 1,488 | ||||||
|
|
|
|
|
|
|
|||||||
| 11. | Commitments and Contingencies |
Tax liability
In connection with the initial public offering, the Company will undertake a series of transactions to spin out two wholly owned businesses from the corporate structure. These transactions will generate a taxable gain upon their occurrence which will be payable by the Company or its affiliates.
F-29
Table of Contents
Commitment for operating leases
The Companys commitments for various operating lease agreements relate to office space for various periods that extend through as late as fiscal 2030. Total rent payments under these agreements were approximately $8.7 million, $8.7 million, and $11.3 million for the years ended March 31, 2017, 2018, and 2019, respectively. Certain of these lease agreements contain provisions for renewal options and escalation clauses.
The following table summarizes payments under the Companys operating lease commitments as of March 31, 2019 (in thousands):
| Fiscal year |
Amount | |||
| 2020 |
$ | 13,464 | ||
| 2021 |
12,872 | |||
| 2022 |
9,453 | |||
| 2023 |
9,099 | |||
| 2024 |
8,570 | |||
| Thereafter |
21,634 | |||
|
|
|
|||
| Total future contractual payments |
$ | 75,092 | ||
|
|
|
|||
Legal matters
From time to time, the Company may be a party to lawsuits and legal proceedings arising in the ordinary course of business. In the opinion of the Companys management, these matters, individually and in the aggregate, will not have a material adverse effect on the financial condition and results of the future operations of the Company.
| 12. | Members Deficit |
Dynatrace Holdings LLC was reorganized on April 1, 2015 and has 100 common units as of March 31, 2018 and 2019. All common units were held by its sole member, Thoma Bravo Fund XI-A, L.P. In connection with the reorganization transactions described in Note 2, the common units held by Thoma Bravo Fund XI-A, L.P. were converted into shares of common stock.
| 13. | Share-based Compensation |
Compuware Parent LLCs board of directors (the Board) has authorized the issuance of 24.1 million Management Incentive Units (MIUs) and 0.8 million Appreciation Units (AUs) to certain executive officers and key employees of Dynatrace. The MIUs consist of two types of units which are classified as performance-vested units and time-vested units.
Performance-vested units include four performance targets which vest 25% after each fiscal year end, upon the Boards confirmation that the performance target was met for such fiscal year. These units have a requisite service period that varies based on the grant date, but the service period begins on the grant date and ends on achievement of the final fiscal year performance target. The performance criterion for vesting of performance units has been based on the Companys EBITDA compared to the target established and approved for each fiscal year. Units that are vested based upon performance for any given year for which the target was not met shall not vest, and are subject to repurchase by the Company, Compuware Parent LLC, or TB at any time; provided, that if the target is not met for a given year, but the target for the subsequent year is met, the unvested performance-based units for the previous year shall become vested when the target for the subsequent year was met.
F-30
Table of Contents
Time-vested units vest at 25% one year after grant date (or one year after the vesting start date, if different) and the remaining 75% vest ratably over a 36-month period. These units have a requisite service period of 48 months (or the period from the grant until three years from the date that the first 25% vested) and can be repurchased by the Company, Compuware Parent LLC, or TB at any time.
The Board began offering AUs to non-US employees beginning on January 1, 2018. At that time, participants who had been granted MIUs were offered the chance to exchange their MIUs for AUs. At the time of the exchange 356,792 MIUs were exchanged for AUs with participation thresholds ranging from $0.00 - $0.55.
Total compensation expense related to the MIUs and AUs for the respective periods is presented in the table below (in thousands).
| Fiscal Year Ended March 31, | ||||||||||||
| 2017 | 2018 | 2019 | ||||||||||
| Cost of revenues |
$ | 28 | $ | 1,720 | $ | 5,777 | ||||||
| Research and development |
71 | 3,858 | 12,566 | |||||||||
| Sales and marketing |
122 | 7,536 | 24,673 | |||||||||
| General and administrative |
128 | 9,180 | 28,135 | |||||||||
|
|
|
|
|
|
|
|||||||
| Total compensation expense |
$ | 349 | $ | 22,294 | $ | 71,151 | ||||||
|
|
|
|
|
|
|
|||||||
The following table shows the MIU activity for the year ended March 31, 2019:
| Number of Units |
Weighted Average Participation Threshold |
Fair Value | ||||||||||
| MIUs outstanding as of March 31, 2018 |
24,106,646 | $ | 0.10 | $ | 1.64 | |||||||
| Units granted during the year |
1,780,900 | 3.62 | ||||||||||
| Units exchanged for AUs during the year |
(108,406 | ) | 0.20 | |||||||||
| Units forfeited/repurchased during the year |
(1,666,970 | ) | 0.12 | |||||||||
|
|
|
|
|
|
|
|||||||
| MIUs outstanding as of March 31, 2019 |
24,112,170 | $ | 0.36 | $ | 5.45 | |||||||
|
|
|
|
|
|
|
|||||||
| MIUs vested as of March 31, 2019 |
19,956,710 | |||||||||||
The following table shows the AU activity for the year ended March 31, 2019:
| Number of Units |
Weighted Average Participation Threshold |
Fair Value | ||||||||||
| AUs outstanding as of March 31, 2018 |
381,792 | $ | 0.17 | $ | 1.64 | |||||||
| Units converted from MIUs |
108,406 | 0.20 | ||||||||||
| Units granted during the year |
349,000 | 2.55 | ||||||||||
| Units forfeited/repurchased during the year |
(20,000 | ) | 0.41 | |||||||||
|
|
|
|
|
|
|
|||||||
| AUs outstanding as of March 31, 2019 |
819,198 | $ | 1.18 | $ | 5.45 | |||||||
|
|
|
|
|
|
|
|||||||
| AUs vested as of March 31, 2019 |
376,588 | |||||||||||
The fair value of the equity units underlying the MIUs and AUs has historically been determined by the board of directors as there was no public market for the equity units. The board of directors determines the fair value of the Companys equity units by considering a number of objective and subjective factors including: the valuation of comparable companies, the Companys operating and financial performance, the lack of liquidity of common stock, and general and industry specific economic outlook, amongst other factors.
F-31
Table of Contents
The participation threshold is determined by the Board, based on the fair market value on the grant issuance date upon vesting or settlement, the value associated with the MIU is the difference between the fair value of the unit and the associated participation threshold. The awards are marked to market at the balance sheet date. The weighted average grant date fair value of units granted during the years ended March 31, 2017, 2018 and 2019 was $0.01, $0.82, and $3.62, respectively.
The following key assumptions were used to determine the fair value of the MIUs and AUs for fiscal 2017, 2018, and 2019:
| 2017 | 2018 | 2019 | ||||||||||
| Expected dividend yield |
| | | |||||||||
| Expected volatility |
110 | % | 50 | % | 50% - 60 | % | ||||||
| Expected term (years) |
3.75 | 2.5 | 1.0 - 1.5 | |||||||||
| Risk-free interest rate |
1.67 | % | 2.34 | % | 2.33% - 2.40 | % | ||||||
At March 31, 2019, there was $18.5 million of total unrecognized compensation cost related to unvested units granted under the Plan. That cost is expected to be recognized over a weighted average period of 1.0 - 1.5 years. The total fair value of units vested during the years ended March 31, 2017, 2018 and 2019 was $0.3 million, $22.6 million, and $92.0 million, respectively.
| 14. | Earnings Per Share |
The following table sets forth the computation of basic and diluted net income (loss) per share (dollars in thousands, except per share data):
| Fiscal Year Ended March 31, | ||||||||||||
| 2017 | 2018 | 2019 | ||||||||||
| Numerator: |
||||||||||||
| Net income (loss) |
$ | 796 | $ | 9,222 | $ | (116,194 | ) | |||||
| Denominator: |
||||||||||||
| Weighted average units outstanding, basic and diluted |
||||||||||||
|
|
|
|
|
|
|
|||||||
| Net income (loss) per unit, basic and diluted |
$ | $ | $ | |||||||||
|
|
|
|
|
|
|
|||||||
| 15. | Related Party Transactions |
The Company has agreements with Thoma Bravo, LLC for financial and management advisory services. During the years ended March 31, 2017, 2018, and 2019, the Company incurred $2.8 million, $4.9 million, and $4.9 million, respectively, related to these services. The related expense is reflected in General and administrative expense in the consolidated statements of operations.
The Company had payments to directors of $0.3 million during the years ended March 31, 2017, 2018, and 2019. Additionally, directors had 2.3 million MIUs outstanding at March 31, 2018 and 2019.
During the years ended March 31, 2018 and 2019, the Company has transfers to related parties of $3.9 million and $0.8 million, respectively, which are included in Additional paid-in capital in the consolidated balance sheets.
During the years ended March 31, 2017, 2018, and 2019, the Company transferred cash to related parties of $62.7 million, $74.6 million, and $1,177.0 million, respectively, related to debt service and shared costs. Other related party settlements resulted in an increase in payables to related parties of $25.6 million, $35.2 million, and $14.3 million for the years ended March 31, 2017, 2018, and 2019, respectively.
In the year ended March 31, 2017, the Company transferred certain assets related to its Mobile Test offerings to another company under common control. As no consideration was exchanged, the Company recorded an equity transfer to a related party of $2.3 million on a pre-tax basis.
F-32
Table of Contents
| 16. | Related Party Debt |
On April 1, 2015, the Company entered into $1.8 billion in subordinated demand promissory notes payable to Compuware Corporation (Compuware), a related party. The promissory notes were established in connection with Compuwares external debt financing. All payments of principal and interest are payable on the earliest to occur of (i) demand by the holder, (ii) June 1, 2023 and (iii) the date of acceleration of the promissory notes as a result of the occurrence of an event of default. The Company may prepay the promissory notes at any time without penalty. At March 31, 2018 and 2019, the Company had principal outstanding of $1.7 billion and $478.5 million, respectively, included in the consolidated balance sheet as payable to related party. At March 31, 2018 and 2019, the Company accrued interest on the promissory notes of $91.3 million, at a rate of 2.12% per annum, and $118.7 million at a rate of 2.72% per annum, respectively, included as a payable to related party in the consolidated balance sheet. For the years ended March 31, 2017, 2018 and 2019, interest expense on the promissory notes were $25.6 million, $35.2 million, and $27.4 million, respectively, and is included in the consolidated statements of operations in interest expense, net. As a result of the August 23, 2018 financing transaction, as described in Note 9 - Long-term Debt, the amount was reduced by the net proceeds of the financing obtained by Dynatrace LLC, leaving $597.2 million in principal and interest outstanding. In connection with the spin-off, the corresponding receivable at Compuware will be contributed to the Registrant and will eliminate this balance after consolidation.
| 17. | Employee Benefit Plan |
The Company has established a 401(k) tax-deferred savings plan (the 401(k) Plan), which permits participants to make contributions by salary deduction pursuant to Section 401(k) of the Code. The Company is responsible for administrative costs of the 401(k) Plan and may, at its discretion, make matching contributions to the 401(k) Plan. For the years ended March 31, 2017, 2018 and 2019, the Company made contributions of $1.5 million, $1.4 million and $1.9 million to the 401(k) Plan, respectively.
| 18. | Geographic Information |
Revenue
Revenues by geography are based on legal jurisdiction. Refer to Note 2 - Significant Accounting Policies for a disaggregation of revenue by geographic region.
Property and equipment, net
The following tables present property and equipment by geographic region for the periods presented (in thousands):
| March 31, | ||||||||
| 2018 | 2019 | |||||||
| North America |
$ | 13,311 | $ | 10,036 | ||||
| Europe, Middle East and Africa |
4,755 | 7,347 | ||||||
| Asia Pacific |
312 | 376 | ||||||
| Latin America |
100 | 166 | ||||||
|
|
|
|
|
|||||
| Total property and equipment, net |
$ | 18,478 | $ | 17,925 | ||||
|
|
|
|
|
|||||
| 19. | Subsequent Events |
The Company has evaluated subsequent events through the date and time the financial statements were available to be issued on and has nothing additional to report.
F-33
Table of Contents

Table of Contents
PART II
INFORMATION NOT REQUIRED IN PROSPECTUS
Item 13. Other Expenses of Issuance and Distribution.
The following table sets forth all expenses to be paid by the registrant, other than underwriting discounts and commissions, upon the completion of this offering. All amounts shown are estimates except for the SEC registration fee, the FINRA filing fee and the New York Stock Exchange listing fee.
| Amount to be Paid | ||||
| SEC registration fee |
$ | * | ||
| FINRA filing fee |
|
|
* |
|
| New York Stock Exchange listing fee |
* | |||
| Printing and engraving expenses |
* | |||
| Legal fees and expenses |
* | |||
| Accounting fees and expenses |
* | |||
| Transfer agent and registrar fees |
* | |||
| Miscellaneous expenses |
* | |||
|
|
|
|||
| Total |
$ | * | ||
|
|
|
|||
| * | To be filed by amendment. |
Item 14. Indemnification of Directors and Officers.
The registrant is incorporated under the laws of the State of Delaware. Section 145 of the DGCL provides that a Delaware corporation may indemnify any persons who were, are or are threatened to be made parties to any threatened, pending or completed action, suit or proceeding, whether civil, criminal, administrative or investigative (other than an action by or in the right of such corporation), by reason of the fact that such person is or was an officer, director, employee or agent of such corporation, or is or was serving at the request of such corporation as an officer, director, employee or agent of another corporation or enterprise. The indemnity may include expenses (including attorneys fees), judgments, fines and amounts paid in settlement actually and reasonably incurred by such person in connection with such action, suit or proceeding, provided that such person acted in good faith and in a manner he or she reasonably believed to be in or not opposed to the corporations best interests and, with respect to any criminal action or proceeding, had no reasonable cause to believe that his or her conduct was illegal. A Delaware corporation may indemnify any persons who were, are or are threatened to be made a party to any threatened, pending or completed action or suit by or in the right of the corporation by reason of the fact that such person is or was a director, officer, employee or agent of such corporation, or is or was serving at the request of such corporation as a director, officer, employee or agent of another corporation or enterprise. The indemnity may include expenses (including attorneys fees) actually and reasonably incurred by such person in connection with the defense or settlement of such action or suit provided such person acted in good faith and in a manner he or she reasonably believed to be in or not opposed to the corporations best interests except that no indemnification is permitted without judicial approval if the officer or director is adjudged to be liable to the corporation. Where an officer or director is successful on the merits or otherwise in the defense of any action referred to above, the corporation must indemnify him or her against the expenses (including attorneys fees) actually and reasonably incurred.
The registrants charter and bylaws, provide for the indemnification of its directors and officers to the fullest extent permitted under the DGCL.
II-1
Table of Contents
Section 102(b)(7) of the DGCL permits a corporation to provide in its certificate of incorporation that a director of the corporation shall not be personally liable to the corporation or its stockholders for monetary damages for breach of fiduciary duties as a director, except for liability for any:
| | transaction from which the director derives an improper personal benefit; |
| | act or omission not in good faith or that involves intentional misconduct or a knowing violation of law; |
| | unlawful payment of dividends or redemption of shares; or |
| | breach of a directors duty of loyalty to the corporation or its stockholders. |
The registrants charter includes such a provision. Expenses incurred by any officer or director in defending any such action, suit or proceeding in advance of its final disposition shall be paid by the registrant upon delivery to it of an undertaking, by or on behalf of such director or officer, to repay all amounts so advanced if it shall ultimately be determined that such director or officer is not entitled to be indemnified by the registrant.
Section 174 of the DGCL provides, among other things, that a director who willfully or negligently approves of an unlawful payment of dividends or an unlawful stock purchase or redemption may be held liable for such actions. A director who was either absent when the unlawful actions were approved or dissented at the time may avoid liability by causing his or her dissent to such actions to be entered in the books containing minutes of the meetings of the board of directors at the time such action occurred or immediately after such absent director receives notice of the unlawful acts.
The registrants policy is to enter into separate indemnification agreements with each of its directors and officers that provide the maximum indemnity allowed to directors and executive officers by Section 145 of the DGCL and also to provide for certain additional procedural protections. The registrant also maintains directors and officers insurance to insure such persons against certain liabilities.
These indemnification provisions and the indemnification agreements entered into between the registrant and its officers and directors may be sufficiently broad to permit indemnification of the registrants officers and directors for liabilities (including reimbursement of expenses incurred) arising under the Securities Act of 1933, as amended.
The underwriting agreement to be filed as Exhibit 1.1 to this registration statement will provide for indemnification by the underwriters of the registrant and its officers and directors for certain liabilities arising under the Securities Act and otherwise.
Item 15. Recent Sales of Unregistered Securities.
In the three years preceding the filing of this registration statement, we have not issued any securities that were not registered under the Securities Act.
II-2
Table of Contents
Item 16. Exhibits and Financial Statement Schedules.
(a) Exhibits.
EXHIBIT INDEX
| Exhibit |
Description |
|
| 1.1* | Form of Underwriting Agreement. | |
| 3.1* | Amended and Restated Limited Liability Company Agreement of the Registrant, dated as of August 23, 2018. | |
| 3.2* | Form of Amended and Restated Certificate of Incorporation of the Registrant (to be effective upon the completion of this offering). | |
| 3.3* | Form of Amended and Restated Bylaws of the Registrant (to be effective upon the completion of this offering). | |
| 4.1* | Specimen Common Stock Certificate. | |
| 4.2* | Amended and Restated Registration Rights Agreement. | |
| 5.1* | Opinion of Goodwin Procter LLP. | |
| 10.1*# | 2019 Equity Incentive Plan, and forms of award agreements thereunder. | |
| 10.2*# | Management Incentive Plan. | |
| 10.3*# | 2019 Employee Stock Purchase Plan. | |
| 10.4*# | Annual Short-Term Incentive Plan. | |
| 10.5*# | Form of Indemnification Agreement between the Registrant and each of its directors and executive officers. | |
| 10.6*# | Executive Officer Employment Agreements, by and between Registrant and John Van Siclen, to be entered into in connection with this offering. | |
| 10.7*# | Executive Officer Employment Agreements, by and between Registrant and Kevin Burns, to be entered into in connection with this offering. | |
| 10.8*# | Executive Officer Employment Agreements, by and between Registrant and Stephen Pace, to be entered into in connection with this offering. | |
| 10.9*# | Executive Officer Employment Agreements, by and between Registrant and Bernd Greifeneder, to be entered into in connection with this offering. | |
| 10.10* | Senior Secured First Lien Credit Agreement, by and among Dynatrace LLC, Dynatrace Intermediate LLC, Jefferies Finance LLC and the other Lenders Parties listed thereto, dated as of August 23, 2018. | |
| 10.11* | Senior Secured Second Lien Credit Agreement, by and among Dynatrace LLC, Dynatrace Intermediate LLC, Jefferies Finance LLC and the other Lenders Parties listed thereto, dated as of August 23, 2018. | |
| 10.12* | Office Lease, dated July 6, 2017, by and between BP Reservoir Place LLC and Dynatrace LLC. | |
II-3
Table of Contents
| Exhibit |
Description |
|
| 10.13* | Declaration Affixing the Commencement Date of the Lease, dated November 15, 2017, by and between BP Reservoir Place LLC and Dynatrace LLC. | |
| 10.14* | Mietvertrag, dated as of March 28, 2017, by and between Neunteufel GmbH and Dynatrace Austria GmbH. | |
| 10.15* | Form of Tax Matters Agreement to be entered into between Dynatrace Holdings LLC and Compuware Software Group LLC. | |
| 10.16* | Form of Master Structuring Agreement to be entered into by and among Dynatrace Holdings, LLC, Compuware Software Group, LLC and the other parties named therein. | |
| 21.1* | Subsidiaries of the Registrant. | |
| 23.1* | Consent of Goodwin Procter LLP (included in Exhibit 5.1). | |
| 23.2* | Consent of BDO USA LLP. | |
| 24.1* | Power of Attorney (included on the signature page hereto). | |
| * | To be included by amendment. |
| # | Indicates a management contract or any compensatory plan, contract or arrangement. |
(b) Financial Statement Schedules.
All financial statement schedules are omitted because the information called for is not required or is shown either in the consolidated financial statements or in the notes thereto.
Item 17. Undertakings.
The undersigned registrant hereby undertakes to provide to the underwriters at the closing specified in the underwriting agreement certificates in such denominations and registered in such names as required by the underwriters to permit prompt delivery to each purchaser.
Insofar as indemnification for liabilities arising under the Securities Act of 1933 may be permitted to directors, officers and controlling persons of the registrant pursuant to the foregoing provisions, or otherwise, the registrant has been advised that in the opinion of the Securities and Exchange Commission such indemnification is against public policy as expressed in the Act and is, therefore, unenforceable. In the event that a claim for indemnification against such liabilities (other than the payment by the registrant of expenses incurred or paid by a director, officer or controlling person of the registrant in the successful defense of any action, suit or proceeding) is asserted by such director, officer or controlling person in connection with the securities being registered, the registrant will, unless in the opinion of its counsel the matter has been settled by controlling precedent, submit to a court of appropriate jurisdiction the question whether such indemnification by it is against public policy as expressed in the Act and will be governed by the final adjudication of such issue.
The undersigned registrant hereby undertakes that:
(1) For purposes of determining any liability under the Securities Act of 1933, the information omitted from the form of prospectus filed as part of this registration statement in reliance upon Rule 430A and contained in a form of prospectus filed by the registrant pursuant to Rule 424(b)(1) or (4) or 497(h) under the Securities Act shall be deemed to be part of this registration statement as of the time it was declared effective.
(2) For the purpose of determining any liability under the Securities Act of 1933, each post-effective amendment that contains a form of prospectus shall be deemed to be a new registration statement relating to the securities offered therein, and the offering of such securities at that time shall be deemed to be the initial bona fide offering thereof.
II-4
Table of Contents
SIGNATURES
Pursuant to the requirements of the Securities Act of 1933, the registrant has duly caused this registration statement on Form S-1 to be signed on its behalf by the undersigned, thereunto duly authorized, in Waltham, Massachusetts on , 2019.
| DYNATRACE HOLDINGS LLC | ||
| By: |
|
|
| John Van Siclen Chief Executive Officer |
||
POWER OF ATTORNEY
KNOW ALL PERSONS BY THESE PRESENTS, that each person whose signature appears below hereby constitutes and appoints John Van Siclen, Kevin Burns and Craig Newfield, and each of them, as his true and lawful attorney-in-fact and agent with full power of substitution, for him in any and all capacities, to sign any and all amendments to this registration statement (including post-effective amendments or any abbreviated registration statement and any amendments thereto filed pursuant to Rule 462(b) under the Securities Act of 1933 increasing the number of securities for which registration is sought), and to file the same, with all exhibits thereto and other documents in connection therewith, with the Securities and Exchange Commission, granting unto said attorney-in-fact, proxy, and agent full power and authority to do and perform each and every act and thing requisite and necessary to be done in connection therewith, as fully for all intents and purposes as he might or could do in person, hereby ratifying and confirming all that said attorney-in-fact, proxy and agent, or his substitute, may lawfully do or cause to be done by virtue hereof.
Pursuant to the requirements of the Securities Act of 1933, this registration statement on Form S-1 has been signed by the following persons in the capacities and on the dates indicated.
| Signature |
Title |
Date |
||||
|
John Van Siclen |
|
Chief Executive Officer and Director (Principal Executive Officer) |
, 2019 | |||
|
Kevin Burns |
Chief Financial Officer, Treasurer and Secretary (Principal Financial and Accounting Officer) | , 2019 | ||||
|
Seth Boro |
Director | , 2019 | ||||
|
Chip Virnig |
Director | , 2019 | ||||
|
James K. Lines |
Director | , 2019 | ||||
|
Paul Zuber |
Director | , 2019 | ||||
II-5